DXY MONDAY OUTLOOKIn this video update, we take a look at the DXY and plan for the week ahead. We like to analyse this on a Monday to help gauge the strength or weakness of the greenback and where we can best position ourselves around it.
President Trump is questioning himself as to why the stock markets are falling and is it his fault. Trump wants a weaker dollar and higher stock market and he may start to put pressure on the FED to meet his demands.
Blueberrymarkets

DXY...WHERE WILL IT FINISH AFTER NFPIn this video update, we take a look at the DXY. We expect downside here however if we do see a shock in the numbers the $97.00 resistance that the market has struggled to get above of recent could be broken.
The numbers are forecast to be slightly softer, as well as the US Bond market selling off, the USD could be in for a decline.

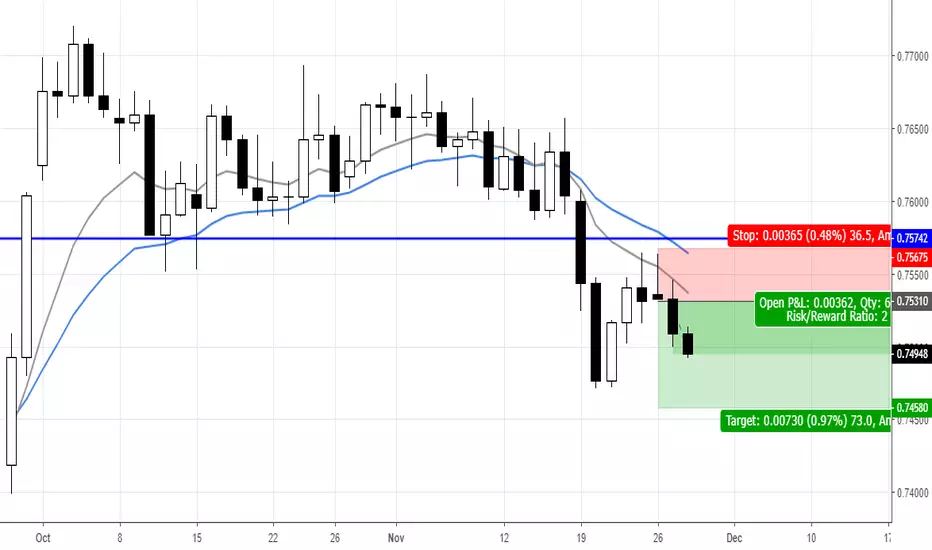
EURNZD DOWNTREND CONTINUATION Looking at the EURNZD pair, daily chart we can see the current downtrend in play. Seasonally, EURO has it's best performing month in December however, NZD longs
still look in play as it heads towards the 0.7000 level. Technically this looks good for trend continuation and if we do see bearish price action here we could anticipate another impulse
move lower.

NFP DAY- WATCH USDJPY CLOSELYIn today's first video update, we take a look at USDJPY as the markets move from risk on to risk off the with safe haven currency taking hold of the market this week.
NFP numbers are expected to be a bit softer and if we see a decline in jobs and the averages hourly earnings we could expect a further drop in the price of USDJPY.

NIKKEI DOWNSIDE CONTINUATION LIKELYThe NIKKEI is seeing significant downside largely due to the current strength of the JPY. With the outflow from the stock indicies to the safe havens, we should see further downside to the key support of 20240.00.
Look for continuation trades on the lower timeframes.

CADCHF DOWNSIDE CONTINUATIONWe have been looking for for this market to move lower from the key resistance of 0.7570, with the BOC holding interest rates at 1.75% we saw the market move significantly lower taking at the previous daily structure lows.
Currently, price is sitting at the daily 127.2 extension where we could see some short-term support before seeing a continuation down the weekly support of 0.7262.

SPX500 DOWNSIDE CONTINUATIONIn another video update, we take a look at the current situation with the SPX500 and if we are to see more downside how we can take advantage of it.

XAUUSD (GOLD) UPSIDE CONTINUATIONIn today's video update, we take a look at GOLD and how money seems to be flowing into the safe haven.

EURJPY DOWNSIDE CONTINUATIONEURJPY has been on our watchlist as price breaks through a key trendline support. The daily chart confirmed the lower low, lower close and we should see further downside as money moves
from the equities to the safe havens such as JPY and GOLD.
Looking to the 4hr timeframe we can see the lower low clearly and if we see the market retrace to the resistance at the previous structure lows around the 128.25.
We will look for targets down the key swing support level of 127.20.

USDNOK DOWNSIDE WITH OIL STRENGTHUSDNOK downside looks likely as USD pushes lower. This combined with the current OPEC decision to cut oil production could help the NOK a heavy producer and exporter of oil to increase in value.
Technically the daily timeframe is still in an uptrend, however looking to the 4hr timeframe you can see the head and shoulders pattern has been completed, which is an early sign of a change in trend.
We also have the confluence of a higher timeframe trendline support being broken with price closing below. This is an early indication of further downside.
Minor resistance and head and shoulder neckline of 8.5200 would be an ideal place to look for a short opportunity.

USDJPY DOWNSIDE CONTINUATIONAgain looking to take advantage of the USD sell off, USDJPY has formed lower lows on the 4hr timeframe and looks to continue lower.
We have a minor resistance level up at the 113.20 previous structure lows. If price can retrace into the resistance and interact with this
zone and bearish moving averages we can look for further short opportunities with 112.00 the key targets.

EURUSD UPSIDE CONTINUATIONNow the USD has broken through the key trendline support we could potentially see a significant USD sell off.
The 4hr chart here has started to form higher highs and higher lows and could continue the uptrend.
Our moving averages have crossed bullish on this timeframe also adding to our confluence. Applying the Fibonacci we can see the
50% fib retracement is sitting at a minor area of structure. If price retraces to here and forms bullish price action we will look for a long
opportunity into the 127.2 fib extension.

DOW UPSIDE CONTINUATIONStock market upside continuation is highly likely now with the short-term truce between Trump and China. 4hr chart here showing clear upside to come in the markets, looking for pullbacks into the averages before looking for long opportunities. The 61,8 fib retracement has a minor support level when looking left holding a likely area for the market to move higher from. Look for longs to the key resistance of 26800.00.

OIL BOUNCE BACK ON THE CARDSUSOil has bounced back from the $50.00 level and could see further upside. OPEC has agreed to cut production, this will limit the supply and increase demand for the commodity.
As demand increases so will the price and we should see some relief to the current downside we are seeing in Oil.
Looking at the 4hr chart we can see that the market has formed higher highs and the moving averages have now crossed bullish. Applying Fibs we can see the 61.8 retracement is
sitting at the previous structure highs and would be an area of interest if the market formed bullish price action here. 1st targets up at the 127.2 fib extension and follow the 4hr trend higher.

USD LIKELY TO MOVE AS TRUMP AGREES SHORT TERM TRUCE WITH CHINAOver the weekend we saw headlines out of the G20 meetings and in particular a sort of truce between Trump and China with regards to current trade tariffs. They have put a hold on trade war spats for a few months to come to a fair agreement between the 2 nations.
This will likely help the stock markets move higher with a move back to risk on. Buying the Indexes and some selling of the USD. However, time will tell how long this will hold up for. If we see a break and close above the $97.00 we should see some upside to the USD, a break below the supporting trendline further downside will occur. Patience is key here to see clear direction before getting involved.

GBPJPY DOWNSIDE BEARISH PATTERNGBPJPY has been stuck consolidating at a key resistance point with 61.8 fib confluence. Price is currently forming a descending triangle pattern and if price breaks and closes below the supporting trendline we could see further downside into the 127.2 Fib extension of 142.70. This market could be prone to downside due to Brexit risk, especially on December 11th where parliament will vote on PM May Brexit agreement.

DAX DOWNSIDE CONTINUATIONIndex's look fragile again despite the recent upside we have currently seen. Our moving averages remain bearish and we could see prices fall further into the 10780.00 support.
Traders have been looking for the rebound in the indices and are likely to cause further selling and new lows before seeing significant upside.

AUDUSD SHORT BREATHERAUDUSD saw a move higher this week largely due to the weakness in the USD. We have now seen price stall at the recent resistance of 0.7340 and could see the market hold here forming a brief consolidation.
Typically when the market breaks higher we will see a short pause before buying resumes. A break and close above the resistance we will look for continued long opportunities into the next resistance of 0.7500.

GOLD UPSIDE LIKELYAgain as we stated before we expected the USD to fall this week and this has led to a rise in the price of Gold.
The market has been working between technical levels as of late and found support at the key $1215.00 support zone.
Looking for long opportunities here for long trades into the key resistance around $1240.00 especially through December.

USOIL BACK TO $50.00...OVEREXTENDED?USOIL has no tested $50.00 a barrel and could find some support here. The Oil market has been significantly bearish and we have managed to catch the majority of the move down.
However, the price has now come to a critical level and looks to be seriously overextended. If you move up the weekly chart you will see how far price has moved from the Moving Averages and we could see
prices push to test these over the coming weeks.

EURUSD BULLISH ENGULFING CANDLEWe spoke earlier this week about the potential of EURUSD moving higher as FED Chair Powell tries to play down the rate of which they will hike interest rates in 2019.
Technically the 1.1300 support has held and price formed a bullish engulfing candle on the daily chart. This is a strong indication that price could move higher towards the next resistance of 1.1780.

CADCHF TREND CONTINUATION CADCHF was on our list this week as we saw price break and form new lows on the daily chart. Once price re-tested the moving averages it formed a bearish inside candle. We took a short position on the low with stops above the highs.
Expecting this market to move lower in line with our strategy.
AUS200 LONG OPPORTUNITIESIn today's video update, we take a look at the AUD index as we see price start to accumulate at the key weekly support. If we see price turn bullish here on our trading timeframe we can look for long opportunities.
