btc 8\24 updatefigured it out. it's a simple zig-zag correction.
fib channels line up nicely, and we just completed 5 waves down into wave (A)
wave 3 saw an extension which caught me off-guard, but it resolved itself nicely at the end there.
currently working on the mean-retracement into wave B
before a move down into wave C to about 48k
down there i'll be a bigger buyer.
will work on figuring out the upside target when the time comes, for now let's let this play out and take it from 48k.
BLX

BTC don't breakout please!! hahahhaaMarket Cap $914,600,050,171
24 Hour Trading Vol $37,553,906,051
Fully Diluted Valuation $1,021,839,693,000
Circulating Supply 18,796,100
Total Supply 21,000,000
Max Supply 21,000,000

a simple solution to a perplexing problem(theory)this is only a theory, nothing more. my best take at a problem which has a lot of people at a quatervois recently (myself included).
-----
there are only two kinds of moves within these markets:
1. impulses
2. corrections
if it ain't an impulse, then it's gotta be a correction - simple as that.
can we agree that the choppy move from july 20th is not an impulse?
it's a clean 3 wave move, with decreasing volume as we get higher. just look for yourself, the 3 day volume has almost come to a complete halt over the last few days, with some sporadic pumps that take us nowhere.
i think this larger correction is only half way completed, and we have another 6~7 months of pain before it becomes tendie season again.
don't think of this bear phase as something negative either, look at it from the perspective of - if you're willing to wait it out, you can buy crypto at the absolute bottom next year, and cash out big at the next top ;).
could totally be wrong here, but it's just a vibe i get from these markets, an intuitive feeling which i can't explain in words.
only time will tell where this thing goes, so let's take it day by day, and work with what we have in front of us for the time being.
💸

BTC/USD (48k Short Term Support)💎Technical Analysis Summary💎
BTC/USD
-The 50k dollar is acting as resistance today
-The Short term support is about to get tested
-Using the Fib levels, we can see the 48k dollar support
-This is a confluence of the previous resistance area
-If the Buyers or Bulls can defend this region
-Expect more upside for the Altcoin space this week
-Good luck guys and always prepare for your next trade
⚠️Please always read the description⚠️
Thanks for donating 💰 via Tradingview coins bitcoinpam 🙏🎉
``````````````````````````````````````````````
If you need help🙋 don't hesitate to
Send me a message here PolarHusk 😊
``````````````````````````````````````````````
Trading Involves High Risk ⚠️
Not Financial Advice 💸
Exercise Proper Risk Management 💱
``````````````````````````````````````````````

"The law of alternation" (btc)The rule of Alternation:
There is a general tendency for the pattern of the two corrective swings in a completed 5-wave sequence to alternate between a simple (very often an ABC) correction and one of the more complicated or complex Elliott corrections.
The law of alternation states: if wave 2 is a simple correction, wave 4 will be complex. In the contrarian case, if wave 2 is complex, wave 4 will be simple.
----
As you can see since the beginning of time, the corrections have alternated between simple ones, and complex structures.
Covid crash was a simple zig-zag, which leads me to believe that this wave 4 is going to be complex.
i do think we will be seeing 22k by march\april of next year, but it won't go down without a fight.
nobody knows when the top is going to be in for this current move, but i theorize it'll be anywhere between 51~59k before it enters into a triangle \ complex distribution phase - similar to what we've seen in the past.
i'm in no way bearish on btc, in fact i've some extraordinary upside targets for the future - just not before this correction ends.
we flow with the waves in either direction, and we move with the markets, forever and a day.
ps. i'll stay trying to trade the shorter term structures as they come, but they're getting harder and harder to decrypt as we near the end of this move.
💸

BTC/USD (Testing Key Fib Resistance)💎Technical Analysis Summary💎
BTC/USD
-Bitcoin is now trading inside the weekly resistance zone
-Currently, the price is reacting with resistance Fib 0.618
-There is no major rejection yet at this moment
-The Bulls are doing a good job maintaining this region
-If the Buyers can hold the price above 46k this week
-I think the chances to break above 49k increases
-For now, I can't see any correction or pullback yet
-So the overall market should be safe in the coming days
-But still, be cautious because BTC is testing the mid resistance
-Good luck and stay safe everyone!
⚠️Please always read the description⚠️
Thanks for donating 💰 via Tradingview coins bitcoinpam 🙏🎉
``````````````````````````````````````````````
If you need help🙋 don't hesitate to
Send me a message here PolarHusk 😊
``````````````````````````````````````````````
Trading Involves High Risk ⚠️
Not Financial Advice 💸
Exercise Proper Risk Management 💱
``````````````````````````````````````````````

Bitcoin 2022 - BTC / BLXBitcoin targets for the end of the year or beginning of 2022..
I believe we can reach 225k =)
Print for me.
Good luck and stay safe.

BLX (Global Idea)Analysis of the BLX chart. On the chart, he showed his long-term vision for Bitcoin from the current days of 2021 to 2025.
When parsing, I relied on Bitcoin cycles, its history. I also took into account the halving of 2024, I put forward my assumption on it on the chart.
The long-term picture for Bitcoin.

The great BTC 2015 to 2021 bull runYes, I said 2015 to 2021. This bull run did not start in 2018. It started earlier. How do I know?
It has been known to many, that the 2013 fractal matched the current bull run. But there was never any good explanation besides the crypto gods did it. Well there is a more earthly reason.
The pumps and retraces of the 2011-2013 bull run hit standard fibonacci numbers. And apparently, the 2015 to present bull run has hit the same numbers for each corresponding wave. Statistically, this is a possible if to compare two whole wave counts of one degree. Kind of like winning many horse races in a row. And the fibonacci numbes bear this out.
**For both bull runs:**
Wave (I)
Wave (II) = 0.786+ retrace
Wave (III) = 2.618 of wave 1
Wave (IV) = 0.50 +
Wave (V) = 2.618 of wave 1 (current wave V has not topped yet, so remains to be seen if it will also be a 2.618
**But it gets even crazier, but statistically possible.**
Many of the subwaves matched as well as shown in the chart below.
Now to imagine, that two separate whole Elliott waves of one degree, would merge to match one 2011-2013 wave, would pretty much be impossible in my opinion. So I conclude it must be one 2015 to 2021 wave. Plus, the Elliott numbers for a 2015 to present 2021 work very well, and are identical to the 2011-2013 bull run.

BTC 2013 fractal match revisitedI've published the 2013 fractal match before. It needs some updating, so reposting it.
You can see all the pivot points match with the current bull run.
Notice, that the current 50% + dip matches the 50% + dip that occurred in 2013.
Notice, that I label five Elliott waves starting this bull run as 2015. I'll post another chart about this giving more detail.
What is crazy, is even subwaves were matching. I did not label them, but did color code them with circles.

BTC/USD (Daily EMAs Support)💎Technical Analysis Summary💎
BTC/USD
-Bitcoin may have found support in the previous areas of interest
-The 44k dollar zone is a confluence of these two EMAs
-If the price can hold this level for the next 24hrs-48hrs
-I think we can say BTC is ready to consolidate again
-The next step is potentially to retest the recent top at 48k dollars
-Tough day for the altcoin during Bitcoin's pullback
-BTC daily structure is still safe so I think Altcoins can recover fast
-Good luck everyone on your trades!
⚠️Please always read the description⚠️
Thanks for donating 💰 via Tradingview coins bitcoinpam 🙏🎉
``````````````````````````````````````````````
If you need help🙋 don't hesitate to
Send me a message here PolarHusk 😊
``````````````````````````````````````````````
Trading Involves High Risk ⚠️
Not Financial Advice 💸
Exercise Proper Risk Management 💱
``````````````````````````````````````````````

BTC tops at $78k to $83k this yearI think the chart makes it clear.
Notice that BTC has a history of reacting at inner lines, which I show on the chart.

#BITCOIN's road to $162k by May 2022! Here's Why!Welcome to this Exclusive Analysis on BTC everyone.
If you are reading my analysis for the first time, do follow me to get more complex charts in a very simplified manner
I also post altcoin setups on Spot, Margin, and Futures .
Let’s get straight to the point and zoom out the bitcoin chart and see how bitcoin bitcoin reacted after the last three halvings to understand the potential target for Bitcoin within May 22.
First Halving
The first halving of bitcoin happened on 26th of November 2012. After the Halloween the bitcoin price pumped all the way to $1140 with an increase of 9390.87% from its having low.
We saw an almost 83% retracement after that which was a bear market for almost 420 days.
Second Halving
After the second Halving the bitcoin price made a low of $483 and then it started a parabolic move to almost $20,000 with an increase of 3914.50%.
We saw the same 83% retracement after that and the price of bitcoin went as low as $3148.
Third Halving
The third having happened on 11th of May 2020. Before the Halloween I posted an analysis in which I speculated move from $7000 $132,000 per bitcoin by May 2022
I will leave the chart link below this analysis.
The bitcoin price pumped all the way to $64,840 the real question is whether the bull market is over or are we really Entering a new parabolic move for Bitcoin which will eventually end up with a new all-time high?
IMHO as the chart speaks the bitcoin price bounced right from the 21 weekly moving average showing some strength for a parabolic move.
It is highly likely that bitcoin is going to make a new all-time high if it breaks the $53,000 resistance. The new target for bitcoin would be $162000 by May 2022!
All that Bitcoin needs is to do is to hold the 21 Weekly MA and the 30k level!
Many indicators are showing signs of strength in the market.
However I would also like to point a bearish scenario with you all!
You can see in the last two halvings the bitcoin price bounced
right off the 21MA and went below it after few weeks as shown in the little boxes B1, B2 and B3!
This is why I have always pointed out that 21 weekly moving average is an important bull market indicator.
So basically Bitcoin needs to hold to support levels-and the 21 Weekly MA and number two $30,000 level if it does we are likely to get a new all-time I buy the end of May 2022
The overall Data I’ve shared in the first part of this analysis is still on board!
Just the target has been increased by few percentage!
It’s just 2.5x from 60k to be honest.
So now you know what we need for the Bull Market to continue
Whats your thought win this?
Do you think it’s possible for BTC to make a new ATH or is it just a trap before we enter a Bear Market?
As shown in the Black box in the chart?
Do share your views and ideas in the comment section.
Do not forget to smash that like button.
That little appreciation motivates me to make more high quality contents absolutely free for the community!
Thank you
#PEACE

BTC/USD (Consolidation Before New Move?)💎Technical Analysis Summary💎
BTC/USD
-Bitcoin is respecting these two EMAs for the 3rd time
-That is good because it is acting as a short term support
-But the bad side is this support gets weaker over time
-And a new resistance is confirmed around 48k dollars
-This can be a potential double top if support 45.5k is broken
-Take note BTC has moved up to 64% since July 20
-If BTC can hold above 48k, chances to go higher increases
-But if 45k dollar support failed, expect the next key area at 42k dollars
-For the altcoin side, the BTC Dominance keep declining
-This results in the strong performance of the altcoin overall
-But be careful because once the Dominance level bounces up
-Altcoins will be affected especially if BTC corrects lower
-Good luck everyone and stay safe
⚠️Please always read the description⚠️
Thanks for donating 💰 via Tradingview coins bitcoinpam 🙏🎉
``````````````````````````````````````````````
If you need help🙋 don't hesitate to
Send me a message here PolarHusk 😊
``````````````````````````````````````````````
Trading Involves High Risk ⚠️
Not Financial Advice 💸
Exercise Proper Risk Management 💱
``````````````````````````````````````````````

Dear Bitcoin Prediction for next All Time High (BLX)-If we draw a Fibonacci retracement on the correction moves from ATH to next start of new cycles (this move usually makes about 80%-90% correction at each time happens), we have 161.8% Fibonacci key level that price comes up and react to it named as "Local Top".
-In 2013, price stop correcting at 127.2% Fibonacci level, we had same behavior in last correction from 64K to 30K in 2021.
-This Fibonacci key level (161.8%) has broken by price and we had 250%-300% growth after breaking, named as "All Time High". If we calculate it for now, next "All Time High" could be happen about "200K-250K".
-Based on breaking 161.8% key levels in past cycles, we can expect that 64K be broken cause that was a "Local Top" too.
-One more thing is that 161.8% Fibonacci key level will be our next Buy Zone for next cycle.
Enjoy The Ride :)

I'm not a bear anymore. 🚀No this title isn't clickbait - I think I genuinely figured out what the pitchfork is going on around here.
>I might be late to the pawrty, but from my perspective, I am right on time ;).
That odd move from 6\22~7\4 seriously threw me off, and I bet I wasn't the only one who was caught off guard by that peculiar structure.
It was a leading diagonal 😅!
I spent so many hours trying to figure out what in the world this uncanny formation was, and it wasn't until this evening that I decided to just scrap all my old charts and start with a new perspective. I was looking at the ETH chart, looking for some clues... When it all clicked, and everything just came together effortlessly. That move on ETH from 6\22~7\7 was a leading diagonal (It is a lot more pronounced on the eth chart, and was a lot more difficult to spot on the btc chart unless you were genuinely looking for it).
Lessons were learned on this night.
-----
As for the argument that we saw 5 waves down from 64k - Let's call it a WXYXZ . All of the measurements check out flawlessly, and it's one of the more complex structures in the book. I see btc pulling wxyxz's on the minute time frames all the time. The algos are pre-programmed to mess with us, and I think that's genuinely what this is.
-----
Watch for this last sub-fifth wave to complete at 49.5k (123.60% extension) to put in Wave (1) of our bull run.
From there we see a 0.618% (gz) retracement, to retrace this entire move that started in June down into Wave (2).
The golden zone perfectly aligns with the bottom of our pitchfork perfectly, as well as the midline of the bull channel we've created in March of 2020.
Wave 1 target = 49.5k
Wave 2 target = 34k
Wave 3 target = 84k
Wave 4 target = 60k
Wave 5 target = 108k
here's a visual representation of the bull channel:
---------
also here's the same idea posted on 7\23
Ps. I knew deep down that this rally was real, but I always try to look for alternative scenarios just in case. This is the one and only as of today, and it is my primary going forward. Once that Wave (2) is in, I'm going long \ hodl'ng everything & never looking back.
100k by christmas eve, calling it right now 🎄

BTC/USD (43k New Short Term Support)💎Technical Analysis Summary💎
BTC/USD
-Bitcoin respected the EMAs at the 8H timeframe period
-With the confluence of previous higher low at 43k dollar range
-The price is now retesting the recent top
-This zone has been tested 3x and it is still acting as resistance
-As long as the Bulls can hold above the EMAs and 44k dollars
-I think there is still a big chance for another leg up
-For now, Many altcoins have recovered from their recent downward move
-I am observing the market for potential swing trades
-Good luck everyone and stay safe!
⚠️Please always read the description⚠️
Thanks for donating 💰 via Tradingview coins bitcoinpam 🙏🎉
``````````````````````````````````````````````
If you need help🙋 don't hesitate to
Send me a message here PolarHusk 😊
``````````````````````````````````````````````
Trading Involves High Risk ⚠️
Not Financial Advice 💸
Exercise Proper Risk Management 💱
``````````````````````````````````````````````

Bitcoin Top Target BLX $250KUsing the .618 Fib line we can assume this is where we are within the 4 year period of Bitcoins run
Previous runs have shown rejections at this point, which is evident with the current rejection
I am placing my target at ~250k by the end of the 4 year Period
After this a Bear market may be entered
Don't underestimate BTC..
I do have thoughts however that this run will be propelled by Ethereum and the DeFi / NFT craze that has occurred, and a few assumptions based on chart structures
If it is propelled by Ethereum, this will be a first

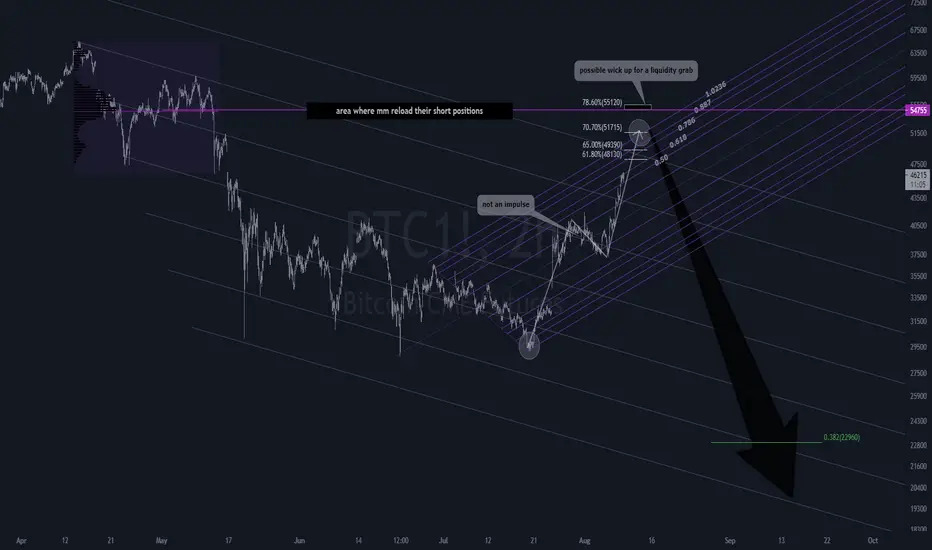
don't shoot the messenger.i'm not convinced that crypto has finished this wave 4 correction, in fact - i am willing to place a large bet against this ponzi when the time comes 😅
take a look at this chart dating back to 2013:
every single correction we've ever had in the history of bitcoin has tested the weekly 200ema before resumption to the upside.
you know what is in perfect confluence with the 200 weekly ema?
the organic wave 4 algo target.
dead cat bounces are fun, but they are short lived - what follows after though, very few ever expect. the majority of the population trade using their emotions & get overly excited due to the large short term gains they experience 😁 (i know the feels, no hard feelings).
--
my downside target is 22k, we could see a wick get as low as 15k for a quick liquidity grab due to the over leveraged long liquidations.
this will put in wave 4 on a higher degree
my upside target from there is 120k (at the bare minimum).
ps. short term bearish, long term very bullish.
ps2. this will be The generational buying opportunity if you know exactly what to buy and when 😉.
best of luck to all 💸
BTC/USD (46K Acting Resistance?)💎Technical Analysis Summary💎
BTC/USD
-Bitcoin in the short term is looking to retest its local support
-Though this area has been tested before so it might likely do it again
-If the Bulls will defend the 43k dollars zone, then we can be safe
-Then expect a potential return up to the 46k dollars again
-From there, we will have to re-access the market if we can see another continuation
-A correction down to the 43k is a -5% decrease
-So please always have a trading plan and follow it
-Good luck and stay safe everyone
⚠️Please always read the description⚠️
Thanks for donating 💰 via Tradingview coins bitcoinpam 🙏🎉
``````````````````````````````````````````````
If you need help🙋 don't hesitate to
Send me a message here PolarHusk 😊
``````````````````````````````````````````````
Trading Involves High Risk ⚠️
Not Financial Advice 💸
Exercise Proper Risk Management 💱
``````````````````````````````````````````````

Possible out come?This chart simply shares an idea. It's not financial advice. Bitcoin looks like it want to make another parabolic move although we are not I repeat NOT out of the woods just yet. Having said that there is more weight towards the bull scenario with confluence on bullish signals.

BTC/USD (46k Target Hit)BTC/USD
Bitcoin hit 46k level base from my previous post
Like what I'm potentially expecting if the recent 42k is broken
I am looking for the next Fib target at the 46k level
From here, I expecting BTC to consolidate a bit
I will update my idea if I see new developments

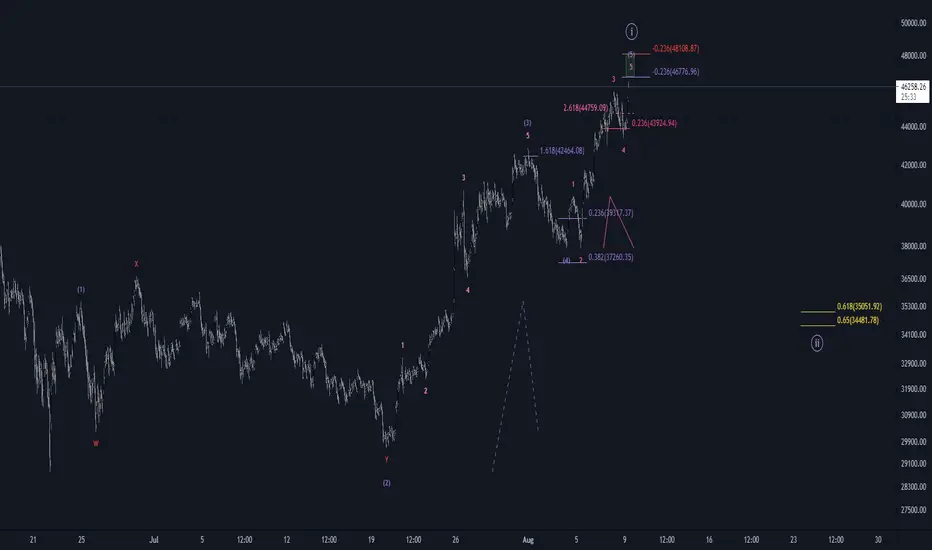
taking another crack at this count.since most of the liquidity goes through binance, this will be the primary chart i will be using going forward. previously i was using the kukoin chart, as that's the exchange i use, but this morning i learned that nothing else matters except this binance chart.
----
this last move on july 31st from 42885.28 ---> 37915.50 caught me off guard, and i bet i wasn't the only one.
the only chart that clearly shows what's going on is this binance chart, every single other exchange made a lower low for that move, which made things very confusing \ invalidated this larger picture.
this is the only scenario that i could possibly think of given the new data this morning.
looking for 47~48k to put in wave (1) on the higher degree, before the 0.618 wave (2) pullback to that 35k area.
this would in theory set us up for a much larger move to the upside.