Is the writing on the wall??? Possible bull trap in the making.Each time Log MACD retraced to the zero line was followed by a new higher low... Long term remains bullish, but we might see further consolidation to previous top at 20Kish... Place your stops accordingly if entering now.
BLX

An honest observation. I wanted to give you all my honest opinion on this move, and how i feel about what is happening right now.
This is an inversed chart on btc, inversed to make this as clear as possible.
From the highs of 64k, we saw 5 waves down - with the last wave seeing a truncation.
5 waves down is not a correction, it is an impulse.
Corrections generally move in 3 waves (5-3-5) 1-2-3-4-5(A) - a-b-c(B) - 1-2-3-4-5(C)
(some corrections are more complex than others, but after a 5 wave move down, we can eliminate every other type of correction except the simple 5-3-5)
(A)'s have 5 waves within them, so do wave (C)'s.
Which leads me to believe despite how things may look and seem these last few weeks, is we are still in a much larger correction.
Wave 4 corrections take the longest time to play out, and are the most psychologically advanced moves in the markets.
We are in a large Wave 4 correction from my perspective, and this will take time to play out. Could take weeks to months to a year to fully complete.
Take full advantage of this move up, hodl the alts which will run hundreds to thousands of percent in the meantime - but just keep this idea in the back of your mind, and remember - that this larger correction has not yet been completed.
-------
These are my four targets for for this second corrective phase (Wave B)
0.618% - 47k
100.0% 54k
123.60% = 59k
161.80% = 68k
Extended wave B moves are not uncommon, and they happen all the time - they push to the absolute extremes, sometimes even make a new all time high before the final drop which is usually the most parabolic move in any market.
One of these targets will reject and btc will drop to the low 20k's before the big Wave (5) begins.
(it is impossible to know which one of these will be The target, but i have a few ideas using some other data points)
-------
Take a look at the 1 year chart on the Fear \ Greed Index for btc; notice how when btc tops out, the greed index starts to consolidate \ move sideways before a massive drop down. This is what I'm looking at daily, and will continue to do so until i see this consolidation take place - once it does it will semi confirm a top, and we could better anticipate the closest target to us.
Also take a look at the 200 Week Moving Average Heatmap , Notice the how btc's heatmap turned blue recently, which triggered this strong move up. Historically - during a correction, whenever it turns blue that is when a dead cat bounce occurs, before the deeper dive to touch the 200 week moving average.
Ps. I will conclude this by saying: this is just my own personal opinion, from my own experience with corrections in the various markets out there. I have seen tens of thousands of them in my journey, and I feel fairly confident when identifying one. I am not bearish, in fact I am extremely bullish on btc in the long term. I think once this correction is completed, our final fifth wave on the highest degree will go anywhere between the hundred thousands all the way into the millions.
Best of luck to everyone, stay safe out there!

btc primary.look for this wave 1 to top out at 45.5k
that's also where the 200 daily simple moving average is, perfectly in confluence with our sub wave 5 target to put in wave (1) on a higher degree.
from there we should in theory see a mean reversion for wave (2) to about 34.7k
the alternative is btc will have a flat correction, similar to last year, where it will move sideways for a month or two, rather than down.
if we do see the mean reversion for wave 2, that is the key entry for long positions on any alts, as well as leveraged longs on btc.
since btc wants to move up, we have to adapt to what the new data is showing us, and as of this moment that data points straight up.
wave 5 could see an extension to 100k+, but i'm being conservative with my analysis here, and giving it a 84k upside target.
better to aim lower, than higher.
best of luck to everyone, let's get it.

BTC/USD (Bullish Recovery)BTC/USD
Bullish double bottom for Bitcoin
Back above 50MA
Retesting recent high
If broken, expect the price to hit 46k

BTC/USD (37k Dollars New Support?)BTC/USD
-Bitcoin found support at near the 20D Moving Average
-We can see a strong move up by the Bulls
-If this daily candle closes in green
-We can say the 37k dollar is our immediate support
-If and only if the recent top is broken upwards
-The chances to go higher increase to test 47k sell area
-For now, everything is looking safe again
-Some Altcoins is looking ready for mini reversals
-Good luck everyone and stay safe!
⚠️Please always read the description⚠️
Thanks for donating 💰 via Tradingview coins bitcoinpam 🙏🎉
``````````````````````````````````````````````
If you need help🙋 don't hesitate to
Send me a message here PolarHusk 😊
``````````````````````````````````````````````
Trading Involves High Risk ⚠️
Not Financial Advice 💸
Exercise Proper Risk Management 💱
``````````````````````````````````````````````

BTC/USD (Found Support at Fib .382)BTC/USD
Bitcoin found local support at Fib 0.382
If this current level will hold
Expect a run-up to a recent high at 42k dollars
Otherwise, a retest of support at 37k dollars
Potential mini consolidation for the next few days

BTC/USD (Fib Support Areas)Bitcoin is rejected at the 41k-42k resistance zone.
We have 3 potential areas where BTC can find support.
This is from 38k down to 34k where the 50D Moving Average is located too.
Let us wait and see.

BTC/USD (Good Monthly Support?)💎Technical Analysis Summary💎
BTC/USD
-Finally, after 3 months of red candles. The month of July finishes strong
-Bitcoin has a monthly immediate key area of support around 35k-29k dollars
-This is the zone we need to watch for the remaining months of this year 2021
-As long as this area will hold, BTC will remain Bullish until the end of the year
-For now, I'm expecting a few months of sideways trading again
-During this consolidation, Let us see if the Altcoins space will move stronger
-Because most of the time, Altcoins performs better when BTC trade-in range
-I will always keep my watchlist updated and hopefully share some of my public ideas
-See you and Good luck! :)
⚠️Please always read the description⚠️
Thanks for donating 💰 via Tradingview coins bitcoinpam 🙏🎉
``````````````````````````````````````````````
If you need help🙋 don't hesitate to
Send me a message here PolarHusk 😊
``````````````````````````````````````````````
Trading Involves High Risk ⚠️
Not Financial Advice 💸
Exercise Proper Risk Management 💱
``````````````````````````````````````````````

The Next UPs And Downs of BTCAs we Told before the last deep correction
BTC can record New ATH After this correction
Correction happened, and now We are expecting ATH & later , a deeper correction - about 80 to 95 %
So Be careful
Hold altcoins till BTC Records its now ATH - then - get ready to sell again
GL HF

BTC/USD (40k Area Acting Resistance?)💎Technical Analysis Summary💎
BTC/USD
-Bitcoin is currently testing the mid resistance area after a 40% increased from the 29k region
-This zone is a confluence of previous tops from January 8, May 26, June 15 trading
-Also, the 100 Moving Average is sitting inside this zone
-Take note, the RSI hit the 70 level or overbought territory
-After 9 trading days with all green candles, it is potential painting a red day
-If BTC tops out or slows down from here, expect a mini consolidation range
-A correction is likely to happen if not yet then BTC might break the 42k zone
-Let us wait and see which way the market will go within 24hrs-48hrs
-Good luck traders and stay safe!
⚠️Please always read the description⚠️
Thanks for donating 💰 via Tradingview coins bitcoinpam 🙏🎉
``````````````````````````````````````````````
If you need help🙋 don't hesitate to
Send me a message here PolarHusk 😊
``````````````````````````````````````````````
Trading Involves High Risk ⚠️
Not Financial Advice 💸
Exercise Proper Risk Management 💱
``````````````````````````````````````````````

BTC/USD (New Strength)💎Technical Analysis Summary💎
BTC/USD
-Bitcoin finally confirms the weekly key support area
-After a strong recovery back above the 50W MA and hitting the 40k level
-We can say BTC is safe for now in the coming weeks
-But the Bulls can't stay relax because the 40k dollar is acting as a strong barrier
-And also, we have a new CME price gap of around 34k-32k dollars
-We know these gaps are likely to get filled soon
-If you noticed some Altcoins are not doing well during BTC run-up
-It is because the Bitcoin Dominance level increases too by 5%
-The Altcoin space may move weak or slow in the coming days
-Unless the BTC Dominance decreases and Bitcoin moves in a range
-Congrats for the Bulls, let us see if they can make another follow-through
⚠️Please always read the description⚠️
Thanks for donating 💰 via Tradingview coins bitcoinpam 🙏🎉
``````````````````````````````````````````````
If you need help🙋 don't hesitate to
Send me a message here PolarHusk 😊
``````````````````````````````````````````````
Trading Involves High Risk ⚠️
Not Financial Advice 💸
Exercise Proper Risk Management 💱
``````````````````````````````````````````````

More Fib Circles BLX BitcoinDemonstrating the Power of the circle
Red areas = price decline as per hitting an area of the circle
Green areas = support area as per hitting an area of the circle
Linked is my guide to using the circle tool
Really do enjoy using this tool to portray support and resistance zones

Bitcoin Analysis and Commentary BLX Optimal entry point directed on chart
This is along a curve that has extended from the previous bull market top
An observation I can't display on chart is that the 200MA is forming a somewhat "W" pattern, meaning the structure of the 200MA is in the form of a W
Made a little spread between the entry point due to possible error while drawing the curve

it isn't time yet.i took a closer look at this recent rally, and i can't help but feel like something is off about it. my intuition is telling me that this is yet again another phase of distribution before the deeper drop to lower lows.
it would explain the unusual volume spikes in this 34k range.
----
my downside projection sits at 25.5k as of this morning, and until the charts tell me otherwise - this will be my primary count going forward.
i could be wrong, but i have to trust my intuition on this one, as it is what got me here in the first place.
we could make one last push to about 36.2k, but the probability of that is very slim as of this moment.
i started layering in shorts as of this morning, and will continue to do so until i am proven wrong.
💸
ps. i talked about this scenario not too long ago, and this false break out of this wedge is the ultimate trap to anyone who doesn't see it coming. i have seen this scenario play out so many times on the smaller timeframes, so i just felt like sharing my opinion on this with you all.

Bitcoin Squaring Up for 35KBitcoin has found support beautifully on my fib levels that I have had plotted for some days now.
I am currently in a large long position from $32000, and I do not plan on taking any profit or closing some of my position until the level just above us is hit around $35k. I am not currently adding to my position but it should be noted that this not a bad time to do so.
Should we continue to hold support here at the .382 fib level, a retest of the next price level at $35000 should ensue. A breaking of the level will have to occur as well to continue the bullish uptrend Bitcoin is trying to form. If it is rejected, expect a retest of our current level again.
The short term moving average are starting to point sharply upward, and typically this has been an indication of a high bullish momentum.
A stop loss or two just below $33579 makes this a low risk high reward trade for those who are experienced.

BTC 4 Year Cycle BLXUsing the Top Cap indicator we can draw the conclusion that it will likely be hit
As it has been hit every cycle previously
1460days = 4 years
An addition to my previous Top cap analysis

BTC/USD (29k Last Area of Support?)💎Technical Analysis Summary💎
BTC/USD
-Bitcoin is saved by the last area of support and 200 Moving Average on 2D TF
-If BTC will continue to move higher in the coming days
-I expect a retest of the 20 Moving Average in this 2D time frame
-This short-term 20MA may act as resistance again as seen in the past
-The Bulls and Bears are differently in a tug of war until the last one surrenders
-The market trading range is getting tighter and tighter each day
-We will soon see breakout direction either up or down
-So please always be prepared and manage your position size correctly
-Good luck and stay safe everyone!
⚠️Please always read the description⚠️
Thanks for donating 💰 via Tradingview coins bitcoinpam 🙏🎉
``````````````````````````````````````````````
If you need help🙋 don't hesitate to
Send me a message here PolarHusk 😊
``````````````````````````````````````````````
Trading Involves High Risk ⚠️
Not Financial Advice 💸
Exercise Proper Risk Management 💱
``````````````````````````````````````````````

btc long setup 7\22.Now that we know where we are, we can safely know where we are going.
Wave 4 corrections tend to be very complex, and very complicated to figure out - which is why i have spend so many days and nights working on this picture; unlike simple corrections which are a piece of cake and take me a few minutes to chart. This was one of the hardest charts I've ever had the pleasure of working on, and it was very much worth the experience.
--------
I am safely theorizing that we have begun working on Wave (B) of Wave 4 on the highest degree.
Wave B's move in three waves (a-b-c) or (w-x-y).
We can eliminate the w-x-y, as this is a clear impulse-
Leaving us with just one final scenario.
The structure we have begun working on, on July 20th is wave a of the larger Wave B structure of Wave Y of Wave 4 on a highest degree.
When this wave (a) finishes its five wave impulse and tops out at 33,600, we should in theory see a 0.5 ~ 0.618 pull back for the smaller downward wave b move.
Knowing this, we can position ourselves nicely for that wave C swing in the days ahead.
I am projecting this wave c of Wave Y of Wave B of Wave 4 on the highest degree to move to about 40.5k as of this evening.
That is my safe target, and is as high as I am willing to swing a long.
Taking it any higher is playing with fire in my professional and honest opinion.
Buy zone:
0.5 = 31378
0.618 = 30,875
---
Sell zone = 40k.
see the full idea via:

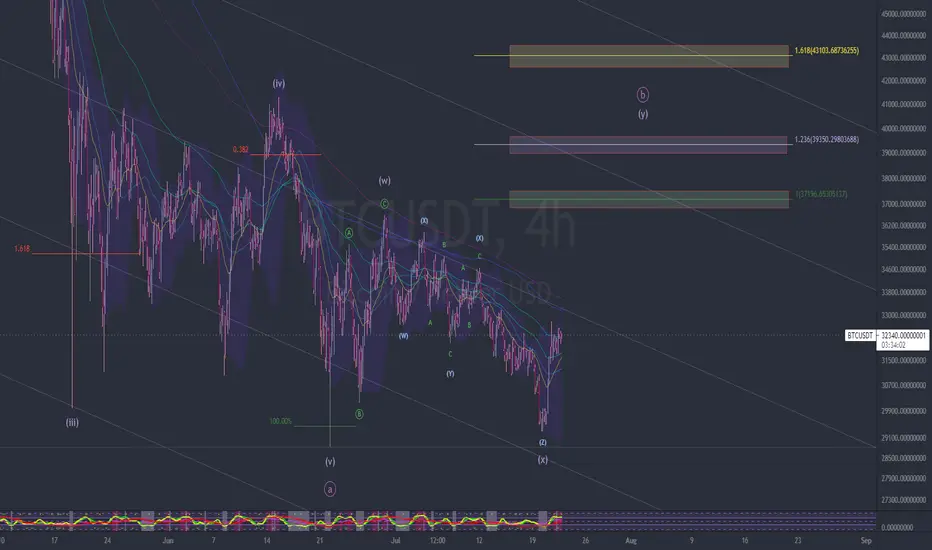
"it's just a double three" 👆Been thinking long and hard about this picture, and i think this is the one.
i've been observing the price action these last two nights on the smaller time frames, and noticed that from our july 20th "bottom", there was a shift in momentum, a break of pattern - and a totally new vibe that's entered into this market space. hard for me to explain what i mean, but i'm sure you could see\feel it too. we haven't seen an impulse this clean in quite a long time, which leads me to believe that we are finally in Wave Y of this Wave B correction.
all of the fib relations check out for this flat idea, and i have a few potential targets for you guys.
• Wave Y = 61.8%, 100%, or 123.6% of wave W
• Wave Y can not pass 161.8% of wave W otherwise it will become considered a Wave 3 impulse.
Therefore,
•100% = 37.1k
•123.60% = 39.3k
•161.80% = 43.1k
If btc breaks above 43.1k on this run, then our Wave 4 correction is behind us, and we can expect to see new highs.
-------------
Ps. I've never traded a flat correction before, in fact this is the first time I am seeing one this large with my own eyes. All of these relations are textbook accurate, so I'm going to simply treat these coming days as a learning experience, so I'll know what to expect if we ever come across this sort of structure again.
I appreciate all of your support, and I hope you guys trade safe in these crazy markets.
\\
i entertained this flat idea the other night, but the liquidity hunt the other day really threw me off.
which would put our wave C target ranging between 14~20k depending on where this wave b move tops out.

a deep dive into the projected downside target.i made a post on february 4th calling the top of btc at 60k - i was off by 5k \\ you can view that post down below.
also made a post back in march, warning everyone about the massive signs of weakness i was seeing.
my projected downside target back then was between 10k~15k, but i've come a long way in this learning journey, so i'm here to say that we will not be seeing 10k.
we could though, get all the way down to 14k as that would be the 123.60% fib extension (aka wave 5 target of wave c) - which would keep our 11 year grand cycle count still in tact.
the bullish invalidation for the 11 year move would be at 13831.41 (via the bitcoin liquid index chart) each exchange varies in price, but i think the blx is the universal chart which matters the most - so let's go with that number.
you don't want to know what would happen to btc if 13831.41 was breached - matter of fact, let's not even talk about it.
-
if you press alt + i on your tv chart, you are able to inverse it. i find it much easier to chart downtrends from this perspective - so that is precisely what i did here.
as you can see: wave 3 of wave (a) hit the 1.618% fib extension, wave 4 hit the 0.386% fib retracement, and wave 5 is projected to hit anywhere between 14~18k via the 100%~123.60% fib extension.
this is probably not something any of you want to hear right now, but it is not like i am making this number up, it is simply what the chart tells me as of this evening.
Wave A target = 25k
Wave B target = 43k
Wave C target = 14k.
-

liquidity hunting.the og whales want their 100x longs filled at the downside w5 algo target.
tonight is the night.
buy the green box
sell the red box.
✌

Bitcoin 277k top? The factor of 10. Bitcoin long term perspective using line chart and focusing on the scale factor 10.
The factor of 10 starting at 1k.
1k -> 10k -> 100k -> 1M
2013 top $1177 (-88.23% of next 10 factor - 10,000)
2017 top $19764 (-80.24% next 10 factor - 100,000)
Difference between above
-8% approx. Then project that against next 10
factor 1million.
My projection is june 2023 top so
2023 top $277k (-72.22% of next 10 factor - 1million). That is approximately 5.4 Trillion market cap for bitcoin.
Black top resistance line connects 1k to 10k once these prices were reached on the monthly timeframe respectively. Blue top resistance connects 10k to 64k top which leads to a 100K price around february 2022. I expect we reach 130k and retrace as projected in pink arrow. Then continue for another swing higher to form a rising wedge (see my related post for clear illustration)
Next bear market low I have projected as $50,684 around june 2024 approximately 1 year after the 277k ATH projection, an approx -81.70% retrace and around the date of the next bitcoin halving.
This is simply an observation and projection from the observation, it does not imply certainty. Time is important in terms of how long was spent at 1k and 10k which we can forecast for the subsequent 100k (should it happen) that I may discuss at a later stage. Always adapt strategy according to what market tells you. For now let’s see how it plays out as this is a 2-3year projection, anything can happen.
Good luck.
