Bitcoin BTC BTCUSD BTCUSDT Daily Review UpdateThe market is simply reacting to the fact that a cross between the EMA50 and EMA300 is happening on the daily chart of Bitcoin, indicating the famous golden cross. But studying the past we can believe that Bitcoin is creating the same movement made in February of this year when this whole pandemic started. Really in this zone between $ 8545 and $ 10k we are not confident in opening positions. For us it does not represent a safe trade zone.
The next movement to which we must pay attention are the crosses between the EMA50 and the MA300 in the coming days. Indicators do not show convergence between themselves, which makes us feel insecure.
This is where many traders are wrong: they believe that robots are playing the game in their favor. So, be very careful during these days
Blxusd

BTC/USD (Potential Push Up?)BTC/USD
-the market structure on the daily remains bullish
-holding above the 20MA and 200MA as support
-upward trendline support still intact
-we have not made a lower high and clear lower low yet
-there is a chance we could see a bounce up
-to the fill the CME gap up to 10k
-if we get the 10k gap but failed to break above
-and drop below trendline support
-daily structure will turn into a bearish market
-yesterday candle closes green
-the technical view is bullish to slight bearish

BTC/USD (Holding Critical Trendline Support)BTC/USD
-the price top out at 10k
-bounces off the trendline support
-holding on the lower support area
-watch out for the CME gap up to 10k
-beware for short entries
-if you are looking for a short position
-wait for the break of ascending trendline
-technically, the priority remains to the upside
-as the structure still valid

BTC/USD (New Higher High)BTC/USD
-new higher high is set at 10k
-new immediate support at 9.5ks
-cross ultimate indicator signal is long
-the priority remains to the upside
-the potential target is 10.5ks
-key stoploss is below 9.3ks

BTC/USD (Uptrend Continues, New Higher High)BTC/USD
-broke above current resistance at 9.2ks
-new higher high is set at 9.6ks
-the priority remains to the upside
-indicator still pointing to 10k target
-few days left before the halving
-no major red flags today

BTC/USD (Local Resistance Breakout)BTC/USD
-broke local resistance at 9.2ks
-breakout is confirmed with volume
-new immediate support is set at 9.2k-9.1k
-if the current price level will hold
-and break the swing high at 9.5k
-we could expect the price to surge up to 10k

BTC/USD (1 Last Chance for the Bulls?)BTC/USD
-false breakout yesterday
-but still manages to hold current support levels
-must not break local support at 8.8ks
-KS CROSS Ultimate Indicator still acting as support
-no major red flag on the indicator yet
-last Long signal was triggered on the 23rd of April
-technically, the priority remains to the upside

BTC/USD (Potential Bearish Pattern?)BTC/USD
-potential bearish pattern
-must break above 9k to invalidate the pattern
-if failed to break resist line
-expect to return back to previous support

BTC/USD (Slight Bearish Scenario)BTC/USD
-failed to break resistance at 9.2ks
-bounced at previous support area at 8.7ks
-if BTC can't get above the resistance zone
-expect another downward pressure will happen

BTC/USD (Bullish Weekly Pattern?)BTC/USD
-weekly candle must close bullish
-must hold immediate support at 8ks
-must keep trading above 20ma
-if failed to break downward resist line
-must consolidate and challenge to break higher
-next upside target is key resist area at 10.5ks
-no major red flag on the weekly
-we might expect minor consolidation for few days
-priority is to the upside

BTC/USD (Gap Filled, Next Stop is 10k?)BTC/USD
-broke key resistance at 9.2ks
-the gap is now filled at 9k region
-extremely overbought meaning the strength is superb
-next target is now at 10k
-is it ideal to short Bitcoin?
-answer is NO
-you don't want to stand still in front of a speeding train

BTC/USD (Bullish Breakout: mid 8ks target?)BTC/USD
-A Bullish breakout of local resistance
-New Higher High is made on 4h chart
-Upside target is up to 8.2ks-8.4ks
-Key stops should be below 20ma
-Market sentiment is going up

BTC/USD (No Major Red Flag Today)BTC/USD
-No major red flag today
-Old resistance turned into new support
-Bullish wicks rejecting price at new support
-The priority remains to the upside
-As long as the immediate support will hold
-Upside initial target is up to 8.2ks

BTC/USD (Failed Breakout?)BTC/USD
-Bitcoin is back inside the sideways channel
-Failed to break key resistance at 7725s
-Must hold immediate support at 7550s
-If the current price level will hold
-BTC may retest the High at 7700s
-Bearish side, if 7500s fail
-Our next support is at 7380s
-Market sentiment is Bullish to slight Bearish

BTC/USD (Old Resistance, Turning New Support?)BTC/USD
-old resistance is turning into the new support zone
-two bullish retest candle
-20ma approaching as dynamic support
-no major red flag today
-if local resistance at 7618s is broken, we go up
-the priority remains to the upside

BTC/USD (Bullish Breakout: 8100s next target?)BTC/USD
-Broke key trendline resistance
-Bullish closed above 7400s
-New immediate support is set around 7300s
-Priority is now to the upside
-Next key sell target is at 8100s
-We need to see further follow-through
-To confirm stronger present from the Bulls

BTC/USD (Last Bounce for the Bulls? Break or Not?)BTC/USD
-Bitcoin bounced a little at 50ma and 100ma
-immediate support area just above 7k regions
-Bitcoin showing little strength
-decision time for BTC, break trendline resistance
-or go down to lower lows?

BTC/USD (Bulls Holding Critical Support)BTC/USD
-Bitcoin is holding above 50MA for the 2nd day
-Must close daily candle above 50MA & 20MA
-Ascending trendline support keeps the bulls alive
-If BTC can hold current price levels for the next few days
-There is a chance we could see a minor rally to test 7.2k
-Bearish scenario if the price closes below trendline support
-A drop down to 5.8k is likely to happen

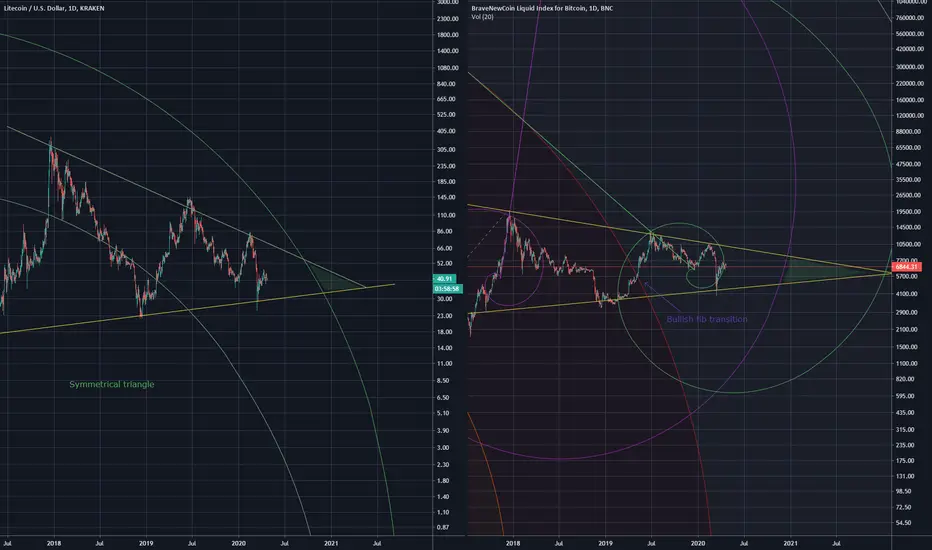
Two symmetrical trianglesA symmetrical triangle is a very bullish and extremely reliable bullish pattern
This is a good sign seeing this on the BLX chart
Litecoin has a golden cross on the weekly chart, don't sleep on LTC! The good entry point is now!
BTC/USD (Last Chance For the Bulls?)BTC/USD
-Bitcoin failed to hold 7k dollars
-a retest of 200MA on the 4H chart
-floating above the ascending trendline of support
-RSI level is below 50 which is a bearish zone
-Last for the bulls is to keep the current price level at 6.8k
-if trendline support and 200MA break
-we could see BTC drop to 6.2k-5.8k

BTC/USD (Potential Bullish Breakout?: target 200D MA?)BTC/USD
-bullish ascending pattern
-bullish momentum cross of 50MA & 20MA
-bullish candle last April 16
-Awaiting break of flat resistance at 7.4k
-Upside target is the 200MA or 8.2k
-Candle close below 50MA will signal bearish sign

BTC/USD (Bullish breakout: 8k target?)BTC/USD
-local trendline breakout
-bullish cross fo 50 & 100MA
-RSI holding above 50 level
-upside target is up to 8100 dollars
-stoploss below 100MA
-market sentiment is slightly bullish

BTC/USD (Bullish descending channel?)BTC/USD
-Bitcoin failed to break downward trendline resistance
-but manages to trade inside this bullish descending channel
-200MA is acting as dynamic support on a 4H chart
-technically, Bitcoin is on a 4H downtrend
-key immediate support must hold is the 6400 area
-if current price failed, next key support is at 6200 zone
-trading inside this channel is shorting the top and longing the bottom
-using tight stoploss on every trade
-as long as the price remains inside this channel, trading is choppy
