LONG - BLZ - Trading Opportunity#BLZ/BTC #Binance - Really liking this double bottom, and with BTC giving us a break I think we could make some nice profits.
Entry: 0.00000694
TP 1: 0.00000737
TP 2: 0.00000786
TP 3: 0.00000837
SL: 0.00000651
CryptoCue is not providing investment advice and is not taking subscribers’ personal circumstances into consideration when discussing investments. Investment involves a high degree of risk and should be considered only by persons who can afford to sustain a loss of their entire position.
CryptoCue is not registered, licensed or authorized to provide investment advice and is simply providing an opinion, which is given without any liability or reliance 1.71% whatsoever. The information contained here is not an offer or solicitation or recommendation or advice to buy, hold, or sell any security. CryptoCue makes no representation as to the completeness, accuracy or timeliness of the material provided and all information and opinions provided by CryptoCue are subject to change without notice and provided on a non-reliance basis and without acceptance of any liability or responsibility whatsoever or howsoever arising. You hereby irrevocably and unconditionally waive, release and discharge: (a) any and all accrued rights and/or benefits you may have against CryptoCue in respect of any opinion expressed or information conveyed by CryptoCue at any time; (b) any and all Claims you may have against CryptoCue arising out of any opinion expressed or information conveyed by CryptoCue at any time; (c) CryptoCue from all and any claims (whether actual or contingent and whether as an employee, office holder or in any other capacity whatsoever) including, without limitation, Claims you may have against CryptoCue arising out of any opinion expressed or information conveyed by CryptoCue at any time. ("Claims" shall include any action, proceeding, claim, demand, judgment or judgment sum of whatsoever nature or howsoever arising.) You hereby agree to indemnify and hold harmless CryptoCue in respect of any and all Losses paid, discharged, sustained or incurred by CryptoCue in the event of bringing any Claim against CryptoCue. (“Losses” shall include any and all liabilities, costs, expenses, damages, fines, impositions or losses (including but not limited to any direct, indirect or consequential losses, loss of profit, loss of earnings , loss of reputation and all interest, penalties and legal costs (calculated on a full indemnity basis) and all other reasonable professional costs and expenses and any associated value added tax) of whatsoever nature and/or judgement sums (including interest thereon).)
CryptoCue is not a broker-dealer or financial adviser and is not affiliated with an investment advisory firm and does not engage in activities that would require such registration or authorization by any governmental or regulatory or supervisory authority or body.
CryptoCue and/or any persons affiliated with CryptoCue are not responsible for any gains or losses that result from the opinions expressed herein.
Investors should consult their registered authorized professional financial advisor before investing. Opinions discussed herein have not been reviewed by the securities and exchange commission or any state or other.
BLZ

BLZBTCBLZ looks like it finding the Bottom
-WAIT FOR STRONG PRICE ACTION INDICATING A REVERSAL
-EXECUTE WITH CONFIRMATION

Bluzelle signal by EXCAVOBLZBTC moving in bullish triangle.
RSI- bulish
Potential break out resistance line
target 161.8% level fibonacci

$BLZ, Potential ascending triangle... lacking volume?$BLZ Seeing some tweets around this asset
Currently on a potential ascending triangle w/ top at resistance around ~890 sats
UCTS Buy signal on the 1D
Volume not that good
Only interested if resistance breaks w/ volume
Falling to hodl trendline is an Out
Targets on chart
#BLZ

BLZ/BTC form Ascending Triangle: Bullish 77%, Bearish 23%.BLZ/BTC - 1D
Reasons:
1/ Forming ascending triangle
2/ 10DMA cross up 20DMA
Target:
- Target 1: 1029 sats (27% profit) @ previous resistant
- Target 2: 1148 sats (42% profit) base on height of triangle and 200DMA resistant.


Bluzelle/Bitcoin (23 May) #BLZ $BLZ #BTC $BTC#BUY
BLZ broke the Bullish Flag pattern and was ready to increase to 920 to complete the Cup&Handle formation and continue to go up
Current Price : 830
Buyzone : Buy close to 800 as possible
Sellzone : 920-1200-1495
Stoploss if price is lower than 750


BLZ / BTC just made a tweezer buttom. Going bullish now?BLZ broke the support, MA200 and MA100.
But we have a tweezer bottom , and we might be bullish in the end.
It bounced right on the bollinger bands , creating a potential new support.

BLZ looks greatBLZ already tapped that lower support, what is more clear on a 4H time frame.
So would look for an entry on the higher support line.

$BLZ Trying to do a S/R flip at ~1650sats zone.... $BLZ Trying to do a S/R flip at ~1650sats zone....
UCTS Buy signal active on the 1D
Volume increasing
RSI at good levels and showing Bullish divergences with MACD
If it hodls & confirms the new support, a movement to 2400sats zone is possible.
Stay alert!
#BLZ
Shorting BLZ hereOne of my fav coins. I've been real hesitant to short this coin because I like it so much, but I need to work on setting stops to buy back when my coins push through resistance.
Here we have some good solid resistance, and the RSI is just poking towards the top, so a good time to short IMO. Setting my stop to buy back just above 1650.


BLZ/BTC - Uptrend, Stoch RSI signal.Buy zone:
1570 - 1610
Sell targets:
1673 +3.91%
1787 +10.99%
1887 +17.20%
Stop Loss: 1528 -5.37%
Notes: Uptrend, Stoch RSI signal.

$BLZ Inverted Complex Head and ShoulderHi friends! Welcome to Poop's long term forecast for $BLZ
Recent developments on $BLZ hints a larger inverted complex head and shoulders will likely form on $BLX as a result of a rally from the current inverted head and shoulders pattern that has successfully crossed its neckline. This supports our prior analysis that $BLZ was forming another broadening wedge bottom similar to what we saw on $LTC which triggered 2019 Altseason.
Our bullish bias is supported by a confluence with volume and a strong double bullish diversion signal which appeared in 1D Chart that spans for over 3 months.
The entire bullish projection could see a 300% rally which could be overly optimistic for some of you but you all know what crypto is capable during #altseason.
This is just a guide, not a trading advise.
Hit like and follow for more chart updates!
Thanks
-Poop Trader


BLZBTCAs you can see in the chart the price has broaken the orange pitchfork and pullback to it. Also just now you can see the price touched MA200. We expect the price reach up line of blue pitchfork and after that will pullback to MA200 and after this confirmation you can enter the position.. If you are risky person you can enter the trade now and set your SL upper than our SL showed in the chart.


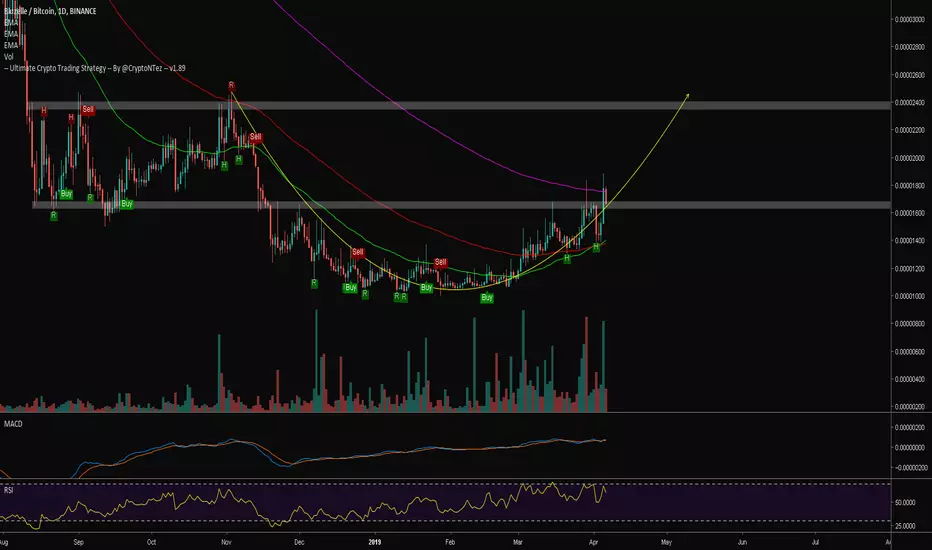
#BLZ - 76% PROFIT POTENTIALBlz managed to bounce from its support with some good volume but, we still have a resistance 200 DMA above it. We will take it as our first target .
TARGET 1 : 0.00001500
TARGET 1 : 0.00002300
STOP LOSS : 0.00001220
i'll really appreciate if you would leave a like.
Dont forget to follow to get notified for further trade opportunities.


BLZ moves past 100 Day MA... Will it continue it's upward move?BLZ/BTC must surpass a strong resistance at 1260 in order to continue it's bullish movement. I hope to see this in the next 12 hours...
Another scenario would be a daily close above the 100 day MA
A daily close below the 100 day MA would indicate a movement to re-test the next support

Bluzelle is ready for flying higheras we see, the chart says that BLZ is in a perfect place before it is journey to the moon.
and since it is one of the good Coin's investment choice, I assume it is the best place to buy some at this point.
Good luck everyone
:)
