BMT/USDT Rebounding from Strong Demand Zone Is a Major Breakout?🧠 Complete and Insightful Technical Analysis:
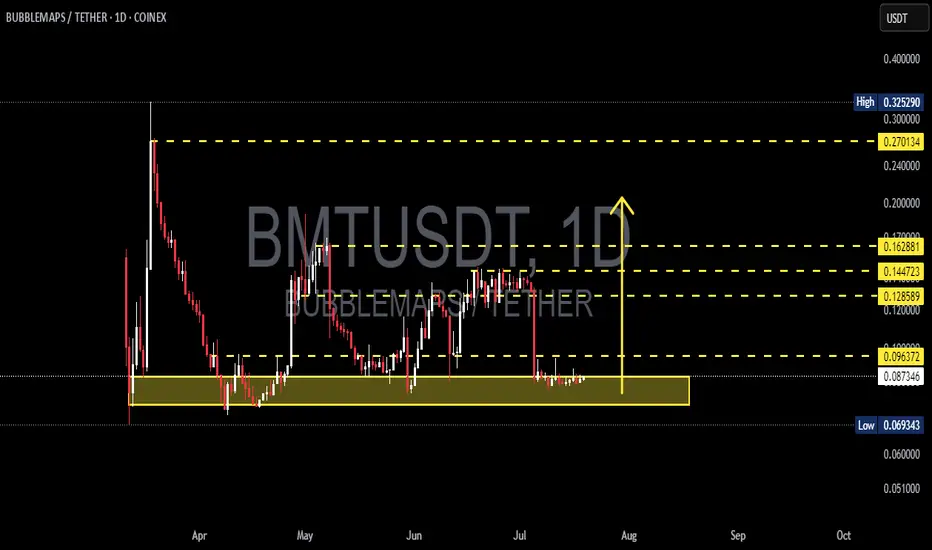
The daily chart of BMT/USDT reveals a compelling structure for traders looking to capitalize on early-stage reversals and bottom entries. The price is currently consolidating within a strong historical demand zone, ranging between $0.069 – $0.087 USDT — a level that has previously triggered multiple significant rallies (March, May, July 2025).
This isn’t just any support zone; it's a classic accumulation area, where bearish momentum appears to be fading and buyers are gradually stepping in.
🔍 Identified Chart Patterns:
✅ Accumulation Range – Sideways movement within the highlighted yellow box suggests a potential base formation.
✅ Double Bottom (W Formation) Potential – A break above resistance would confirm this bullish pattern.
✅ Wyckoff Spring Setup – If a fake breakdown below support occurs followed by a swift recovery, it could signal a powerful trend reversal.
🚀 Bullish Scenario (Reversal in Play):
If the price continues to hold above the $0.069 support, it sets the stage for a strong bullish reversal. A confirmed breakout above $0.096 with high volume would validate the bullish thesis.
📈 Upside Targets:
TP1: $0.096 USDT – Local resistance
TP2: $0.128 USDT – Previous key equilibrium zone
TP3: $0.144 - $0.162 USDT – Historical resistance
TP4: $0.270 - $0.290 USDT – Major range top
This structure provides the potential for a +200% upside move if momentum builds and resistance levels are broken sequentially.
⚠️ Bearish Scenario (Breakdown Risk):
If the price fails to hold above the demand zone and closes below $0.069, the bearish outlook takes precedence:
The next support sits at $0.063
A breakdown below this may lead to price discovery lower with strong downside pressure
👉 Caution is advised: use tight risk management if trading within this range.
🔑 Key Takeaways:
The yellow box is a critical battleground between bulls and bears.
Holding this demand zone could ignite a strong breakout.
The risk/reward setup is favorable for swing and trend traders.
A confirmed breakout could signal the start of a new bullish phase.
📊 Additional Chart Stats:
Current Price: ~$0.075 USDT
Support Zone: $0.069 - $0.087
Key Resistance Levels: $0.096 / $0.128 / $0.144 / $0.162 / $0.270
Market Structure: Sideways → Accumulation → Breakout Potential
#BMTUSDT #CryptoTrading #BreakoutSetup #WyckoffMethod #AltcoinAnalysis #SupportAndResistance #SwingTradeOpportunity #CryptoReversal
BMT
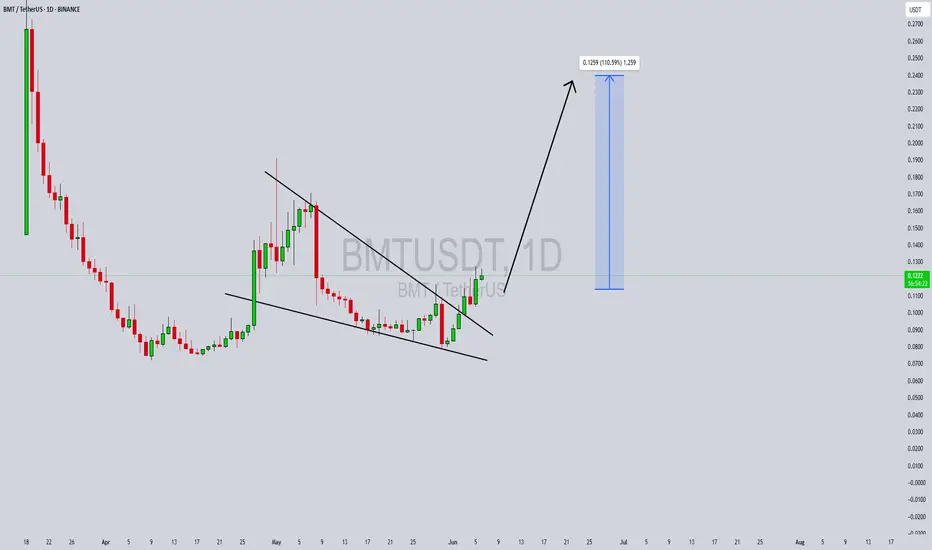
BMTUSDT Forming a Bearish TriangleBMTUSDT is currently forming a bearish triangle pattern on the chart, which typically signals potential downward continuation. However, what makes this setup intriguing is the price's strong resilience around a key support level and signs of accumulation within the pattern. The volume remains steady, which could indicate growing investor interest despite the bearish appearance. This could set the stage for an unexpected breakout in the opposite direction, potentially flipping the market sentiment and leading to a sharp rally.
While the triangle suggests caution, seasoned traders understand that breakouts from such patterns—especially in altcoins—can lead to explosive moves when combined with strong volume and market interest. BMTUSDT is now in a critical zone, and if buyers step in with conviction, we could see a reversal and surge of 90% to 100% or more, targeting higher resistance zones. These setups often surprise the market, especially when retail sentiment is overly bearish.
This crypto project is also gaining attention due to its increasing presence across social platforms and crypto communities. As altcoin season gradually gains momentum, coins like BMTUSDT with technical breakout potential and active trading volumes become prime candidates for short-term gains. Watching for a clean breakout above the triangle resistance could provide the perfect entry for momentum traders.
In conclusion, BMTUSDT is worth monitoring closely. It offers a unique scenario where technical bearishness could be overturned by investor accumulation and a possible trend reversal. A confirmed breakout with volume could trigger a powerful upside move that catches many off guard.
✅ Show your support by hitting the like button and
✅ Leaving a comment below! (What is You opinion about this Coin)
Your feedback and engagement keep me inspired to share more insightful market analysis with you!
BMT Rebuy Setup (4H)After the heavy drop in BMT, the price is now approaching demand zones.
If it reaches the green zone, we can consider entering a buy position there.
Risk and capital management should not be forgotten.
Targets are marked on the chart. A daily candle closing below the invalidation level will invalidate this analysis.
For risk management, please don't forget stop loss and capital management
When we reach the first target, save some profit and then change the stop to entry
Comment if you have any questions
Thank You

BMT is a rockt ! (2H)It seems that a double bottom is forming, the previous bottom has been preserved, and an order block has formed, which has been broken to the upside. Additionally, a key level passes through this area.
On the chart, we also have a bullish CH (Change of Character). If the trigger line is broken, it will provide further confirmation for a bullish move.
As long as the demand zone holds, the price can move toward the targets.
However, the closure of a 4-hour candle below the invalidation level would invalidate this analysis.
Do not enter the position without capital management and stop setting
Comment if you have any questions
thank you

BMT rebuy setup (4H)Given the momentum drop, lack of reaction to hourly support zones, and candlestick formation, it is recommended that if you're looking for a rebuy on BMT, you should wait for a setup in the demand zone at the lower part of the chart.
It seems we have a large triangle, with wave D likely to end in the green zone.
After buying, once you're 20% in profit, start scaling out gradually and break even.
A daily candle closing below the invalidation level will invalidate our buy outlook.
For risk management, please don't forget stop loss and capital management
Comment if you have any questions
Thank You


voxel longBlack Mountain Analytical Team:
Hello
Due to the lack of money, our analysis may not be correct. But I did not want to miss it.
But I have presented two scenarios in the chart.
This currency is also in the range of its static support.
As we can see in the RSI indicator the upward trend line.
just that
