BMT/USDT Rebounding from Strong Demand Zone Is a Major Breakout?🧠 Complete and Insightful Technical Analysis:
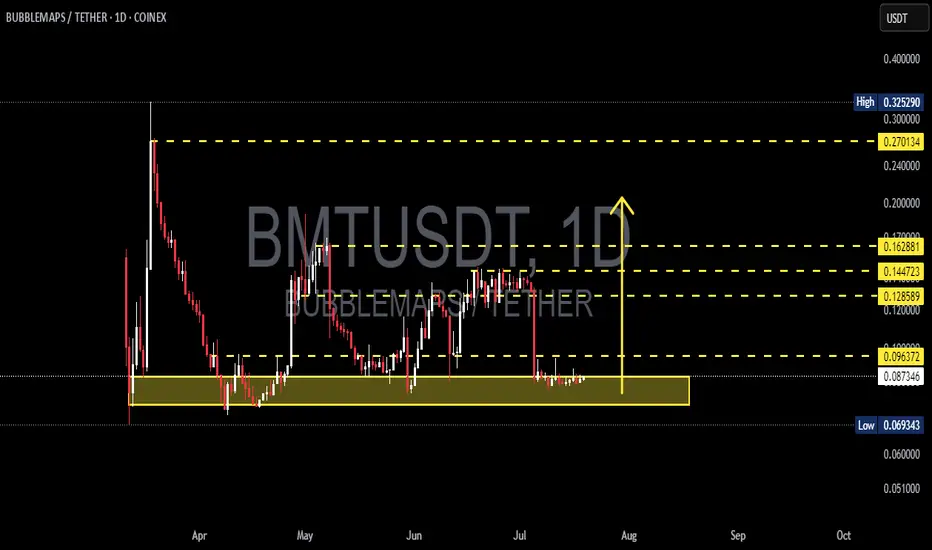
The daily chart of BMT/USDT reveals a compelling structure for traders looking to capitalize on early-stage reversals and bottom entries. The price is currently consolidating within a strong historical demand zone, ranging between $0.069 – $0.087 USDT — a level that has previously triggered multiple significant rallies (March, May, July 2025).
This isn’t just any support zone; it's a classic accumulation area, where bearish momentum appears to be fading and buyers are gradually stepping in.
🔍 Identified Chart Patterns:
✅ Accumulation Range – Sideways movement within the highlighted yellow box suggests a potential base formation.
✅ Double Bottom (W Formation) Potential – A break above resistance would confirm this bullish pattern.
✅ Wyckoff Spring Setup – If a fake breakdown below support occurs followed by a swift recovery, it could signal a powerful trend reversal.
🚀 Bullish Scenario (Reversal in Play):
If the price continues to hold above the $0.069 support, it sets the stage for a strong bullish reversal. A confirmed breakout above $0.096 with high volume would validate the bullish thesis.
📈 Upside Targets:
TP1: $0.096 USDT – Local resistance
TP2: $0.128 USDT – Previous key equilibrium zone
TP3: $0.144 - $0.162 USDT – Historical resistance
TP4: $0.270 - $0.290 USDT – Major range top
This structure provides the potential for a +200% upside move if momentum builds and resistance levels are broken sequentially.
⚠️ Bearish Scenario (Breakdown Risk):
If the price fails to hold above the demand zone and closes below $0.069, the bearish outlook takes precedence:
The next support sits at $0.063
A breakdown below this may lead to price discovery lower with strong downside pressure
👉 Caution is advised: use tight risk management if trading within this range.
🔑 Key Takeaways:
The yellow box is a critical battleground between bulls and bears.
Holding this demand zone could ignite a strong breakout.
The risk/reward setup is favorable for swing and trend traders.
A confirmed breakout could signal the start of a new bullish phase.
📊 Additional Chart Stats:
Current Price: ~$0.075 USDT
Support Zone: $0.069 - $0.087
Key Resistance Levels: $0.096 / $0.128 / $0.144 / $0.162 / $0.270
Market Structure: Sideways → Accumulation → Breakout Potential
#BMTUSDT #CryptoTrading #BreakoutSetup #WyckoffMethod #AltcoinAnalysis #SupportAndResistance #SwingTradeOpportunity #CryptoReversal