GBPJPY BULLISH OR BEARIS DETAILED ANALYSISGBPJPY has successfully broken out of a long-term falling wedge on the weekly chart, and the bullish momentum is unfolding as expected. Price has rallied from 190.00 to the current 197.00 level, delivering solid profits from the breakout zone. This continuation setup is extremely strong, with the market respecting the wedge breakout structure and forming higher highs. As long as we hold above the 190.00 support, the bullish bias remains fully intact, with 205.00 as the next key upside target.
Fundamentally, the British pound remains well-supported due to the Bank of England’s hawkish stance. Despite softer inflation data, the BoE has signaled a cautious approach to rate cuts compared to other central banks, maintaining underlying GBP strength. On the other side, the Japanese yen continues to weaken as the Bank of Japan sticks with its ultra-loose monetary policy. Yen weakness is further fueled by rising US and UK bond yields, widening the yield differential and attracting carry trades into GBPJPY.
Technically, the breakout is unfolding with textbook precision. Price has cleared descending resistance, retested it, and is now building a new leg higher. The volume profile is supporting this bullish breakout, and market structure is confirming further upside. The 200.00 psychological level may act as a minor resistance, but once cleared, 205.00 is well within range and aligns with major Fibonacci extensions.
GBPJPY is also benefiting from increased volatility in risk-on sentiment, as equity markets remain firm and bond yields rise globally. Traders are favoring high-yielding currencies like GBP while shorting low-yielders like JPY. With the fundamentals and technicals now strongly aligned, this trade is well-positioned to deliver continued profits toward 205.00 and beyond.
BNB-BTC

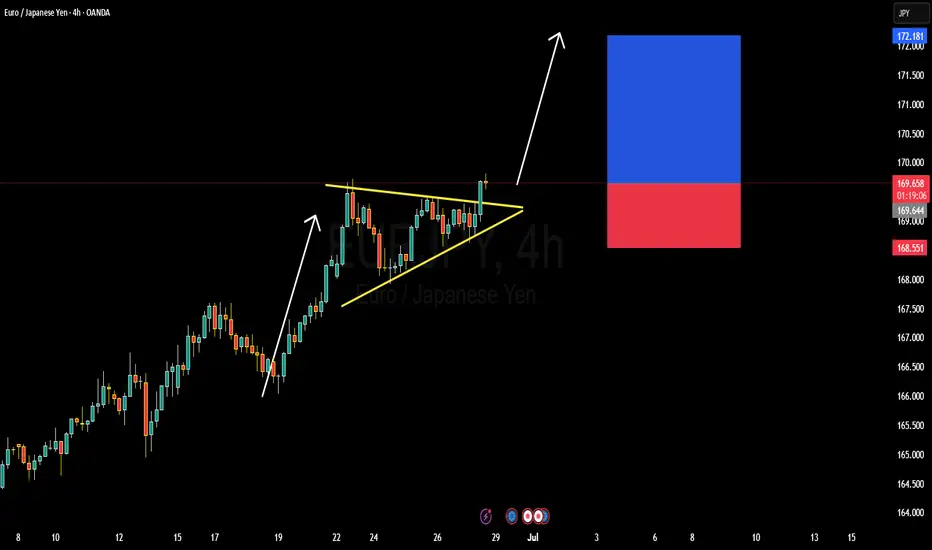
EURJPY BULLISH OR BEARISH DETAILED ANALYSISEURJPY has just broken out of a well-defined bullish pennant pattern on the 4H timeframe, confirming strong continuation potential to the upside. The price is currently hovering around 169.60 after consolidating in a tight structure, respecting both dynamic trendline support and horizontal resistance. This breakout signals renewed bullish momentum, and I'm now targeting the 172.10 zone as the next significant resistance level. The structure is clean, volume supported the breakout, and price action is aligned with the dominant uptrend.
Despite a relatively quiet start to the week—largely influenced by global risk-off sentiment surrounding Middle East tensions—EURJPY has held firm. Now that geopolitical jitters are easing slightly, yen weakness is resurfacing. The Bank of Japan remains firmly dovish, maintaining ultra-loose policy, while the Euro is supported by hawkish commentary from the ECB as inflation in the eurozone remains sticky. This divergence continues to fuel the long-term bullish bias for EURJPY.
Fundamentally, Japanese economic indicators remain soft, and there's still no clarity on when the BoJ will meaningfully shift policy. Meanwhile, EUR zone confidence indicators have stabilized, and speculation is growing around the ECB holding rates higher for longer into Q3. With widening yield differentials and a favorable risk sentiment return, this pair is positioned well for upside movement. Current momentum supports the probability of reaching the 172.00–172.10 area as risk appetite rebuilds across markets.
Technically and fundamentally aligned, EURJPY offers one of the strongest bullish continuation opportunities on the board right now. I will continue to monitor for minor dips as potential add-on areas, aiming for a full extension of the measured move from the pennant formation. Patience pays in setups like this where structure, sentiment, and macro all align.
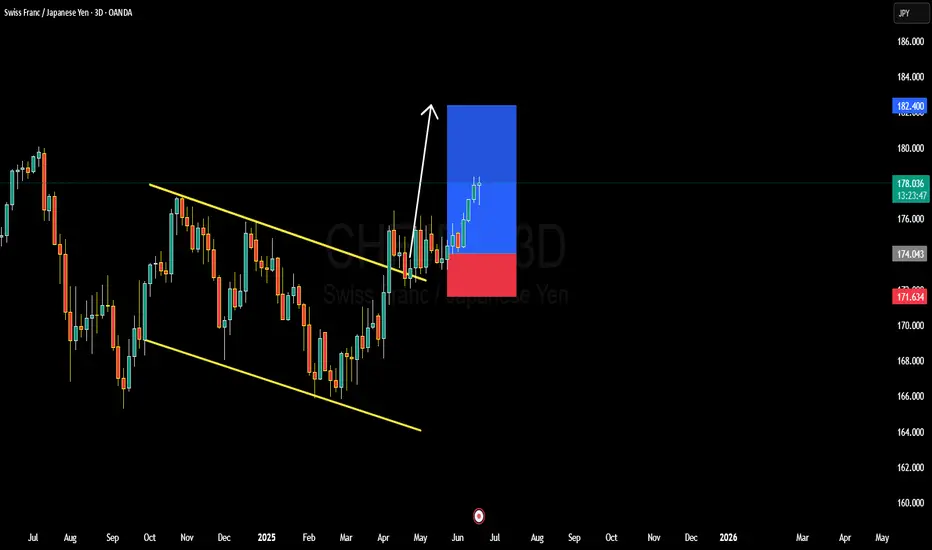
CHFJPY BULLISH OR BEARISH DETAILED ANALYSISCHFJPY has continued to play out exactly as forecasted, breaking out cleanly from the descending channel on the 3D timeframe and rallying strongly above key structure. Price is currently trading around 178.00, already delivering solid upside from the breakout zone. The bullish breakout was confirmed by consecutive impulsive candles with minimal retracement, a clear sign of institutional strength behind this move. As long as this momentum holds, the next major target is 182.00 – a psychological level and previous structure high, now acting as a magnetic zone for price.
On the fundamental side, the Swiss Franc continues to enjoy safe-haven flows as global macro uncertainty persists. The Swiss National Bank has maintained a relatively tight stance, with inflation staying stable and CHF demand picking up. On the flip side, the Japanese Yen remains broadly weak due to ultra-loose monetary policy from the Bank of Japan. BOJ’s reluctance to shift away from yield curve control and negative interest rates makes JPY one of the most attractive funding currencies, driving consistent CHFJPY upside.
Technically, this move is supported by a textbook breakout from a falling wedge pattern, which historically has a high probability of bullish continuation. The volume and momentum on the breakout were strong, and we have a clean higher high and higher low structure forming. This confirms the end of the correction phase and a transition into a trending bullish cycle. With the current risk sentiment leaning toward CHF strength and JPY weakness, I’m confident in further upside toward my 182.000 target.
I’ll continue to trail stops below 174.00 to lock in profit while giving the trade room to breathe. If price consolidates near 179.50–180.00 with low volume, I may look for re-entry setups on pullbacks. As of now, CHFJPY remains one of the strongest trending pairs on the board, and I’ll stay long as long as the structure holds.
XAUUSD BULLISH OR BEARISH DETAILED ANALYSISGold (XAUUSD) continues to maintain strong bullish momentum, with current price action sitting around 3,430. We have been holding a bullish outlook since the key accumulation zone between 3,150 and 3,200. Price has consistently formed higher highs and higher lows, and recent consolidation has broken out with conviction. Based on technical structure, my immediate upside target is 3,500, where I expect price to react before potentially extending even higher depending on upcoming macro drivers.
Fundamentally, gold is being fueled by a combination of sticky inflation data and a cautious Fed stance. Even though the FOMC held rates steady in June, market expectations are shifting towards policy easing later in the year due to softening labor data and a cooling economic outlook. Additionally, geopolitical uncertainties and continued central bank gold buying remain strong tailwinds for the metal. The U.S. dollar index has shown minor weakness post-CPI, offering further support to gold bulls.
Technically, the daily chart shows a clean bullish flag breakout that aligns with the trendline support and impulsive wave structure. Price broke above 3,400 with strong volume and minimal resistance, indicating clear bullish dominance. As long as price holds above the 3,380–3,400 zone, continuation toward 3,500 remains highly probable. There is also confluence from previous structure highs and minor Fibonacci extension levels around that mark.
Overall, I remain confidently long on XAUUSD. I’ve been tracking this bullish cycle since the 3,150–3,200 region and continue to favor upside moves backed by macroeconomic and technical alignment. I’ll be watching key reaction zones near 3,500 for potential profit-taking, while holding swing positions with dynamic risk management in place.

EURUSD BULLISH OR BARISH DETAILED ANALYSISEURUSD is showing strong bullish momentum after a clean bounce from the key support zone around 1.12. Price structure confirms higher lows and strong bullish candle formations on the daily chart, suggesting the bulls are in control. This recent move is backed by a textbook retest and rejection from the previous resistance-turned-support zone, giving confidence in a potential continuation toward the 1.19 level. With the current price trading near 1.15 and pushing higher, the market is positioned for a strong bullish wave in the coming sessions.
From a fundamental perspective, the Euro has gained fresh support after the ECB’s decision last week to proceed with a measured and data-dependent rate cut cycle. While the ECB delivered its first cut, the tone was cautious and far less dovish than anticipated, which kept EUR strength intact. On the USD side, traders are pricing in a more dovish outlook for the Federal Reserve, especially with recent CPI and PPI data pointing toward cooling inflation. This divergence in policy outlook continues to favor EURUSD upside in the medium term.
Technical indicators are also confirming the bullish bias. The pair is riding an ascending trendline, and momentum indicators like RSI remain in bullish territory without yet being overbought. A daily close above the 1.1550 area strengthens the case for a continuation move. The price is aiming for the next major resistance around 1.1770–1.19, where bulls are likely to take profit or scale out. Until then, dips are likely to be bought aggressively, as long as the 1.12 support remains intact.
This setup presents a high-probability opportunity in a trending market backed by both fundamentals and technical confluence. As long as the bullish structure holds, I remain long-biased on EURUSD with eyes on the 1.19 zone as the next key level. With increasing market interest, low volatility on the downside, and strong trend-following signals, this pair is set for a continued rally.

CADJPY BULLISH OR BEARISH DETAILED ANALYSISCADJPY has successfully broken out of a well-defined falling wedge pattern, confirming a bullish reversal setup on the daily timeframe. Price action has not only cleared the descending trendline but has also completed a clean retest of the breakout zone near 104.000–104.500. This retest held firmly, showing strong buyer interest, and the pair is now poised for a continuation toward the next key resistance level around 110.000. The technical structure is now favoring bulls, with momentum shifting upward after a prolonged corrective phase.
Fundamentally, the Canadian dollar is gaining strength supported by rising crude oil prices and stronger-than-expected economic data from Canada. The Bank of Canada’s recent tone remains relatively hawkish compared to other central banks, which adds further support to CAD. Meanwhile, the Japanese yen continues to remain under pressure due to the Bank of Japan's ultra-loose monetary policy stance. With Japan’s inflation struggling to sustain above target, the BOJ is showing no urgency to tighten, which keeps JPY weak against higher-yielding currencies like CAD.
The breakout from the falling wedge is also being supported by volume and bullish daily candles, suggesting a solid shift in market sentiment. The pair has formed a higher low and higher high, officially transitioning into a bullish structure. With the retest of the breakout structure now complete, there’s a high probability for continuation toward 108.000 initially and a full extension to 110.000 in the coming weeks.
Traders should closely monitor any dips as potential buying opportunities as long as CADJPY holds above 103.500–104.000 support. The reward-to-risk ratio remains favorable for swing traders aiming for medium-term targets. With strong technical confirmation, supportive fundamentals, and risk appetite returning to markets, CADJPY is setting up for a potentially profitable bullish wave.

GBPUSD BULLISH OR BEARISH DETAILED ANALYSIS ??GBPUSD has successfully completed its retest of the 1.34300–1.34500 support zone and is now showing strong signs of resuming its bullish momentum. The recent structure confirms a classic bullish continuation pattern, as price bounced cleanly off a critical support level that previously acted as resistance. This level has now flipped into a solid demand zone, giving buyers confidence to push toward the 1.40000 psychological target. Price action continues to respect the uptrend with higher lows forming since mid-April, suggesting strength and institutional accumulation.
From a macroeconomic perspective, the British pound remains fundamentally supported. Recent UK inflation data surprised to the upside, causing the market to delay rate cut expectations from the Bank of England. In contrast, the US dollar is weakening due to rising expectations that the Federal Reserve could initiate rate cuts later this year as inflation cools and labor market data softens. This divergence in policy outlooks between the BoE and the Fed is fueling bullish pressure on GBPUSD, making the 1.40000 level a realistic and high-probability target.
Technical confluence also supports this bullish wave. Fibonacci retracement levels drawn from the recent swing low to the high align closely with the support zone at 1.34300, which acted as a perfect retest before the next leg higher. Additionally, the bullish engulfing candles and consistent daily closes above the support level add further confirmation to the upside bias. As long as the pair holds above 1.34300, the structure favors bulls with strong momentum to test and potentially break the 1.38000 intermediate level on the way to 1.40000.
GBPUSD remains a high-confidence bullish opportunity, aligning both technically and fundamentally. The recent breakout and retest phase is complete, and the pair now appears poised for a sustained rally. With bullish market sentiment, favorable UK data, and USD softness across the board, this setup offers an excellent risk-to-reward ratio for medium-term swing traders targeting the 1.40000 zone.

NZDCAD BULLISH OR BEARISH DETAILED ANALYSIS ??NZDCAD is currently coiling within a textbook bullish flag formation after an aggressive impulsive leg to the upside. Price action remains tight inside this consolidation structure, respecting both trendline resistance and support. As we approach the apex of this flag, I’m closely watching for a breakout confirmation to trigger the next bullish continuation leg toward the 0.8600 target.
From a macro perspective, the New Zealand dollar is gaining strength following the RBNZ’s firm stance on keeping rates elevated due to persistent inflation risks, particularly in housing and services. On the flip side, the Canadian dollar is showing relative weakness as oil prices stall and the Bank of Canada shifts toward a more dovish tone amid weaker economic data and slowing consumer spending. This divergence in central bank policy and economic outlook is building a strong fundamental case for NZDCAD upside.
Technically, the structure remains clean. The market formed a strong bullish engulfing rally earlier in April, and since then has entered a symmetrical correction with higher lows forming under compression. This is a classic continuation setup with strong momentum buildup underneath. A breakout above the 0.8280–0.8300 zone with volume would likely trigger institutional interest and drive price rapidly toward the 0.8600 level, which aligns with the measured move of the flag.
This is a high-probability trade idea supported by both technical and fundamental convergence. With risk well-defined below 0.8135 and momentum favoring the bulls, NZDCAD is one of my top setups going into June. Breakout traders and swing traders alike should keep this pair on the radar as the next bullish expansion looks imminent.

GBPJPY BULLISH OR BEARISH DETAILED ANALYSISGBPJPY has successfully broken out of a long-term descending trendline on the 3D timeframe, which had capped price action for months. The breakout is now confirmed with multiple candle closes above the trendline and a retest holding firm around 190.500. This shift in structure signals a major bullish reversal, and I’m now targeting the 199.600 level as the next potential upside objective.
From a fundamental perspective, the British pound is strengthening amid persistent inflationary pressures in the UK, which are keeping the Bank of England firmly in the hawkish camp. With CPI still elevated and wage growth remaining sticky, the BoE has little room to cut rates aggressively anytime soon. In contrast, the Bank of Japan continues to hold a dovish tone with ultra-accommodative monetary policy, offering a wide interest rate differential that favors GBP longs, especially in carry trade setups.
Technically, this setup offers a clean risk-reward profile. The breakout above the descending structure combined with a strong support zone around 190.500 gives this move a solid foundation. We’re seeing momentum build with higher highs and higher lows forming across multiple timeframes. As long as GBPJPY holds above the 190.000 zone, the bullish bias remains valid and the path toward 199.600 looks open and sustainable.
Traders should keep a close eye on short-term pullbacks as potential re-entry zones. With a macro tailwind behind GBP strength and continued JPY weakness, this pair is primed for further upside. I’m riding this bullish wave with a medium-term outlook and adjusting my position based on intraday market behavior.

EURGBP BULLISH OR BEARISH DETAILED ANALYSISEURGBP is currently respecting a well-defined rising channel structure on the daily timeframe, and the pair has just delivered a strong bounce off the lower trendline support. This fresh reaction suggests renewed bullish momentum from the bulls stepping in at a key zone. The current price is hovering around 0.84–0.8450, and I’m targeting a move towards the 0.87 area, aligning perfectly with the upper boundary of the channel and a clean resistance level from previous market structure.
From a fundamental standpoint, euro sentiment is being supported by sticky inflation across the Eurozone. The ECB remains cautious with any premature easing, with policymakers signaling a data-dependent approach to rate cuts. Meanwhile, the UK economy is under pressure after the latest GDP figures confirmed weak growth, adding weight to the Bank of England’s dovish leanings. Traders are now increasingly pricing in rate cuts from the BOE in the coming quarter, creating a clear divergence in monetary policy outlooks — a bullish driver for EURGBP.
This technical setup is further reinforced by bullish candlestick formations on the daily chart, signaling a potential reversal from recent weakness. RSI is bouncing off mid-levels, and there's early crossover potential in MACD favoring upward momentum. Price has also reclaimed key support near 0.8400, now likely to act as a floor going forward. As long as price remains above this zone, the path of least resistance remains to the upside.
With this combination of a rising channel pattern, supportive euro fundamentals, and GBP macro weakness, EURGBP presents a high-probability long opportunity. I remain bullish on this pair with a clean 0.87 target in view. Momentum is building, and this setup fits perfectly into a swing trading model with trend continuation potential.

EURAUD BULLISH OR BEARISH DETAILED ANALYSISEURAUD is currently presenting a textbook bullish setup with a well-defined falling wedge formation on the daily chart. After a strong impulsive rally in April, price has been consolidating within this wedge, forming consistent lower highs and lower lows—typical of a corrective pattern. Now, with price testing the upper trendline of the wedge, we are positioned for a potential breakout, supported by increasing bullish momentum and clean structure. With the current price around 1.75, the next leg higher toward the 1.85 resistance zone is well on the radar.
From a fundamental perspective, the euro is gaining strength on the back of improving Eurozone macro data, with recent PMI figures showing resilience and inflation staying moderately sticky—making the ECB cautious about aggressive rate cuts. Meanwhile, the Australian dollar continues to face headwinds amid declining commodity prices and weakening consumer sentiment. The Reserve Bank of Australia remains relatively dovish, especially as wage growth plateaus and inflation expectations cool. This EURAUD divergence sets the stage for a broader move in favor of the euro.
Technically, the breakout from this wedge structure would signify the continuation of the prior bullish trend, and given the size of the previous impulsive move, a breakout target of 1.85 is both conservative and well-aligned with market structure. The bullish divergence forming on oscillators such as RSI and MACD also confirms the slowing momentum in the downward move. A clean break and close above 1.7550 would be the trigger point for long positions, with invalidation below 1.7220.
This is a high-probability breakout setup with strong confluence across technical and fundamental indicators. With euro strength coming into play and AUD fundamentals remaining weak, I’m favoring the long side here. A move toward 1.85 is well-supported, and a break above the wedge could trigger significant upside in the coming sessions. This is a setup worth watching closely.

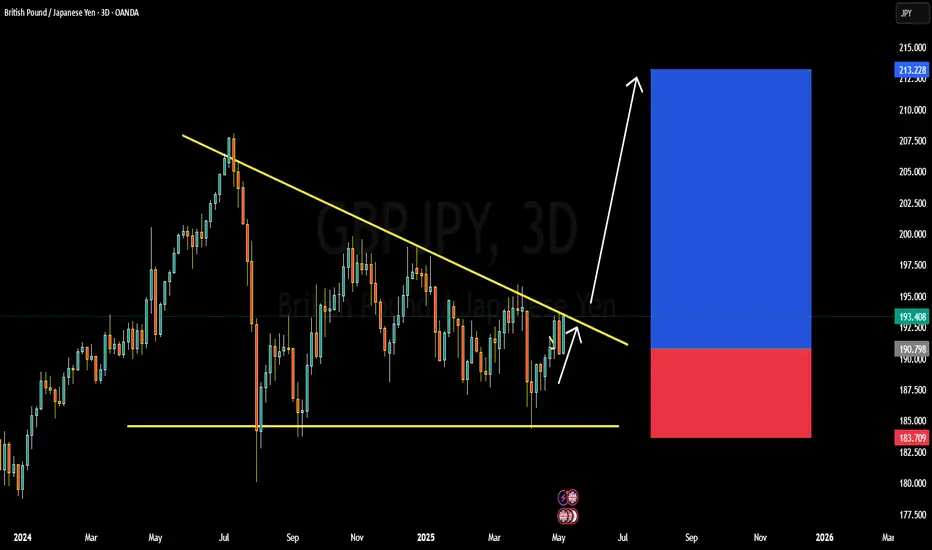
GBPJPY BULLISH OR BEARISH DETAILED ANALYSISGBPJPY is currently trading near 190.80 and is forming a significant breakout structure on the 3-day chart. After months of consolidation under a descending trendline, the pair is now coiling tightly, signaling a potential bullish breakout. The pair has respected the lower support range near 183.70 while pushing up against descending resistance multiple times. This squeeze pattern often precedes a major directional move, and with bullish momentum building, GBPJPY could be primed for a rally toward the 210.00 zone.
Fundamentally, the British pound is finding strong support from the latest hawkish commentary by the Bank of England, which has hinted that inflation remains sticky, keeping rate cut expectations delayed. On the other hand, the Japanese yen remains under consistent pressure due to the Bank of Japan's ultra-dovish stance and yield curve control policies. The BoJ’s reluctance to shift its policy outlook, coupled with soft macro data from Japan, is weakening the yen across the board.
Technically, a breakout and close above the descending trendline around 194.00 will be a key confirmation point. If this happens, bulls could dominate and push GBPJPY toward the 210.00 resistance zone in the medium term. The R\:R on this setup remains favorable with stops safely tucked below 183.70, giving this trade strong upside potential.
This pair is currently one of my top watchlist setups for May as both the technical and fundamental landscapes align. With bullish sentiment driving GBP strength and JPY weakness being a prevailing macro theme, GBPJPY could deliver a powerful upside continuation if the breakout confirms.
EURJPY BULLISH OR BEARISH DETAILED ANALYSIS ??EURJPY is currently trading around 162.800 and showing clear bullish momentum after a clean bounce off a strong support zone. Price has been consolidating above a well-established demand area, and today's candle confirms renewed buyer interest. The reaction from this level highlights a potential shift back to the upside, with 169.000 marked as the next significant target. The rejection wicks and structure suggest accumulation, with the market gearing up for a bullish continuation.
From a fundamental perspective, the euro is gaining strength on the back of better-than-expected economic data across the eurozone, while the Japanese yen continues to face broad pressure due to the Bank of Japan's dovish stance. The BOJ remains committed to ultra-loose monetary policy, which puts the yen at a disadvantage against stronger currencies like the euro, especially when inflation expectations in Europe remain sticky.
Technically, EURJPY has respected this support zone multiple times, creating a solid base of demand. Each test has been met with higher lows, reinforcing the bullish bias. The price action is forming a classic support-retest continuation pattern, and if this structure holds, we could see a swift move toward 169.000. Volume and momentum indicators are also beginning to align in favor of the bulls.
Looking forward, as long as price holds above the 162.200 area, the path of least resistance remains upward. Traders will be watching for continuation signals and breakouts of minor resistance zones to confirm the move. This setup offers a favorable risk-reward structure, and with market sentiment tilting toward euro strength, EURJPY has the potential to deliver solid gains in the coming sessions.

GBPUSD BULLISH OR BEARISH DETAILED ANALYSISGBPUSD is currently trading around 1.33400 and is displaying a promising bullish setup. The price action is coiling within a symmetrical triangle, which typically signals a potential breakout. A clear bullish structure has already formed following the recent impulse wave, and with the consolidation tightening, we are now closely watching for a breakout to the upside. The expected bullish breakout aligns with the projected target of 1.36000, offering a strong risk-reward opportunity for trend-following traders.
From a fundamental standpoint, the British pound is showing resilience despite broader dollar strength. Recent comments from the Bank of England have maintained a cautious yet firm tone regarding inflation control, hinting at the potential for rates to stay elevated longer than markets previously priced in. Meanwhile, the U.S. dollar index has seen some pressure amid mixed economic data and increasing speculation that the Federal Reserve may hold rates steady in the upcoming sessions.
Technically, GBPUSD remains well-supported above the 1.32500 level, with buyers defending key horizontal and trendline support areas. The recent compression in price suggests that volatility is about to expand, typically favoring the direction of the initial trend, which in this case remains bullish. Momentum indicators are beginning to curl higher, further supporting a breakout scenario.
In summary, GBPUSD is setting up for a high-probability bullish continuation. A confirmed breakout from the triangle could ignite a fresh rally toward 1.36000, especially if supported by dovish Fed rhetoric and firm UK economic sentiment. This setup is one to watch closely as it aligns both technically and fundamentally, positioning it as a favorable opportunity for medium-term swing trades.

XAUUSD Bullish or bearish Detailed AnalysisXAUUSD is currently trading around 3380, continuing its bullish momentum as previously anticipated. The price action has followed the projected path, delivering substantial profits for those positioned early. The next key resistance level is at 3450, aligning with the upper boundary of the ascending channel.
Fundamentally, gold's rally is supported by heightened safe-haven demand amid ongoing geopolitical tensions and a weakening U.S. dollar. Investors are closely watching the upcoming Federal Reserve meeting, with expectations leaning toward a dovish stance, which could further bolster gold prices .
Technical indicators suggest that the bullish trend remains intact, with the price maintaining its position above key moving averages. However, traders should be cautious of potential pullbacks as the market approaches overbought conditions.
In summary, XAUUSD is on track toward the 3450 target, supported by both technical and fundamental factors. Traders should monitor key resistance levels and macroeconomic developments to manage their positions effectively.

GBPJPY DETAILED TECHNICAL AND FUNDAMENTALSGBPJPY is currently trading around the 191.00 zone, and price action is forming a classic bullish flag pattern on the 4H chart. This follows a strong impulse leg, suggesting a potential continuation to the upside. The consolidation is tight and healthy, showing market participants are preparing for a breakout. My upside target stands at 193.000, which aligns with the descending trendline resistance.
From a fundamental perspective, the British Pound remains supported by recent hawkish signals from the Bank of England, which is facing persistent inflation pressures. Meanwhile, the Japanese Yen continues to weaken across the board due to the Bank of Japan’s ultra-loose monetary stance and its defense of yield curve control, which makes it less attractive in a high-interest environment.
Technically, this setup aligns with key momentum indicators and market structure. If price breaks above the flag pattern with volume confirmation, we can expect buyers to take control, pushing price toward the 193.000 resistance zone. This level also coincides with a key liquidity area where prior sellers may be trapped.
Overall, GBPJPY continues to offer a solid bullish bias in the short term. The pair is fundamentally and technically aligned for a push higher. Breakout traders should monitor closely as the price approaches the upper trendline of the flag. This is one of the most watched JPY pairs right now—momentum is building.

USDCHF BULLISH OR BEARISH DETAILED ANALYSISWe are currently observing the USD/CHF pair, which is trading around 0.8225 as of April 23, 2025. The pair has recently experienced a slight uptick, driven by renewed demand for the US dollar following President Trump's decision to retract threats against Federal Reserve Chair Jerome Powell. This move has alleviated investor concerns regarding the Fed's independence, providing a temporary boost to the greenback.
Despite this short-term rally, the overall outlook for USD/CHF remains bearish. The pair is trading below the critical 100-day Exponential Moving Average (EMA), and the Relative Strength Index (RSI) is hovering near 36, indicating continued selling pressure. The immediate resistance level is identified at 0.8360, while the first support level to monitor is at 0.8121.
Fundamentally, the Swiss franc has appreciated significantly, surging approximately 9% against the US dollar in April alone. This appreciation is attributed to global uncertainties stemming from shifting US trade policies, which have increased demand for safe-haven assets like the franc. The Swiss National Bank (SNB) is under pressure to address this rapid rise, as it poses risks to their inflation targets and the competitiveness of Swiss exports.
In conclusion, while there may be short-term fluctuations influenced by geopolitical developments and central bank communications, the prevailing trend for USD/CHF appears bearish. Traders should remain cautious and monitor key support and resistance levels, as well as fundamental factors that could impact the pair's trajectory.

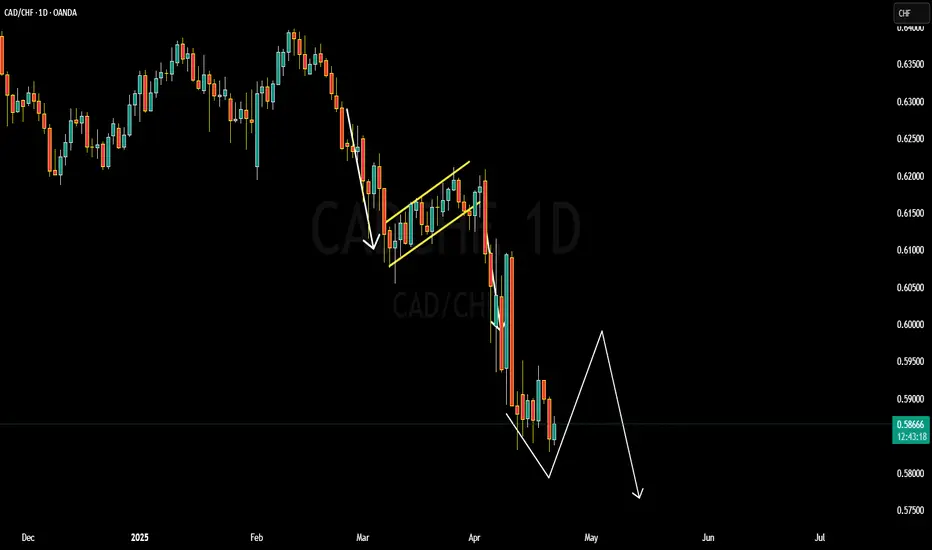
CADCHF BULLISH OR BEARISH DETAILED ANALYSIS We closely monitoring CADCHF, which is currently trading around 0.588. The pair has been in a strong downtrend, reflecting the broader weakness in the Canadian dollar against the Swiss franc. Technical indicators, including moving averages and momentum oscillators, suggest continued bearish momentum.
Fundamentally, the Canadian dollar is under pressure due to declining oil prices and a cautious stance from the Bank of Canada regarding interest rate hikes. In contrast, the Swiss franc benefits from its safe-haven status amid global economic uncertainties. The Swiss National Bank's relatively stable monetary policy further supports the franc's strength.
Key support levels to watch are at 0.57 and 0.58, while resistance levels are at 0.6050 and 0.6100. A break below the support could signal further downside potential, whereas a move above the resistance might indicate a reversal. Traders should remain cautious and consider macroeconomic developments when making trading decisions.
In conclusion, CAD/CHF presents a bearish outlook in the near term, influenced by both technical and fundamental factors. Monitoring economic indicators and central bank policies will be crucial for identifying potential trading opportunities in this pair.
GBPCAD IS BULLISH OR BEARISH DETAILED ANALYSISGBPCAD is currently presenting a high-probability bullish setup after a textbook inverse head and shoulders formation on the 12H chart. Price is now hovering around 1.8457 and has just broken out above the descending trendline acting as neckline resistance. This structural shift, combined with clean bullish price action, signals the potential beginning of a fresh upward leg toward the 1.8976 region, a prior key supply zone and the projected target based on the measured move technique from the pattern.
From a fundamental standpoint, the British Pound is supported by hawkish BoE rhetoric and stronger-than-expected UK inflation data. Sticky core CPI and a robust labor market are keeping interest rate expectations elevated, which strengthens GBP across the board. In contrast, the Canadian Dollar remains under pressure due to softer oil prices and the Bank of Canada's dovish stance as it flirts with rate cuts in upcoming meetings. This macro divergence is fueling the momentum in GBPCAD’s favor, making it a favored pair for swing longs.
Technically, the pair is forming higher lows with increasing volume, which adds confidence to the breakout. The risk is well defined below 1.8198, making this an attractive trade with a solid 1:2+ reward-to-risk profile. As price continues to respect bullish market structure, any pullback toward the neckline could offer a prime re-entry zone for continuation traders.
This setup aligns with highly searched price action strategies such as “inverse head and shoulders breakout,” “neckline retest,” and “GBP strength vs CAD weakness.” With both technical and fundamental confluence pointing in the same direction, GBPCAD is set up for a potentially profitable swing opportunity heading into May.

WHY XAUUSD IS BULLISH ?? DETAILED TECHNICAL AND FUNDAMENTALSXAUUSD is currently showing strong signs of bullish continuation after completing a successful retest of the previous breakout zone near the $2,920–$2,950 region. Price action has respected this support beautifully and is now pushing back above $3,040, confirming the bullish structure. This retest and bounce pattern suggests that the market is preparing for a fresh leg higher, with my immediate target set at $3,100. The current structure is aligned with higher highs and higher lows, and momentum is shifting back in favor of buyers.
Technically, the move is clean. The bullish impulse from February to late March created a strong upside leg, followed by a healthy correction into a well-defined demand zone. This demand zone held firm, and the current reaction is supported by increasing volume and bullish candlestick formation on the 12H chart. The inverse head-and-shoulders structure around $2,930 gives this setup even more weight, with a clear breakout above the neckline indicating potential continuation toward higher time frame targets.
From a fundamental perspective, gold remains supported by ongoing geopolitical tensions, increased demand from central banks, and continued inflationary pressure globally. As the market anticipates this week's U.S. CPI data, investors are hedging against uncertainty, which is driving flows into safe-haven assets like gold. The recent pullback in the US dollar index and bond yields is also contributing to upside pressure on XAUUSD, further confirming the bullish outlook.
With both the technical setup and macro drivers favoring upside, I'm looking for continuation toward $3,100 and potentially beyond in the short to mid-term. This area also aligns with the next psychological resistance and projected extension level. As long as price holds above $3,000, any dips should be viewed as fresh buying opportunities. This setup offers an excellent risk-reward ratio for traders looking to capitalize on gold’s ongoing bullish momentum.

WHY EURUSD IS BULLISH ?? DETAILED FUNDAEMTALS AND TECHNICAL EUR/USD is currently trading around 1.0880, exhibiting a bullish trend after completing a retest within the 0.50 to 0.61 Fibonacci retracement levels. This technical formation suggests a potential upward movement toward the target price of 1.1000, indicating strong support and the possibility of continued appreciation.
Fundamentally, the euro has shown resilience despite recent dovish signals from the European Central Bank (ECB). ECB board member Piero Cipollone has advocated for further policy easing, citing declining inflation and economic shifts as justifications for additional interest rate cuts. Conversely, the U.S. dollar has experienced modest gains amid uncertainties surrounding potential tariffs and mixed economic data, contributing to its volatility. These dynamics create a nuanced environment where the euro's strength may persist in the short term
Technical analysis reinforces the bullish outlook for EUR/USD. The pair's rebound from the 0.50 to 0.61 Fibonacci retracement levels indicates robust support, with the recent completion of the retest phase suggesting readiness for further ascent. Key resistance levels to monitor include 1.0945, with a sustained break above this point potentially paving the way toward the 1.1000 target. Indicators such as the Relative Strength Index (RSI) and moving averages also support the continuation of the upward trend
Traders should remain vigilant regarding upcoming economic releases and central bank communications, as these can significantly influence market sentiment and price action. Implementing sound risk management strategies, including appropriate stop-loss orders, is essential to navigate potential volatility. By staying informed and adaptable, traders can effectively capitalize on the anticipated bullish movement in the EUR/USD pair.

BNB: Navigating the Current DipBNB: Navigating the Current Dip 📉🔍
The crypto market is always in flux, and right now, BNB is showing signs of a downward trend. However, it's not all doom and gloom. Let's break down the situation.
The Current Scenario 📉:
BNB is currently experiencing a downward trajectory. Despite this, it's crucial to acknowledge that the coin has maintained a pattern of higher lows and higher highs. This suggests that the current dip might be a temporary sideways correction before BNB aims for the $650 mark in the near future.
Key Technical Analysis 📊:
Fibonacci Levels: BNB is currently within the Fibonacci retracement levels of $629.7 to $638.6. These levels are significant indicators of potential support and resistance.
Support and Resistance:
A strong support level has been observed at $630.9.
Potential resistance is identified at $637.2.
Statistical Analysis: This analysis is based on robust statistical modeling, specifically the VAR (Vector Autoregression) model, which helps in understanding the interdependencies between multiple time series data. This adds a layer of reliability to the prediction.
Understanding the Trends 🤔:
The fact that BNB is maintaining the pattern of higher lows and higher highs indicates that the overall bullish trend might still be intact. The current dip could be a temporary phase of consolidation before the next upward surge.
The $650 Target 🎯:
The analyst predicts that BNB is likely to aim for the $650 price point in the near term. This prediction is based on the analysis of current trends and historical data.
The Next 12 Hours ⏳:
The next 12 hours are critical. We'll be closely monitoring how BNB interacts with the identified support and resistance levels. Any significant break above or below these levels could indicate the direction of the next major move.
Important Considerations ⚠️:
The crypto market is highly volatile.
Always conduct your own research before making any investment decisions.
Market fluctuations are possible.
In Conclusion 🌟:
While BNB is currently on a downward trend, the overall outlook remains cautiously optimistic. The identified support and resistance levels, combined with the statistical analysis, provide valuable insights into potential future movements. Let's keep a close eye on BNB in the next 12 hours to see how things unfold.
I hope this breakdown provides a clear picture of the current BNB situation! 🚀
What do you think, friends?

AUDNZD Ascending Triangle Bullish Breakout Targeting 1.1340The AUDNZD currency pair is currently trading at 1.1140, with a target price of 1.1340, suggesting a potential upward move of 100+ pips. The pair is forming an ascending triangle pattern, a classic bullish continuation pattern. This pattern typically forms when the price consistently makes higher lows while encountering a horizontal resistance level, signaling a potential breakout above the resistance. Traders are looking for a confirmation of the breakout above the resistance level to target 1.1340.
From a technical perspective, the ascending triangle is often a sign of market indecision, but it’s typically followed by a breakout to the upside when the price pushes through the resistance at the top of the triangle. In this case, the breakout would likely target the 1.1340 level, where the next significant resistance could come into play.
On the fundamental side, the Australian dollar has been relatively stronger recently due to robust commodity exports, particularly iron ore and coal. In contrast, the New Zealand dollar faces pressure from a more dovish outlook from the Reserve Bank of New Zealand, which has recently taken a cautious approach to monetary policy. These economic dynamics could support the bullish case for AUDNZD, especially if the breakout occurs in favor of the Aussie dollar.
In summary, the ascending triangle pattern on AUDNZD points toward a bullish breakout above the 1.1160 resistance. If confirmed, the pair could target the 1.1340 level. Keep an eye on any upcoming economic data from both Australia and New Zealand, as these could provide further confirmation or invalidate the breakout.
