CADJPY BULLISH OR BEARISH DETAILED ANALYSISCADJPY has successfully broken out of a well-defined falling wedge pattern, confirming a bullish reversal setup on the daily timeframe. Price action has not only cleared the descending trendline but has also completed a clean retest of the breakout zone near 104.000–104.500. This retest held firmly, showing strong buyer interest, and the pair is now poised for a continuation toward the next key resistance level around 110.000. The technical structure is now favoring bulls, with momentum shifting upward after a prolonged corrective phase.
Fundamentally, the Canadian dollar is gaining strength supported by rising crude oil prices and stronger-than-expected economic data from Canada. The Bank of Canada’s recent tone remains relatively hawkish compared to other central banks, which adds further support to CAD. Meanwhile, the Japanese yen continues to remain under pressure due to the Bank of Japan's ultra-loose monetary policy stance. With Japan’s inflation struggling to sustain above target, the BOJ is showing no urgency to tighten, which keeps JPY weak against higher-yielding currencies like CAD.
The breakout from the falling wedge is also being supported by volume and bullish daily candles, suggesting a solid shift in market sentiment. The pair has formed a higher low and higher high, officially transitioning into a bullish structure. With the retest of the breakout structure now complete, there’s a high probability for continuation toward 108.000 initially and a full extension to 110.000 in the coming weeks.
Traders should closely monitor any dips as potential buying opportunities as long as CADJPY holds above 103.500–104.000 support. The reward-to-risk ratio remains favorable for swing traders aiming for medium-term targets. With strong technical confirmation, supportive fundamentals, and risk appetite returning to markets, CADJPY is setting up for a potentially profitable bullish wave.
BNB


GBPUSD BULLISH OR BEARISH DETAILED ANALYSIS ??GBPUSD has successfully completed its retest of the 1.34300–1.34500 support zone and is now showing strong signs of resuming its bullish momentum. The recent structure confirms a classic bullish continuation pattern, as price bounced cleanly off a critical support level that previously acted as resistance. This level has now flipped into a solid demand zone, giving buyers confidence to push toward the 1.40000 psychological target. Price action continues to respect the uptrend with higher lows forming since mid-April, suggesting strength and institutional accumulation.
From a macroeconomic perspective, the British pound remains fundamentally supported. Recent UK inflation data surprised to the upside, causing the market to delay rate cut expectations from the Bank of England. In contrast, the US dollar is weakening due to rising expectations that the Federal Reserve could initiate rate cuts later this year as inflation cools and labor market data softens. This divergence in policy outlooks between the BoE and the Fed is fueling bullish pressure on GBPUSD, making the 1.40000 level a realistic and high-probability target.
Technical confluence also supports this bullish wave. Fibonacci retracement levels drawn from the recent swing low to the high align closely with the support zone at 1.34300, which acted as a perfect retest before the next leg higher. Additionally, the bullish engulfing candles and consistent daily closes above the support level add further confirmation to the upside bias. As long as the pair holds above 1.34300, the structure favors bulls with strong momentum to test and potentially break the 1.38000 intermediate level on the way to 1.40000.
GBPUSD remains a high-confidence bullish opportunity, aligning both technically and fundamentally. The recent breakout and retest phase is complete, and the pair now appears poised for a sustained rally. With bullish market sentiment, favorable UK data, and USD softness across the board, this setup offers an excellent risk-to-reward ratio for medium-term swing traders targeting the 1.40000 zone.

HolderStat┆BNBUSDCRYPTOCAP:BNB breakout watch: Binance Coin reclaims the 692 pivot, carving a triangle within an ascending channel and aiming at the 740 supply zone. Technical analysis notes firm trend-line support, bolstering a bullish continuation view for traders.

BNB/USDT"Binance, like Ethereum, is in its best condition right now. Do you think it will go up or down?"

USDCAD BULLISH OR BEARISH DETAILED ANALYSIS ??USDCAD continues to follow the predicted bearish path, currently trading around 1.38300, and still moving gradually toward our target zone of 1.34300. After a strong bearish impulse from the 1.40391 supply zone, price has consistently formed lower highs, confirming selling pressure and market intent. The recent bounce was shallow, and price is respecting previous resistance levels perfectly, validating the bearish continuation setup.
Fundamentally, the Canadian dollar is gaining strength off rising oil prices and improving economic data from Canada, while the US dollar remains under pressure as the market begins pricing in a potential Fed rate cut in the second half of 2025. With softer US economic indicators including lower consumer confidence and slowing GDP growth, the momentum clearly favors CAD in this pair. The divergence in monetary policy outlooks between the Bank of Canada and the Federal Reserve adds further downside bias to USDCAD.
Technically, the structure remains bearish, with a clean breakdown below the 1.3900 psychological level and clear rejection at the 1.40300 resistance zone. Market liquidity appears to be shifting below the current price, and with the pair printing consistent lower highs and lower lows, there's significant space toward our target zone near 1.34128. A rejection from the minor pullback zone between 1.38800–1.39000 could provide another entry opportunity for trend continuation traders.
USDCAD remains a high-probability short setup in line with both technical structure and current fundamentals. As long as price stays below the 1.40300 resistance, I expect the bearish trend to continue with increased momentum as we approach summer liquidity shifts. This trade is already deep in profit and aligns with key institutional selling zones, making 1.34300 a realistic and conservative target in the coming weeks.

BNB/USDT Trade Setup: Bullish Trend, Discount Entry & Fibonacci 📈 BNB/USDT Trade Setup Breakdown 💰🔥
Currently watching BNB / USDT closely... and it's looking interesting! 🧐
BNB has been in a steady, bullish trend with consistent retracements into equilibrium of previous price ranges — offering repeated opportunities to buy at a discount. 📉💸
My bias remains bullish — I'm looking to continue with the trend.
Price has pulled back into my optimal entry zone, you could get long now or wait for a deeper pullback, depending on your personal entry criteria. 🎯
🛡️ Stop-loss goes just below the previous swing low, maintaining tight risk control.
In this video, I break down:
🔹 How I use Fibonacci + Fibonacci extension for precise entries and target zones
🔹 My custom Risk/Reward tool, a variation of the Fib extension.
🔹 Key zones I’m watching, and how I’m managing this setup.
⚠️ Not financial advice. Always do your own research and manage risk accordingly.
💬 Your opinions or feedback? Let me know in the comments 👇

The key is whether it can rise above 691.77
Hello, traders.
If you "Follow", you can always get the latest information quickly.
Have a nice day today.
-------------------------------------
(BNBUSDT 1D chart)
The key is whether it can rise above the previous ATH point of 691.77 and maintain the price.
Currently, I think the OBV indicator is showing an increase with trading volume as it rises above the High Line.
-
If it fails to rise, we should check whether the price can be maintained above the M-Signal indicator on the 1D chart.
If it falls below the HA-High indicator point of 654.90, it will eventually fall below the M-Signal indicator on the 1D chart, so it is likely to turn into a short-term decline, so caution is required when trading.
If it continues to fall further, it is expected to determine the trend again when it meets the M-Signal indicator on the 1W chart.
-
If it rises above 691.77 and maintains the price, it seems likely to renew the ATH.
-
The basic trading strategy is to buy near the HA-Low indicator and sell near the HA-High indicator.
However, if it is supported and rises on the HA-High indicator, it is likely to show a stepwise rise, and if it is resisted and falls on the HA-Low indicator, it is likely to show a stepwise fall.
Therefore, the basic trading method should be a split trading method.
You should establish a basic trading strategy that suits your investment style.
Otherwise, you may trade in the wrong direction due to subjective thoughts caused by price volatility.
-
Thank you for reading to the end.
I hope you have a successful trade.
--------------------------------------------------
- This is an explanation of the big picture.
(3-year bull market, 1-year bear market pattern)
I will explain more details when the bear market starts.
------------------------------------------------------

NZDCHF BULLISH OR BEARISH DETAILED ANALYSIS ??NZDCHF is currently consolidating in a textbook bullish flag pattern after a sharp recovery from the recent lows near 0.4680. Price action is compressing just below a key supply zone around 0.4950–0.4980, signaling a potential breakout setup as momentum builds. This flag is forming after a clear impulse move, and with the structure respecting higher lows, I’m preparing for a bullish continuation toward the 0.5100–0.5150 target zone.
Fundamentally, the New Zealand dollar is gaining strength supported by the RBNZ's firm hold on tight monetary policy, as inflation remains sticky in services and housing. Governor Orr’s latest comments reaffirmed that the central bank is not ready to pivot until they see a clear disinflationary trend. On the other hand, the Swiss franc is showing signs of weakness, as the SNB remains one of the most dovish central banks in the G10 space, with real interest rates still negative and inflation pressures easing significantly.
Technically, we’re in a bullish structure with key demand holding strong at the 0.4840–0.4860 range. Price is now coiling just under resistance, and a clean breakout above the 0.4950 level could ignite the next impulsive leg toward 0.5100. If the breakout confirms with increased volume and market sentiment aligns, this setup presents a high probability long opportunity with a favorable R\:R.
NZDCHF remains on my radar as a breakout trade backed by both technical structure and macro fundamentals. With capital flows favoring the Kiwi and risk appetite rotating back into higher-yielding currencies, this pair offers a solid bullish continuation setup for the coming weeks. Stay patient, let the breakout confirm, and ride the momentum higher.

NZDCAD BULLISH OR BEARISH DETAILED ANALYSIS ??NZDCAD is currently coiling within a textbook bullish flag formation after an aggressive impulsive leg to the upside. Price action remains tight inside this consolidation structure, respecting both trendline resistance and support. As we approach the apex of this flag, I’m closely watching for a breakout confirmation to trigger the next bullish continuation leg toward the 0.8600 target.
From a macro perspective, the New Zealand dollar is gaining strength following the RBNZ’s firm stance on keeping rates elevated due to persistent inflation risks, particularly in housing and services. On the flip side, the Canadian dollar is showing relative weakness as oil prices stall and the Bank of Canada shifts toward a more dovish tone amid weaker economic data and slowing consumer spending. This divergence in central bank policy and economic outlook is building a strong fundamental case for NZDCAD upside.
Technically, the structure remains clean. The market formed a strong bullish engulfing rally earlier in April, and since then has entered a symmetrical correction with higher lows forming under compression. This is a classic continuation setup with strong momentum buildup underneath. A breakout above the 0.8280–0.8300 zone with volume would likely trigger institutional interest and drive price rapidly toward the 0.8600 level, which aligns with the measured move of the flag.
This is a high-probability trade idea supported by both technical and fundamental convergence. With risk well-defined below 0.8135 and momentum favoring the bulls, NZDCAD is one of my top setups going into June. Breakout traders and swing traders alike should keep this pair on the radar as the next bullish expansion looks imminent.

BNBUSD aiming for $800 and that's only short-term.Binance Coin (BNBUSD) is staging a strong short-term push after holding its 1D MA200 (orange trend-line). This is taking place on the technical Bullish Leg of the 10-month Channel Up.
The 1W RSI broke above its MA trend-line (yellow) and that confirmed this new bullish structure. The previous Bullish Leg peaked a little over the 2.0 Fibonacci extension. Our short-term Target is therefore $800.
-------------------------------------------------------------------------------
** Please LIKE 👍, FOLLOW ✅, SHARE 🙌 and COMMENT ✍ if you enjoy this idea! Also share your ideas and charts in the comments section below! This is best way to keep it relevant, support us, keep the content here free and allow the idea to reach as many people as possible. **
-------------------------------------------------------------------------------
💸💸💸💸💸💸
👇 👇 👇 👇 👇 👇

HolderStat┆BNBUSD breakthrough bastion to 750CRYPTOCAP:BNB — Downtrend line shattered; retest formed a tight rectangle just above 635 neckline. Strong consolidation over rising support signals intent to reach the 720-760 extension zone marked atop former range. Bulls must guard 600-610 to preserve breakout psychology.

CETUS Hack Giving Opportunities Within SUICRYPTOCAP:SUI SUI is one of the fastest growing L1 chains. Previously extreme intra SUI dominance within swapping volume by KUCOIN:CETUSUSDT CETUS. This hack is a direct threat to the confidence of not just the application but the chain itself just like Ethereum was exposed during the MakerDAO hack.
Volume market wants to know their funds are secure to certain degree and predictable. Volume flow is more than fine with centralisation, esp with low barriers. Should the deposits be mostly secured and exploit fixed then it can bring confidence roaring back not just to CETUS but more importantly, SUI.
CETUS dominance within SUI is falling to rising applications. My favourite is Bluefin with its low barriers to account creation like google login. KUCOIN:BLUEUSDT BLUE has rising dominance within SUI volume market.

BNB will rest after reaching 1000BNB has successfully bounced back from the support area and heading towards the next resistance which is around 900-1000. This target is easily achievable for BNB since is fundamentally strong and BNB ecosystem is heavily used.
I'm expecting BNB to reach 1000 in 3rd of this year.
Follow Our TradingView Account for More Technical Analysis Updates, | Like, Share and Comment Your thoughts.
Cheers
GreenCrypto

GBPJPY BULLISH OR BEARISH DETAILED ANALYSISGBPJPY has successfully broken out of a long-term descending trendline on the 3D timeframe, which had capped price action for months. The breakout is now confirmed with multiple candle closes above the trendline and a retest holding firm around 190.500. This shift in structure signals a major bullish reversal, and I’m now targeting the 199.600 level as the next potential upside objective.
From a fundamental perspective, the British pound is strengthening amid persistent inflationary pressures in the UK, which are keeping the Bank of England firmly in the hawkish camp. With CPI still elevated and wage growth remaining sticky, the BoE has little room to cut rates aggressively anytime soon. In contrast, the Bank of Japan continues to hold a dovish tone with ultra-accommodative monetary policy, offering a wide interest rate differential that favors GBP longs, especially in carry trade setups.
Technically, this setup offers a clean risk-reward profile. The breakout above the descending structure combined with a strong support zone around 190.500 gives this move a solid foundation. We’re seeing momentum build with higher highs and higher lows forming across multiple timeframes. As long as GBPJPY holds above the 190.000 zone, the bullish bias remains valid and the path toward 199.600 looks open and sustainable.
Traders should keep a close eye on short-term pullbacks as potential re-entry zones. With a macro tailwind behind GBP strength and continued JPY weakness, this pair is primed for further upside. I’m riding this bullish wave with a medium-term outlook and adjusting my position based on intraday market behavior.

Another reversal coming (Altcoins Market)A reversal at the blue box zone has already occurred. Now, we’re looking at a potential minor reversal, pay close attention between Tuesday and Wednesday. Why does this matter? Because the fastest and safest way to make money is to buy low and sell high.
I usually exit when it becomes highly overbought or reacts to key support and resistance (SnR) zones. Currently, I’m not holding any major positions, except for a few memecoins.
Once the price reaches the red box area, I’ll be loading up. This time, I’m choosing CRYPTOCAP:BNB and $APT.
Don’t ask me why, I just am.

ETH - Ethereum Weekly Chart🔍 Market Structure & Smart Money Analysis:
✅ Bullish Signs:
Recent CHoCH at $2,000: Suggests shift from bearish to bullish order flow
BOS above recent resistance: Confirms upward market structure
Stochastic Oscillator: Turning bullish from oversold area (momentum confirmation)
Volume Pickup: Suggests stronger buyer interest
🧠 Liquidity Zones:
Equal Lows (EQL) seen in 2023 and again near 2024 → were taken out → classic liquidity sweep before reversal
Weak High near $4,951: A future potential liquidity target
Supply Zone around $3,200–$3,700: Previously strong resistance, could act as a rejection point again
🧭 Trend Summary:
Macro Structure: Recovering from multi-month downtrend
Short-Term: Bullish momentum building post-reversal
Next Objectives:
Bullish target: $3,200–$3,700 (possible pause or reversal zone)
Bearish invalidation: Drop below $2,000 with strong candle body
📝 Conclusion & Outlook:
ETH has likely confirmed a bullish shift on the weekly timeframe with the CHoCH and BOS above $2K.
Immediate upside targets are within the $3,200–$3,700 region before facing stronger resistance.
This could be the beginning of a longer-term accumulation → markup cycle, targeting the $4,950+ liquidity zone eventually.
Keep monitoring weekly closes and volume, and watch for divergence or rejection signals near supply zones.
-------------------
----------------------------
Low Market Cap #RWA #RealEstate #Tokenization Platforms by FDV
SQRB $100K on PROBIT
$RNB $310K
$HTS $1.9M
$STBU $3.5M
LAND $3.6M
-----
Not for recommendations to BUY SELL any stocks, cryptos, FX or securities
Not for Financial Advise
DYOR

HolderStat┆BNBUSD prepare to test $700CRYPTOCAP:BNB surges out of a falling-channel base, then prints twin consolidation pennants that keep hugging an accelerating support rail near 640 USDT. Friday’s fresh thrust through the pennant roof drags price back inside the long-term rising wedge, opening a measured path toward the 720-740 resistance shelf. As long as the inner trendline at 630-635 holds, momentum traders can lean on the channel mid-line; a daily close below 600 would defer—but not defeat—the bullish thesis.

BNBUSDT | Watching the Blue BoxesBNBUSDT is setting up a possible move, and I’ll be watching for an upward break inside the blue boxes .
No need to jump the gun. If price breaks out with volume and confirms on a lower timeframe, that’s where opportunity begins .
“I will not insist on my short idea. If the levels suddenly break upwards and do not give a downward break in the low time frame, I will not evaluate it. If they break upwards with volume and give a retest, I will look long.”
Let others guess. You wait with purpose.
📌I keep my charts clean and simple because I believe clarity leads to better decisions.
📌My approach is built on years of experience and a solid track record. I don’t claim to know it all but I’m confident in my ability to spot high-probability setups.
📌If you would like to learn how to use the heatmap, cumulative volume delta and volume footprint techniques that I use below to determine very accurate demand regions, you can send me a private message. I help anyone who wants it completely free of charge.
🔑I have a long list of my proven technique below:
🎯 ZENUSDT.P: Patience & Profitability | %230 Reaction from the Sniper Entry
🐶 DOGEUSDT.P: Next Move
🎨 RENDERUSDT.P: Opportunity of the Month
💎 ETHUSDT.P: Where to Retrace
🟢 BNBUSDT.P: Potential Surge
📊 BTC Dominance: Reaction Zone
🌊 WAVESUSDT.P: Demand Zone Potential
🟣 UNIUSDT.P: Long-Term Trade
🔵 XRPUSDT.P: Entry Zones
🔗 LINKUSDT.P: Follow The River
📈 BTCUSDT.P: Two Key Demand Zones
🟩 POLUSDT: Bullish Momentum
🌟 PENDLEUSDT.P: Where Opportunity Meets Precision
🔥 BTCUSDT.P: Liquidation of Highly Leveraged Longs
🌊 SOLUSDT.P: SOL's Dip - Your Opportunity
🐸 1000PEPEUSDT.P: Prime Bounce Zone Unlocked
🚀 ETHUSDT.P: Set to Explode - Don't Miss This Game Changer
🤖 IQUSDT: Smart Plan
⚡️ PONDUSDT: A Trade Not Taken Is Better Than a Losing One
💼 STMXUSDT: 2 Buying Areas
🐢 TURBOUSDT: Buy Zones and Buyer Presence
🌍 ICPUSDT.P: Massive Upside Potential | Check the Trade Update For Seeing Results
🟠 IDEXUSDT: Spot Buy Area | %26 Profit if You Trade with MSB
📌 USUALUSDT: Buyers Are Active + %70 Profit in Total
🌟 FORTHUSDT: Sniper Entry +%26 Reaction
🐳 QKCUSDT: Sniper Entry +%57 Reaction
📊 BTC.D: Retest of Key Area Highly Likely
📊 XNOUSDT %80 Reaction with a Simple Blue Box!
📊 BELUSDT Amazing %120 Reaction!
📊 Simple Red Box, Extraordinary Results
I stopped adding to the list because it's kinda tiring to add 5-10 charts in every move but you can check my profile and see that it goes on..

EURUSD BULLISH OR BEARISH DETAILED ANALYSISEURUSD has followed our expectations beautifully, bouncing strongly off a key support zone near 1.1270. This zone was previously a tough resistance which the pair broke through, and it’s now acting as a strong demand area. The latest bullish engulfing candle from this region signals solid buying pressure, confirming that bulls are stepping in to protect this structure. I’m now targeting a move toward the 1.17 level, which aligns with the previous high and the next major resistance on the chart.
From a macro perspective, the euro is showing resilience amid recent ECB policy comments, where officials have adopted a cautious but steady tone. Inflation remains persistent enough to delay aggressive rate cuts, keeping EUR demand intact. Meanwhile, the dollar is seeing renewed selling interest as market expectations shift toward a Fed pause, especially after softer US economic indicators including retail sales and jobless claims. This divergence is likely to support further upside in EURUSD.
Technically, this is a classic textbook retest of broken resistance turned support, backed by momentum indicators such as RSI now bouncing from mid-range and MACD showing signs of a potential bullish crossover. Volume has spiked at the support zone, confirming institutional participation. As long as EURUSD holds above 1.1270, I remain bullish and see this move extending toward 1.17 over the coming sessions.
This setup presents a strong risk-to-reward opportunity with momentum aligning with structure. The breakout and retest scenario is fully intact, and fundamentals are now favoring a continuation to the upside. Traders and swing holders should keep this on their radar as EURUSD looks ready to climb further.

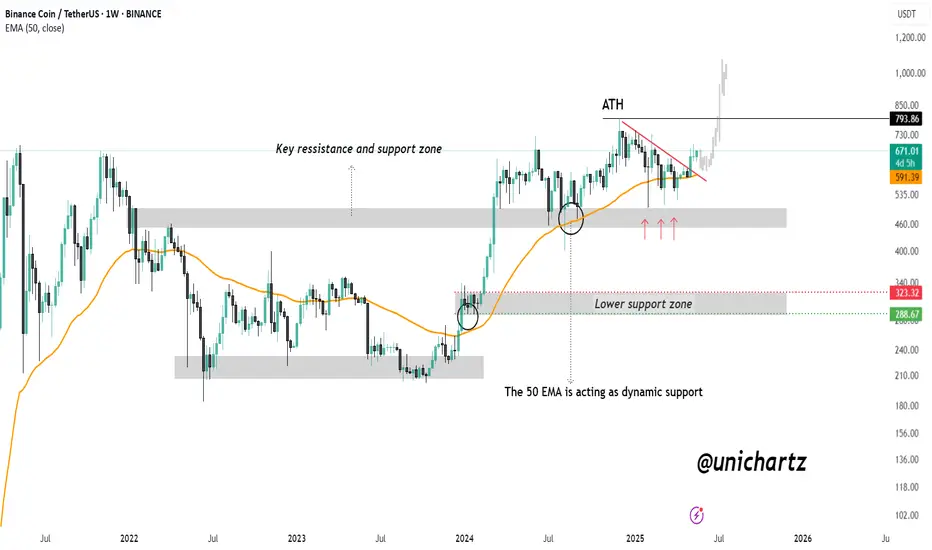
BNB Weekly Breakout: Road to $1,000?CRYPTOCAP:BNB is showing strong bullish momentum on the weekly chart. The 50 EMA is acting as a dynamic support, holding firm during multiple retests and providing a solid foundation for upward movement.
Recently, price action has broken above a key descending resistance line and successfully reclaimed a major support-resistance zone, turning it into a strong base. This area, which previously acted as a battleground for bulls and bears, is now supporting the current rally.
As long as BNB continues to hold above this zone and the 50 EMA, the structure remains bullish. With sustained momentum, a retest of the all-time high zone around $793 is likely, and a breakout above it could open the door for a move toward $1,000 and beyond.
DYOR, NFA
HolderStat┆BNBUSD digesting the wedge breakCRYPTOCAP:BNB shattered a year-long descending wedge, sprinted to 670 USDT, and now forms a pennant atop the 620 neckline. Holding 620 keeps the 700-730 target alive; drop below 600 and price risks sliding back inside the old wedge toward 560. 🔔

BNBUSDT - Big Move Loading….BINANCE:BNBUSDT recently made a clean breakout from a strong resistance level, and since then, it’s been chilling in a tight consolidation range textbook flag formation if you ask us! This kind of local flag pattern often signals a continuation of the previous move, and in BNB’s case, that move was up.
The consolidation phase seems mature now, and price action is starting to show signs of life again. With growing hype around BNB and Binance related developments, momentum could be building for a strong leg up. If things go as expected, the next destination might just be its previous all-time high. 👀
Traders should watch for volume confirmation on the breakout from this flag. A decisive move above the pattern could trigger a sharp rally. But hey as always, don’t forget your stop-loss. Protect your capital and ride the move smartly. Let’s see if BNB is ready to fly again!
BINANCE:BNBUSDT Currently trading at $653
Buy level : Above $655
Stop loss : Below $620
Target : $795
Max leverage 5x
Always keep stop loss
Follow Our Tradingview Account for More Technical Analysis Updates, | Like, Share and Comment Your thoughts
