BNB Binance A perfect Target hit !!!This is as perfect as it gets!!!
The TTR target was hit to the penny!
I took off partial of my long-term holdings here. I will be adding at 340-320 level.
There is a potential of hitting 475+ if the price breaks out above today's high
Bnbanalysis

💡Don't miss the great buy opportunity in BNBBTC %66My friends, I am intensively working on BNB. You can also review my previous analyses regarding BNB. I hold a positive view on BNB. The ecosystem is expanding, the BNB staking in launchpads, Binance's dominance in the sector, and the token burning policy until it drops below 100 million—all these factors are positive for BNB. As you can see, my past predictions have never been wrong. Now, I am expecting a 66% increase with a 5% risk factor. My expectations are actually higher, but this is what I can share with you.

BNBUSDTBased on the given market data, the Binance Coin (BNB) is currently trading at $348 against USDT. The Relative Strength Index (RSI) for 4 hours, 1 day and 7 days are 44.49, 75.01, and 76.11 respectively. This indicates that the coin is in a neutral zone in the 4-hour interval, but is overbought in the 1-day and 7-day intervals.
The Moving Average Convergence Divergence (MACD) for 4 hours, 1 day and 7 days are 1.5, 13.5 and 23.5 respectively. This suggests a bullish trend in the market as the MACD is above zero in all intervals.
The Bollinger Bands (Bb) for 4 hours, 1 day and 7 days are 361.0, 366.0 and 366.0 respectively. The current price is below the middle band in all intervals, indicating a potential upward movement.
The support levels for 4 hours are $344, $331, and $326, whereas for 1 day they are $339, $325 and $304, and for 7 days they are $284, $263 and $222. The resistance levels for 4 hours are $358, $368, and $379, whereas for 1 day they are $367, $378 and $386, and for 7 days they are $367, $401 and $454.
In conclusion, the technical analysis indicates a bullish trend for BNB. However, the overbought conditions suggested by the RSI for 1 day and 7 days might trigger a price correction in the short term. As always, it's essential to consider these indicators in conjunction with other factors and your individual risk tolerance.

Binance Coin still in fourth wave. Looks bullish💰💸💵📈Reviewing the Binance Coin (BNB) against Tether (USDT) chart, it's notable that the Elliott Wave structure points to us currently being in the fourth wave. Correcting the previous analysis, we do not see the completion of the fifth wave but rather the fourth wave, which suggests that the market is in a corrective phase rather than an impulsive final wave push.
The presence of high-volume nodes at lower price levels indicates significant trading interest, which could act as potential support zones for BNB if the price retraces. The areas of liquidity highlighted on the chart (not specified by color) are of particular interest, as they often represent levels where institutional investors might place substantial orders.
Fibonacci retracement levels drawn on the chart serve as technical landmarks for potential reversals or continuation of trends. For instance, the 0.618 retracement level around the 322-325 USD range is a critical area to monitor for potential institutional activity, as reversals often occur at such key Fibonacci levels.
In terms of candlestick formations, large bullish candles with long lower wicks can indicate strong buying interest at lower prices, while long upper wicks can suggest selling pressure at higher price levels. These candlestick patterns, combined with the identified Elliott Wave phase and liquidity areas, help create a narrative around potential smart money actions.
To capture the sentiment of smart money, it's crucial to observe how price reacts upon reaching these significant levels. Any substantial breakout or reversal at these points could signal smart money's influence on the market, providing insights for strategic entry or exit points.
As we continue to observe BNB's price action, we must remain flexible to the market's dynamics and adjust our analysis as new information unfolds, always considering the potential strategies and movements of smart money within the market's structure.

BNB/Binance Technical Analysis and Trade IdeaMarket Context: BNB/Binance has enjoyed a strong bullish run, but monthly timeframe signals point towards the asset being overbought. Additionally, a move into previous highs on teh 1M and 1W charts hint at a possible pullback to the 50-61.8% Fibonacci retracement area. This zone often sees increased liquidity, which could attract long positions from institutional players.
Potential Trade Strategies:
Counter-Trend Short: Consider a short entry around the current price level, placing a stop-loss above the recent highs. Aim for a 1:1 risk-reward ratio on this trade.
Fibonacci Buy: Look for a buying opportunity near the 61.8% Fibonacci retracement level, anticipating potential long positions from larger market participants. Place a stop-loss below the recent swing low and establish target levels as covered in the video.
Disclaimer: The analysis presented reflects my interpretation of market conditions and is intended for educational purposes. It does not constitute financial advice. Before executing any trades, conduct your own comprehensive research and carefully consider your risk tolerance.

BNB very negative scenarioComprehensive Analysis of the Potential Downturn in BNB/USDT: A Bleak Scenario Unfolding
As we delve into the intricate web of factors surrounding the Binance Coin (BNB) and its pairing with Tether (USDT), a comprehensive examination reveals a gloomy outlook that may pave the way for a substantial decline from its current value of $307 to a support line around $47.
The bearish sentiment is deeply rooted in the analysis of a prolonged trading channel, which has played a pivotal role in shaping the recent price action. BNB/USDT has shown signs of exhaustion within this channel, as repeated attempts to breach higher resistances have been met with increasing resistance. This suggests a potential breakdown of the established bullish structure, leading to a significant correction.
A critical aspect adding weight to this negative scenario is the trajectory of the Moving Average Convergence Divergence (MACD) indicator. The MACD line's descent into negative territory signals a waning bullish momentum and a possible shift towards a sustained bearish trend. This decline is indicative of diminishing buying pressure and could precipitate a cascade effect as market participants reassess their positions.
Moreover, the impending breach of key support levels, particularly the $47 mark, could trigger a domino effect of sell-offs. The convergence of technical indicators and the breach of such critical support could catalyze a rapid descent, leading to the aforementioned price target.
In conclusion, the combination of a protracted trading channel, a MACD signaling negative momentum, and the impending breach of crucial support levels paints a bleak picture for BNB/USDT. Traders and investors should exercise caution and consider risk mitigation strategies in the face of these ominous indicators. It is crucial to stay informed and adapt to evolving market conditions, as unforeseen events can swiftly alter the trajectory of any asset.

BNBUSDT POSSIBLE LONG!BINANCE:BNBUSDT.P
in 1D TF its in uptrend ,4H liquidity has been taken and shifted market to the upside.possible long scenario.
ENTRY : 297.27
TP : 317.00
SL : 288.42

BNBBNB is currently forming a symmetrical triangle pattern & BTC dominance is also at support zone try to find some shorts in altcoins with low lev.

BNB BNB has bounce back from 290 (major support) & 300 support area successfully, It can reach its
1st target at 335 & 2nd target at 350 soon. BUT on one condition.
I have already published an idea on it ,Check that out & make sure to follow me.

BNBBNB is currently above the hourly resistance.
We can take long at retest around 310 to 308 zone.
1st target would be at 335 and 2nd at 350.
Stoploss around 303 to 302.
Lev :- 1.5X to 2X

#BNBAfter a correction in the range of 50%, after exiting the density, it can continue the growth with a pullback to the support range until the supply range. At the same time, this correction may continue up to the 23% Fibo range if the support range is broken, which will be the red line range.

Do you like idea...? (BNB)❤️❤️Thanks for boosting 🚀 and supporting us!
📈just live in reality life in real chart😎
🔗 For more communication with us, In the footnote and send a message in TradingView.
👨🎓 Experience and Education: Our trading team has five years of experience in financial markets, especially cryptocurrencies.

analyze BNBif the impulse and correct that i realize will be true the price will take another impulse for a downtrend

What will happen to BNB in the coming days?It's been a while since BNB has a lot of margins.
Have a look at the BNB chart. Price seems to be playing within a diametric.
It looks like it is now completing wave E of this diametric.
From the green range, the D wave can rise again to the ceiling of the D wave to complete the F wave and then fall for the G wave.
We expect such behavior from the price in the coming days

💡Don't miss the great buy opportunity in BNBUSDTAs BNB flirts with a significant resistance trendline, the anticipation of a breakout builds. A decisive close above this level could ignite a rally towards Fibonacci extension levels of 1.272 and 1.414, correlating to a price target around $1200—representing a fivefold gain from the current position. Given Binance's stature as the 'father of the crypto market,' it's plausible to expect a vested interest in bolstering the value of its native coin. Investors should monitor this pivotal movement, as BNB's ascendancy could be a testament to Binance's influence in the crypto ecosystem.
My rigorous and detailed analyses of BNB, visible at my TradingView profile, have historically captured the pulse of its market movements, proving to be successful time and again. With Binance's dominant market role, BNB is on the brink of a potential quintuple surge, as it approaches a pivotal breakout point. My extensive research and careful market scrutiny suggest a strong upside, especially with Binance's vested interest in enhancing the value of its flagship coin.

BNB Short-Term Vision !Hello Guys 🙌
Let me tell you something clearly.
it's not financial advice. it's just my vision of the chart of BNB.USD
I wanna share this vision with you. That's all.
Please read it carefully and tell me what you think.
As you see the main trend is still bearish. because we are under the Komo cloud.
The price is far from Kijun-sen.
As we know the price is so eager to be close to Kijun-sen and because of slowing movement In Kijun-sen, the price should be waiting to reach Kijun-sen.
So, we can expect to reach the price of 225-230 USD and then the next scenario will be activated.
So after that, we have to wait for a negative switch between Tenken-sen and Kijun-sen which can lead to further drops.
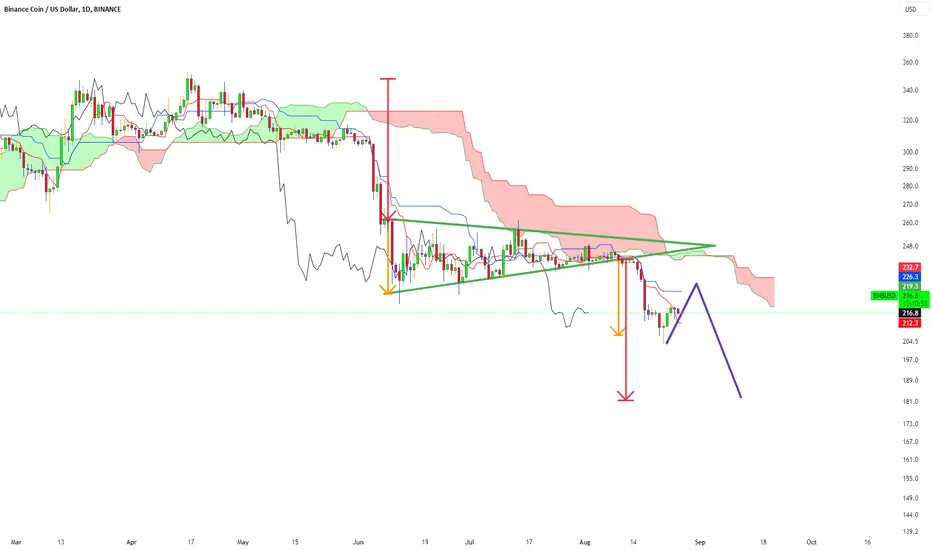
I specified the short-term target. after breaking the triangle to the price we expect to move. we have two targets. the first one is a Yellow arrow and the second one is a Red arrow. (The last swing)
The main support Zone of around 180-185 USD is everything for Binance coin. I hope Binance Coin never loses this zone. if the price loses that, everything will change for Binance coin and all the market.
Do you agree with me?
do you think Binance coin will lose the main support one and drop?
please do not forget to Like, share, and write your comments below the link.
I'm so eager to know what you think.
and what's your favorite movement in Binance coin?
Share your thoughts in the comments 🙏
Don't Forget To Push The Boost (Like) Button and Follow Me for more!
Best Regards , Ho3ein.mnD
BNB(based on NEo wave)I think this complicated correction has 2 ways to show itself, first is bow tie correction and the second is triangle but actually I prefer ETH for holding.

BNB ☁️ - Downside Risk; Rebound In 1 Week? Amidst the current 2% dip, Binance faces clouds ☁️ in the near-term, indicating a potential price correction could be ahead. However, there's optimism on the horizon ☀️ as next week holds the potential for a price rebound, according to ATMMO's insights.
Follow us for more crypto weather reports! 🌦️

BNB Trade Surges: 0.5% Profit Achieved so farFantastic news! Our recent BNB trade has delivered remarkable results, achieving an impressive 0.5% profit. It's a testament to our strategic approach and the power of informed decision-making.
Stay tuned for more exciting opportunities as we continue to navigate the markets with precision and expertise.
Happy trading! 📈💹

BNB's Bull Flag Signals 70k as Next TargetIf we consider this as a potential giant bull flag on the D1 chart, a logical next bullish target for BNB could be set at 70k

BNBUSDT Long ideaBased on my analysis, BNB should start growing from a price of $240. The targets could be $250, $257, and $275. The final target is $275, and the support trend line has now turned into resistance.
⚠️"Daily crypto market analyses I provide are personal opinions & not financial advice. Trading carries risks, so do your own research & seek advisor's help."
Don't forget to like and comment

BNB DEX hypeEntered a long position on $BNB...
Seems like DEX projects are hype atm... See #1inch and #SushiSwap... Even though #Binance isn't the most wanted DEX atm due to all the hiccups, I still expect it to keep up with the others...
Be safe...

BNBUSD Analysis 16July2023if you look at the market structure that has occurred in the past week. where prices cannot form a new LL. the biggest possibility is that the bullish trend will be more dominant. I believe BNB will go to 350, but before heading there, there are several SnDs that must be responded to first. the possibility is that when the price is at 300 there will be a correction before heading to 350.
