BNB WEEKLYHello friends🙌
🔊We are here with BNB analysis:
A long-term analysis that can be viewed as an investment, but in the long term, with patience and capital management...
You can see that after weeks of price suffering, a good upward move has now been formed by buyers, which has also caused a new ceiling to be set. Considering the market decline and the decline of most currencies, you can see that BNB is well supported and its price has suffered.
⚠Now, with the arrival of buyers, you can enter a long-term buy trade with capital management.
🔥Follow us for more signals🔥
*Trade safely with us*
BNBBTC

BNBUSDT Forming Bullish PennantBNBUSDT is showing an impressive breakout pattern that’s catching the attention of crypto investors and traders alike. Binance Coin has consistently proven itself as a top altcoin, and this breakout signals a strong shift in momentum that could push prices higher by 10% to 20% in the short term. The current surge in trading volume supports this bullish scenario, indicating that both retail traders and institutional players are positioning themselves for potential upside gains.
This breakout is not just a technical event — it’s underpinned by BNB’s robust fundamentals. Binance Coin remains one of the most utility-driven tokens in the crypto market, with use cases ranging from transaction fee discounts on the Binance Exchange to staking, launchpad participation, and even DeFi projects. As Binance continues to expand its ecosystem, the demand for BNB is likely to grow, adding fuel to this breakout rally.
For traders, the key is to watch for price stability above the breakout level and look for confirmation signals that the move is backed by sustainable momentum. Managing risk with clear stop-losses and profit targets will be crucial as the market reacts to broader trends and any news from the Binance ecosystem. With the current sentiment positive and buyers stepping in aggressively, BNB could be poised for another leg higher in its long-term uptrend.
✅ Show your support by hitting the like button and
✅ Leaving a comment below! (What is You opinion about this Coin)
Your feedback and engagement keep me inspired to share more insightful market analysis with you!

BNBBTC (Binance Coin vs Bitcoin) New All-Time High & 2026 BullI've been looking at Binance Coin vs Bitcoin and this chart has some pretty interesting dynamics, quite unique I should say. This can be a great opportunity for what is about to happen.
In the last bull market BNBBTC produced massive growth, the most interesting part is the fact that it continued to grow even during the bear market. Not that it lacked during the bull market and then grew during the bear market, but it grew strongly in early 2021 and continued to grow through 2022 while everything was going down. BNBBTC peaked only in November 2022 when Bitcoin hit bottom.
If we get some similar dynamics in this cycle, we can imagine BNBBTC starting to grow now, together with the rest of the market. When the bull market ends, all-time high, Bitcoin is going to 1M+ etc., then BNBBTC continues growing as the bear market unravels. This is because people tend to use BNB to store value and also because trading, market activity and engagement shoots up after the bullish cycle is over. Everybody, their mothers and cousins become professional traders and gamble everything away. This process can take an entire year... When all the money that was earned through the bull market is lost, then we get the bear market bottom and the cycle repeats.
At this point many people will be selling and giving up, but that would only be the start. November 2022 vs November 2026. Ok... That is too far away, let's focus on this present day.
Binance Coin vs Bitcoin, BNBBTC, produced a major low December 2023 and a higher low February 2025. December 2023 marked the end of the bear market for this pair. February 2025 confirms the bearish wave is over; the downtrend is no more.
We have a transition period, consolidation for more than a year. From the bottom we grow.
I am expecting a new all-time high on this pair and this is an easy guess. The only danger Binance was facing came from the previous administration, before Trump. Now that the Cryptocurrency hating crowd is gone, we can aim to the top and beyond. There is no limit to how far up anything Crypto can go. Truly... This is only the start...
It is still early
Notice how some pairs are really high and very advanced on their bullish cycle. Notice how other pairs are still trading at bottom prices. Pairs like this one can be approached easily, with low risk with 5X focused on the long-term. Very low risk with a high potential for reward... Never chase a rising wave. It is better to look for one that is yet to start.
Imagine if you were surfing. Would you be able to join a wave that is already pretty advanced? It can end your life. But if you glide patiently on your board looking around to catch a newly developing wave... It would be an awesome ride and your enjoyment is secure, guaranteed and safe. Catch the early wave.
There are endless opportunities in this market.
Your continued support is appreciated.
Crypto is the future of finance.
Crypto is the evolution of the Internet.
.....
Oh and by the way, the same dynamic I mentioned here between 2021 and 2022, also happened in 2018-2019. This means that there is high probability that BNBBTC will continue growing beyond the 2025 bull market. It is likely to grow during the bear market as well.
There are always several pairs that are used as a hedge. Finding those ahead of time can make a huge difference on how strong your portfolio remains during the bear market. I will be recommending selling though but not 100%. We will be selling around 60-70% and the rest we keep invested regardless of what happens. We are Crypto, we love Crypto and we support he market.
Namaste.

BNBUSDT Forming Bullish Wave BNBUSDT is forming a promising bullish wave pattern that suggests a potential continuation of the upward trend in the short to mid-term. The structure is supported by consistent volume, indicating strong participation and interest from traders and investors. The price action reflects healthy higher lows and higher highs, which typically signal growing bullish momentum. Given the current setup, we can expect a conservative gain of around 10% to 20%+ as the price targets upper resistance zones.
Binance Coin (BNB), being one of the top-tier cryptocurrencies with strong utility across the Binance ecosystem, often benefits from broader market recoveries and exchange-driven demand. With overall crypto sentiment showing resilience, BNB is well-positioned to attract further inflows. The bullish wave pattern being observed could serve as a foundation for the next impulsive move upward, especially if volume continues to support the breakout structure.
The project continues to demonstrate its dominance in both fundamental and technical metrics. As market confidence in leading assets returns, BNB’s role as a utility token and its deflationary mechanisms make it particularly attractive. Technical traders will be watching for a breakout above recent highs to confirm trend continuation, ideally backed by a surge in volume and RSI strength.
BNBUSDT remains a strong candidate for traders looking for stability with upside potential. The confluence of bullish wave formation, increasing interest, and fundamental strength positions it well for a steady rise in price in the coming days or weeks.
✅ Show your support by hitting the like button and
✅ Leaving a comment below! (What is You opinion about this Coin)
Your feedback and engagement keep me inspired to share more insightful market analysis with you!

BNB Pump???On the daily chart of BNB, a symmetrical triangle has formed, and the price is approaching a breakout point. The $600–$604 zone, aligned with the 200-day moving average and the descending trendline, acts as a key resistance. A bullish breakout could push the price toward the $696 area. On the downside, the $575 support is crucial — if broken, the next potential drop could target the $505 zone. Price compression and declining volatility suggest a strong move is likely soon.
📈 A major move is coming for BNB!
🔺 Resistance: $604
🔻 Support: $575 and then $505

BNB tapped the imbalance — and I stepped in.There was no panic here. Just rebalancing.
BNB just dipped into the 0.5 level at 653.28 — right at the base of a 1H FVG and overlapping with a minor demand wick. Most won’t even notice what just happened. But Smart Money sees the shift.
The market provided liquidity for entries without breaking structure.
The 1H OB above — from 657.5 to 661.4 — is now the magnet. It’s unmitigated, and clean.
If price holds this mid-volume shelf and we reclaim above 655.2, I expect rapid delivery into the OB, potentially overshooting for premium distribution into higher inefficiencies.
Execution logic:
Entry zone: 652.9–653.3
Reclaim trigger: above 655.2
TP1: 657.5
TP2: 661.4
SL: below 651.3 (0.618) or tighter under 648.6 (0.786 if aggressive)
You don’t need a breakout.
You need balance — and the discipline to strike when it returns.

BNB/USDT Trade Setup: Bullish Trend, Discount Entry & Fibonacci 📈 BNB/USDT Trade Setup Breakdown 💰🔥
Currently watching BNB / USDT closely... and it's looking interesting! 🧐
BNB has been in a steady, bullish trend with consistent retracements into equilibrium of previous price ranges — offering repeated opportunities to buy at a discount. 📉💸
My bias remains bullish — I'm looking to continue with the trend.
Price has pulled back into my optimal entry zone, you could get long now or wait for a deeper pullback, depending on your personal entry criteria. 🎯
🛡️ Stop-loss goes just below the previous swing low, maintaining tight risk control.
In this video, I break down:
🔹 How I use Fibonacci + Fibonacci extension for precise entries and target zones
🔹 My custom Risk/Reward tool, a variation of the Fib extension.
🔹 Key zones I’m watching, and how I’m managing this setup.
⚠️ Not financial advice. Always do your own research and manage risk accordingly.
💬 Your opinions or feedback? Let me know in the comments 👇

BNB will rest after reaching 1000BNB has successfully bounced back from the support area and heading towards the next resistance which is around 900-1000. This target is easily achievable for BNB since is fundamentally strong and BNB ecosystem is heavily used.
I'm expecting BNB to reach 1000 in 3rd of this year.
Follow Our TradingView Account for More Technical Analysis Updates, | Like, Share and Comment Your thoughts.
Cheers
GreenCrypto

BNBUSDT | Watching the Blue BoxesBNBUSDT is setting up a possible move, and I’ll be watching for an upward break inside the blue boxes .
No need to jump the gun. If price breaks out with volume and confirms on a lower timeframe, that’s where opportunity begins .
“I will not insist on my short idea. If the levels suddenly break upwards and do not give a downward break in the low time frame, I will not evaluate it. If they break upwards with volume and give a retest, I will look long.”
Let others guess. You wait with purpose.
📌I keep my charts clean and simple because I believe clarity leads to better decisions.
📌My approach is built on years of experience and a solid track record. I don’t claim to know it all but I’m confident in my ability to spot high-probability setups.
📌If you would like to learn how to use the heatmap, cumulative volume delta and volume footprint techniques that I use below to determine very accurate demand regions, you can send me a private message. I help anyone who wants it completely free of charge.
🔑I have a long list of my proven technique below:
🎯 ZENUSDT.P: Patience & Profitability | %230 Reaction from the Sniper Entry
🐶 DOGEUSDT.P: Next Move
🎨 RENDERUSDT.P: Opportunity of the Month
💎 ETHUSDT.P: Where to Retrace
🟢 BNBUSDT.P: Potential Surge
📊 BTC Dominance: Reaction Zone
🌊 WAVESUSDT.P: Demand Zone Potential
🟣 UNIUSDT.P: Long-Term Trade
🔵 XRPUSDT.P: Entry Zones
🔗 LINKUSDT.P: Follow The River
📈 BTCUSDT.P: Two Key Demand Zones
🟩 POLUSDT: Bullish Momentum
🌟 PENDLEUSDT.P: Where Opportunity Meets Precision
🔥 BTCUSDT.P: Liquidation of Highly Leveraged Longs
🌊 SOLUSDT.P: SOL's Dip - Your Opportunity
🐸 1000PEPEUSDT.P: Prime Bounce Zone Unlocked
🚀 ETHUSDT.P: Set to Explode - Don't Miss This Game Changer
🤖 IQUSDT: Smart Plan
⚡️ PONDUSDT: A Trade Not Taken Is Better Than a Losing One
💼 STMXUSDT: 2 Buying Areas
🐢 TURBOUSDT: Buy Zones and Buyer Presence
🌍 ICPUSDT.P: Massive Upside Potential | Check the Trade Update For Seeing Results
🟠 IDEXUSDT: Spot Buy Area | %26 Profit if You Trade with MSB
📌 USUALUSDT: Buyers Are Active + %70 Profit in Total
🌟 FORTHUSDT: Sniper Entry +%26 Reaction
🐳 QKCUSDT: Sniper Entry +%57 Reaction
📊 BTC.D: Retest of Key Area Highly Likely
📊 XNOUSDT %80 Reaction with a Simple Blue Box!
📊 BELUSDT Amazing %120 Reaction!
📊 Simple Red Box, Extraordinary Results
I stopped adding to the list because it's kinda tiring to add 5-10 charts in every move but you can check my profile and see that it goes on..

BNBUSDT - Potential SupportWhen my latest BNB analysis() still printing, best trade is the one you make with your profits!
I'm watching BNB, specifically this blue box, where buyers might step in.
If price drops to this zone, I won't trade blindly. I'll look for a breakout above a small resistance level within the box, followed by a retest as support on a lower timeframe. This confirms buyer interest.
I'll also monitor order flow, CDV divergences, and volume spikes for clues. In narrow ranges, watch for liquidity hunts dips below support that quickly recover. Failed breakouts above resistance within the box, or regained levels, are also key.
Remember, I won't insist on a short if price breaks upward with volume and retests that level as support; I'll consider longs. Flexibility and confirmation are crucial.
I hope we reach this blue area to gauge the market reaction. Expect volatility. Missing this setup could be costly. Stay tuned for updates; you can rely on my insights.
📌I keep my charts clean and simple because I believe clarity leads to better decisions.
📌My approach is built on years of experience and a solid track record. I don’t claim to know it all but I’m confident in my ability to spot high-probability setups.
📌If you would like to learn how to use the heatmap, cumulative volume delta and volume footprint techniques that I use below to determine very accurate demand regions, you can send me a private message. I help anyone who wants it completely free of charge.
🔑I have a long list of my proven technique below:
🎯 ZENUSDT.P: Patience & Profitability | %230 Reaction from the Sniper Entry
🐶 DOGEUSDT.P: Next Move
🎨 RENDERUSDT.P: Opportunity of the Month
💎 ETHUSDT.P: Where to Retrace
🟢 BNBUSDT.P: Potential Surge
📊 BTC Dominance: Reaction Zone
🌊 WAVESUSDT.P: Demand Zone Potential
🟣 UNIUSDT.P: Long-Term Trade
🔵 XRPUSDT.P: Entry Zones
🔗 LINKUSDT.P: Follow The River
📈 BTCUSDT.P: Two Key Demand Zones
🟩 POLUSDT: Bullish Momentum
🌟 PENDLEUSDT.P: Where Opportunity Meets Precision
🔥 BTCUSDT.P: Liquidation of Highly Leveraged Longs
🌊 SOLUSDT.P: SOL's Dip - Your Opportunity
🐸 1000PEPEUSDT.P: Prime Bounce Zone Unlocked
🚀 ETHUSDT.P: Set to Explode - Don't Miss This Game Changer
🤖 IQUSDT: Smart Plan
⚡️ PONDUSDT: A Trade Not Taken Is Better Than a Losing One
💼 STMXUSDT: 2 Buying Areas
🐢 TURBOUSDT: Buy Zones and Buyer Presence
🌍 ICPUSDT.P: Massive Upside Potential | Check the Trade Update For Seeing Results
🟠 IDEXUSDT: Spot Buy Area | %26 Profit if You Trade with MSB
📌 USUALUSDT: Buyers Are Active + %70 Profit in Total
🌟 FORTHUSDT: Sniper Entry +%26 Reaction
🐳 QKCUSDT: Sniper Entry +%57 Reaction
📊 BTC.D: Retest of Key Area Highly Likely
📊 XNOUSDT %80 Reaction with a Simple Blue Box!
📊 BELUSDT Amazing %120 Reaction!
📊 Simple Red Box, Extraordinary Results
I stopped adding to the list because it's kinda tiring to add 5-10 charts in every move but you can check my profile and see that it goes on..

BNBUSDT Analysis: Potential Trap at a Regular Support LevelThere is a very regular support level on BNBUSDT, which appears too consistent to be trusted. This kind of setup often acts as a trap for buyers , enticing entries before breaking down.
I plan to go long if the support is broken and price reaches my blue box zone for an optimal entry. This zone represents a strong area of interest where I anticipate a reversal back upward.
Key Points:
Regular support: Likely a trap, avoid premature entries.
Blue box: My buy zone for a potential long position after the support break.
Strategy: Wait for confirmation and enter cautiously within the blue box.
If you think this analysis helps you, please don't forget to boost and comment on this. These motivate me to share more insights with you!
I keep my charts clean and simple because I believe clarity leads to better decisions.
My approach is built on years of experience and a solid track record. I don’t claim to know it all, but I’m confident in my ability to spot high-probability setups.
My Previous Analysis
🐶 DOGEUSDT.P: Next Move
🎨 RENDERUSDT.P: Opportunity of the Month
💎 ETHUSDT.P: Where to Retrace
🟢 BNBUSDT.P: Potential Surge
📊 BTC Dominance: Reaction Zone
🌊 WAVESUSDT.P: Demand Zone Potential
🟣 UNIUSDT.P: Long-Term Trade
🔵 XRPUSDT.P: Entry Zones
🔗 LINKUSDT.P: Follow The River
📈 BTCUSDT.P: Two Key Demand Zones
🟩 POLUSDT: Bullish Momentum
🌟 PENDLEUSDT.P: Where Opportunity Meets Precision
🔥 BTCUSDT.P: Liquidation of Highly Leveraged Longs
🌊 SOLUSDT.P: SOL's Dip - Your Opportunity
🐸 1000PEPEUSDT.P: Prime Bounce Zone Unlocked
🚀 ETHUSDT.P: Set to Explode - Don't Miss This Game Changer
🤖 IQUSDT: Smart Plan
⚡️ PONDUSDT: A Trade Not Taken Is Better Than a Losing One
💼 STMXUSDT: 2 Buying Areas
🐢 TURBOUSDT: Buy Zones and Buyer Presence
🌍 ICPUSDT.P: Massive Upside Potential | Check the Trade Update For Seeing Results
🟠 IDEXUSDT: Spot Buy Area | %26 Profit if You Trade with MSB
📌 USUALUSDT: Buyers Are Active + %70 Profit in Total

Binance Coin (BNB)The world's largest crypto exchange by volume, Binance continues its push into the embattled crypto mining industry with a plan to begin offering a crypto cloud mining product next month. crypto miners have had a tough year, with the price of bitcoin having hung around $20,000 for months, a far cry from its peak above $68,000 in November 2021. Other cryptos have faced similar or even worse declines. One of the largest mining-related firms in the U.S. filed for Chapter 11 bankruptcy in late September. Other companies, however, are seeing opportunity from this crisis, with CleanSpark going on a buying spree of mining rigs and data centers, and DeFi platform Maple Finance starting a $300 million lending pool
Binance Pool announced its own $500 million lending fund for bitcoin miners last week and said it would enter cloud mining, a service that allows investors – who otherwise might not be able to buy and operate their own equipment – to rent crypto mining machines. The official launch of the cloud mining service will come in November.
BNB can back to 300 in a short time but 195 is a good price for entry and long term investment

BNB BUY LIMIT Hello friends
Due to the entry of buyers and the registration of higher ceilings and floors, we can buy in the direction of the trend and with capital and risk management within the specified ranges and move to the specified targets.
*Trade safely with us*

BNB TIME TO BUY?Hello friends
Due to the change in structure and the entry of buyers and the breakdown of the downtrend, we can buy in steps within the specified ranges and move with it to the specified targets, of course with capital and risk management...
*Trade safely with us*

BNB AnalysisBinance Coin (BNB) Analysis – March 30, 2025
In today's analysis, we examine Binance Coin's price movements using the 4-hour timeframe to assess its potential future direction.
🔹 Key Support Levels:
BNB remains above a crucial support range of $607–$593, which has held since March 16. If this support breaks, the price may test $546 as the next reaction level. Further downside could see BNB dropping to $530 and $507 as additional support zones.
🔹 Key Resistance Levels:
On the upside, BNB faces resistance at $637–$644. A confirmed breakout above this zone could push the price toward $700, following the same price range projection method used for support breakdowns.
📌 Outlook:
BNB’s trend remains neutral as long as the key support holds. A break below $593 could trigger a bearish move, while a break above $644 may confirm a bullish trend with $700 as the next target.

BNBUSDT | Key Support & Resistance Zones – Trade With PrecisionThe blue box that I gave as resistance 5 days ago gave 8% profit right from the blue box.
Now I think Red Lines has to should be carefully used for shorts.
🔹 %80 Daily Volume Spike – This means we are dealing with a highly active setup, making it one of the most crucial trades of the day. Smart traders focus on high-volume movers, and that’s exactly why we’re here.
Now, I still stand by my analysis and expect the lower blue box below to act as strong support.
🔴 Short Scenario (Red Line Rejections):
✔️ If price rejects from the red lines with LTF breakdowns, I will look for short opportunities.
✔️ CDV & Volume Footprint Confirmations – We need sellers to step in aggressively before considering entries.
✔️ The market respects precision, not emotions. No confirmation = no trade.
🟢 Long Scenario (Regaining Red Lines):
✔️ If price breaks above the red lines with strong volume and successfully retests them as support, I will switch to a long bias.
✔️ LTF Confirmations Are Key – Without a proper reclaim, there’s no reason to rush longs.
Why My Levels Matter
This isn’t just a random setup—my levels are based on deep market insights that most traders don't even understand. That’s why my success rate speaks for itself.
The market is not a guessing game—it’s a battlefield where only the well-prepared win. I provide the roadmap, it’s up to you to execute.
📌I keep my charts clean and simple because I believe clarity leads to better decisions.
📌My approach is built on years of experience and a solid track record. I don’t claim to know it all but I’m confident in my ability to spot high-probability setups.
📌If you would like to learn how to use the heatmap, cumulative volume delta and volume footprint techniques that I use below to determine very accurate demand regions, you can send me a private message. I help anyone who wants it completely free of charge.
🔑I have a long list of my proven technique below:
🎯 ZENUSDT.P: Patience & Profitability | %230 Reaction from the Sniper Entry
🐶 DOGEUSDT.P: Next Move
🎨 RENDERUSDT.P: Opportunity of the Month
💎 ETHUSDT.P: Where to Retrace
🟢 BNBUSDT.P: Potential Surge
📊 BTC Dominance: Reaction Zone
🌊 WAVESUSDT.P: Demand Zone Potential
🟣 UNIUSDT.P: Long-Term Trade
🔵 XRPUSDT.P: Entry Zones
🔗 LINKUSDT.P: Follow The River
📈 BTCUSDT.P: Two Key Demand Zones
🟩 POLUSDT: Bullish Momentum
🌟 PENDLEUSDT.P: Where Opportunity Meets Precision
🔥 BTCUSDT.P: Liquidation of Highly Leveraged Longs
🌊 SOLUSDT.P: SOL's Dip - Your Opportunity
🐸 1000PEPEUSDT.P: Prime Bounce Zone Unlocked
🚀 ETHUSDT.P: Set to Explode - Don't Miss This Game Changer
🤖 IQUSDT: Smart Plan
⚡️ PONDUSDT: A Trade Not Taken Is Better Than a Losing One
💼 STMXUSDT: 2 Buying Areas
🐢 TURBOUSDT: Buy Zones and Buyer Presence
🌍 ICPUSDT.P: Massive Upside Potential | Check the Trade Update For Seeing Results
🟠 IDEXUSDT: Spot Buy Area | %26 Profit if You Trade with MSB
📌 USUALUSDT: Buyers Are Active + %70 Profit in Total
🌟 FORTHUSDT: Sniper Entry +%26 Reaction
🐳 QKCUSDT: Sniper Entry +%57 Reaction
📊 BTC.D: Retest of Key Area Highly Likely
📊 XNOUSDT %80 Reaction with a Simple Blue Box!
📊 BELUSDT Amazing %120 Reaction!
I stopped adding to the list because it's kinda tiring to add 5-10 charts in every move but you can check my profile and see that it goes on..

BNB/USDT – Bullish Channel Breakout in Play?
#BNB/USDT #Analysis
Description
---------------------------------------------------------------
📉 Pair: BNB/USDT (Binance, 1W Chart)
📊 Analysis by: VectorAlgo
Binance Coin (BNB) has been trading within a well-defined ascending channel, showing strong bullish momentum since mid-2023. The price is currently near the mid-range of the channel and is attempting to push higher.
- Ascending Channel: BNB is trending upwards, respecting both support and resistance levels within this channel.
- Moving Averages: The price is holding above key EMAs, reinforcing bullish sentiment.
- Potential Upside Target: If the trend continues, the next major resistance could be between $900–$1,100.
- Support Levels: If a pullback occurs, watch for support near $500–$550 as a potential buy zone.
Long Entry: Dips into the lower trendline (~$550) could be buying opportunities.
Breakout Play: If BNB clears the mid-channel resistance around $730, a move toward $900+ is likely.
Risk Management: A breakdown below the channel (~$500) could invalidate the bullish setup.
📢 What’s Your Outlook?
Is BNB heading toward new highs, or will we see a deeper pullback? Drop your thoughts below!
---------------------------------------------------------------
Enhance, Trade, Grow
---------------------------------------------------------------
Feel free to share your thoughts and insights. Don't forget to like and follow us for more trading ideas and discussions.
Best Regards,
VectorAlgo

BNB - New Higher High is formingBINANCE:BNBUSDT (1W CHART) Technical Analysis Update
BNB is currently trading at $639 and showing overall bullish sentiment. Price is trading inside the channel and new Higher High is expected to formed soon if this bullish trend continues.
Entry level: $639
Stop Loss Level: $
TakeProfit 1: $685
TakeProfit 2: $750
TakeProfit 3: $850
TakeProfit 4: $900
TakeProfit 5: $999
Max Leverage: 2x
Position Size: 1% of capital
Remember to set your stop loss.
Follow our TradingView account for more technical analysis updates. | Like, share, and comment your thoughts.
Cheers
GreenCrypto

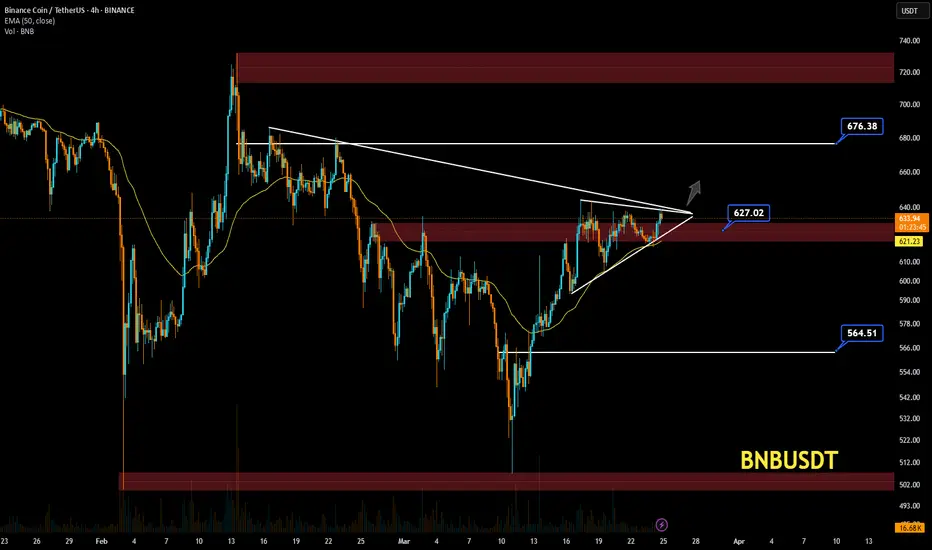
BNBUSD BNBUSD Price Action Analysis – 4H Timeframe 📊🔥
Market Structure:
The chart shows a symmetrical triangle pattern forming, with the price approaching a breakout. 📈🔺
Supply and demand zones are marked with red boxes, indicating key levels for reaction. 🟥
The price is currently testing the $627.02 resistance level. 🚀
Trend Analysis:
A Higher Low (HL) was recently formed at $564.51, maintaining the bullish trend. 🔼
The 50 EMA at $621.21 acts as a strong dynamic support. 📉
Increasing volume suggests a potential breakout. 📊
Key Levels:
Resistance:
The $627.02 - $630 area is a critical supply zone. If broken, the next target would be $676.38. 🎯
A breakout above this level could confirm strong bullish momentum. 🟢
Support:
The $621.21 level, aligning with the 50 EMA, serves as a key support. 📉
If this level breaks, a potential decline toward $564.51 is possible. ⚠️
Possible Scenarios:
🔹 Bullish Case: A confirmed breakout above $627 could push the price toward $676. 🚀
🔹 Bearish Case: Rejection from resistance and a break below $621 may lead to a drop to $564. ❌
📌 Conclusion:
Watching for breakout confirmation before making any decisions. 🔎
Key levels: $627 (resistance) and $621 (support). 📍
Volume and price action will determine the next move. 📊
BNB/USDT:BUY LIMITHello friends
You can see that after the price fell, buyers entered the specified support area and supported the price and created higher ceilings and floors.
Now we can buy at the specified levels with capital and risk management and move to the specified targets.
*Trade safely with us*

BNB/USDT Daily Chart Update. BNB remains inside a descending channel, facing resistance at the upper boundary.
Ichimoku Cloud Resistance: The price is struggling to move above the red Ichimoku Cloud, which may indicate continued bearish pressure.
100MA Rejection: The 100-day moving average (purple line) acts as a strong dynamic resistance.
Bearish Scenario:
If the rejection persists, BNB could drop towards $500-$480, which aligns with the lower channel support.
A confirmed breakdown would extend losses towards $450 and lower.
Bullish Breakout:
A breakout above $663 and the 100MA would increase momentum, potentially targeting $750-$800. A breakout of the descending channel would confirm a trend reversal.
If you found this analysis helpful, hit the Like button and share your thoughts or questions in the comments below. Your feedback matters!
Thanks for your support!
DYOR. NFA

BNB/USDT UPDAEHello friends
With the price drop, we now see that the sellers are gradually failing and the buyers have succeeded in supporting the price.
Now we can buy in stages and with capital management and move towards the specified goals.
*Trade safely with us*
BNXUSDT Breakout Imminent: High Volume Signals Potential 50-60%BNXUSDT is currently forming a strong breakout pattern, showing signs of bullish momentum. The trading volume is increasing, indicating that investors are actively participating in this move. With a solid structure and a breakout looking imminent, BNXUSDT could be set for a significant rally. Traders are closely watching this level, anticipating a strong price surge once the resistance is broken.
Technical analysis suggests that the price is consolidating just below a key breakout point. A successful breakout could trigger a sharp upward movement, with potential gains ranging from 50% to 60%+. The combination of strong volume and market interest further supports this bullish scenario. As the buying pressure builds up, BNXUSDT could soon enter a high-momentum phase, attracting more investors looking for profitable opportunities.
With the crypto market showing increased volatility and potential, BNXUSDT remains a promising asset to watch. Traders and investors are advised to keep an eye on this pair as it moves closer to its breakout zone. A confirmed breakout with sustained volume could validate the anticipated bullish run, offering traders a lucrative upside potential.
✅ Show your support by hitting the like button and
✅ Leaving a comment below! (What is your opinion about this coin)
Your feedback and engagement keep me inspired to share more insightful market analysis with you!
