BNBBTC 1DBNBBTC , This rectangular figure of accumulation could lead BNBBTC to its support of 0.01273 to pull back towards the upper edge of the rectangular figure, before reaching its target . The BNBBTC pair never accumulates for a long time, so it reaches its target.
BNBBTC

BNB (BNB) - October 20Hello?
Welcome, traders.
By "following", you can always get new information quickly.
Please also click "Boost".
Have a good day.
-------------------------------------
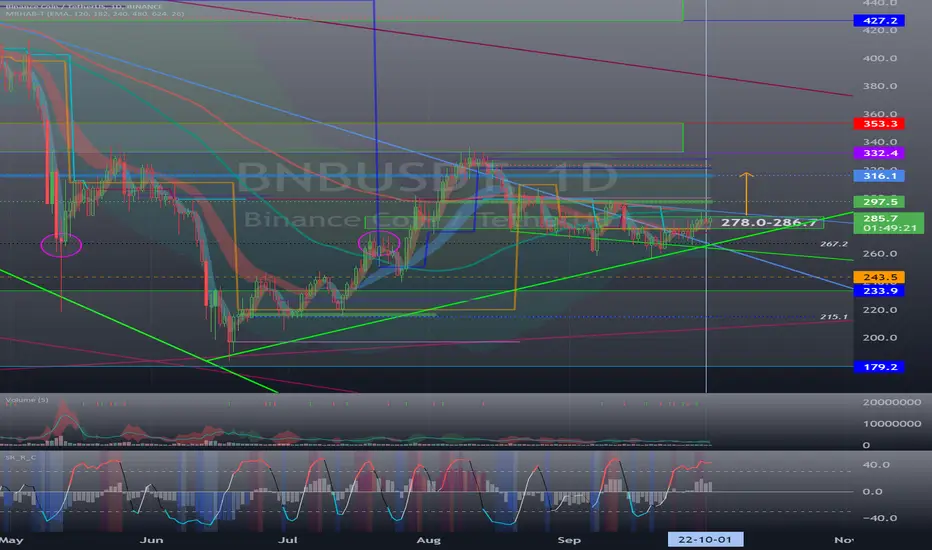
(BNBUSDT 1D Chart)
1st resistance: 297.5-316.1
2nd resistance: 332.4-353.3
Support: 179.2-233.9
From a mid- to long-term investment point of view of BNB coin, I think it is an active buying time when it falls in the range of 179.2-233.9 or less.
Therefore, it is not very good for the price to go sideways instead of falling.
I think that the closer the price to the 179.2-233.9 section, the more likely it will lead to a surge.
BNB also started to converge with the Bollinger Bands (60).
Therefore, if the 278.0-286.7 section is found to be supported, it is highly likely to lead to an attempt to break through the upper Bollinger Bands.
The upper part point spans around 297.5.
------------------------------------------------------------ -------------------------------------------
** All descriptions are for reference only and do not guarantee a profit or loss in investment.
** If you share this chart, you can use the indicators normally.
** The MRHAB-T indicator contains indicators that indicate support and resistance points.
** HA SRRC indicators are expressed as StochRSI(line), RSI(columns), CCI(bgcolor).
** CCI indicator is expressed as overbought range (CCI > +100) and oversold range (CCI < -100).
(Short-term Stop Loss can be said to be a point where profit and loss can be preserved or additional entry can be made through split trading. It is a short-term investment perspective.)
---------------------------------

Binance Coin Analyze☕️(Short term, 10/18/2022)☕️!!!Today I want to invite you to a ☕️cup of coffee☕️ with mark Binance. Do you accept my offer?
It seems that Binance Coin has formed a Cup and Handle pattern in the one-hour time frame. After the failure of the pattern handle, we can expect the growth of Binance Coin to at least PRZ(Price Reversal Zone).
It should be noted that the Cup and Handle pattern is a continuation pattern.
Binance Coin Analyze, ( BNBUSDT ), Timeframe 1H⏰.
Do not forget to put Stop loss for your positions (For every position that you want to open).
Please follow your strategy, this is just my Idea, and I will be glad to see your ideas in this post.
Please do not forget the ✅' like '✅ button 🙏😊 & Share it with your friends; thanks, and Trade safe.

BNB/USDT 1DAY UPDATE BY CRYPTOSANDERSHello, welcome to this BNB/USDT 1 DAY chart update by CRYPTOSANDERS.
I have tried my best to bring the best possible outcome to this chart.
Show some support do hit the like button, follow and comment in the comment section. this motivates me to bring this kind of chart analysis on regular basis.
CHART ANALYSIS :
Binance Coin (BNB)
Binance Coin was well defended by the bulls at the key support of $260. For this reason, it only lost 3.5% of its valuation in the past seven days, and now buyers appear to have the upper hand. The key resistance levels are found at $280 and $300.
It is crucial for BNB not to lose the support at $260 as that would allow the bears to take full control of the price action. Until this point, buyers have remained firm, and they may even attempt a test of the resistance at $280 if market conditions allow it.
This cryptocurrency continues to show strength and resilience despite the turbulent market. This is bullish, and so long the key support does not fall, buyers could take advantage of any weakness from the sell side. Bulls could even take BNB back towards $300, which may become a decisive pivot point on where Binance Coin is headed next.
Sorry for my English it is not my native language.
Hit the like button if you like it and share your charts in the comments section.
Thank you

#BNB/USDT 6Hr UPDATE Hello dear traders, we here new so we ask you to support our ideas with your LIKE and COMMENT, also be free to ask any question in the comments, and we will try to answer all, thank you, guys.
BNB analysis::-BNB was dumped because of the hack and bounced from the support of the $255-$262 area. The local resistance is $278-$280 and $295-$300 area. There is a downtrend line that needs to be broken to get some positive move. Wait for a break above the downtrend line or retest of support for new entries.
Sorry for my English it is not my native language.
Hit the like button if you like it and share your charts in the comments section.
Thank you

Binance Coin - a growth perspective to resistanceAfter successful withdrawal of liquidity and realization of purchases in the zone of interest, the buyer gained a position. But a test of purchases is possible. At the moment, the chart is aiming for the resistance level. The following scenario is possible: after the resistance zone the price will leave to test the buyer, then there will be a logical completion of this formation to open a long position.
If you liked the idea, give it a like. That's the best "Thank you!" for the author 😊
P.S. Always do your own analysis before a trade. Put a stop loss. Fix profits in installments. Withdraw profits in fiat and make yourself and your loved ones happy.

Binance Coin - want to see a healthy resumption of purchases.After the lack of demand at the upper limit of the rand, the price has gone to test the buyer. On a downward move, all supply is absorbed by a strong player. For a further move, you want to see a flat with an exit into a trending move.
If you like the idea, give it a like. That's the best "Thank you!" for the author 😊
P.S. Always do your own analysis before a trade. Put a stop loss. Fix profits in installments. Withdraw profits in fiat and make yourself and your loved ones happy.

Binance Coin Analyze(10/10/2022)!!!Binance Coin moved as I expected 👇✅
Binance Coin was able to break the support line by Bearish Marubozu Candlestick Pattern.
Binance Coin completed the pullback to the support line, and I expect it will go down at least to the support zone.
Binance Coin Analyze, ( BNBUSDT ), Timeframe 4H⏰.
Do not forget to put Stop loss for your positions (For every position that you want to open).
Please follow your strategy, this is just my Idea, and I will be glad to see your ideas in this post.
Please do not forget the ✅' like '✅ button 🙏😊 & Share it with your friends; thanks, and Trade safe.

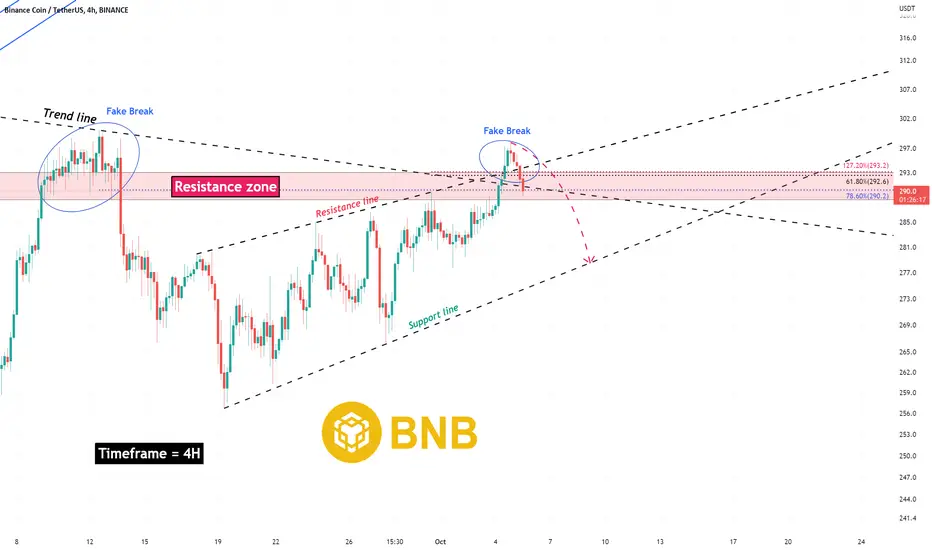
Binance Coin Analyze(10/05/2022)!!!Binance Coin didn't succeed in breaking the resistance zone for 3rd time (Fake break).
I expect Binance Coin will go down at least to the support line.
Binance Coin Analyze, (BNBUSDT), Timeframe 4H⏰.
Do not forget to put Stop loss for your positions (For every position that you want to open).
Please follow your strategy, this is just my Idea, and I will be glad to see your ideas in this post.
Please do not forget the ✅' like '✅ button 🙏😊 & Share it with your friends; thanks, and Trade safe.
BNB Binance - Explosive move soon!
BNB proved to be the strongest high-cap altcoin, and that's why I expect an explosive move if the bulls break the major trendline!
The stock market is crashing pretty strongly, but the crypto market is extremely durable, which is awesome, isn't it?
You probably don't want to buy BNB right now, because we are very close to strong resistance and there is a chance to go lower. First we need to make a new high above 300 USDT.
The chart is printing a descending broadening wedge, a bullish pattern on the daily chart, so it's best to wait for a breakout.
The next major resistance is at the previous all-time high, which is around 692 USDT, but I believe we will go higher in the future.
According to my Elliott Wave analysis, we have started the new uptrend with a pretty strong impulse wave, which is a great sign of strength. A major ABC correction has been completed successfully as well.
The BNBBTC pair is at the new all-time high already, as I informed you in my previous analysis. Also, the BNBETH pair is very bullish.
I expect tremendous gains for selected altcoins (BEL, QNT, INJ, SUSHI). You can find them in the related section down below.
For more analysis, hit "Like" and "Follow"!

BNB CAN MOVE DOWN AGAINI think we can still go lower for the G wave. I expect the correction to continue

BNB is Shit Coin Hello dear traders and my subscribers 👥, please if you like ideas do not forget to support it with your boost 🚀 and tell me coin for a Analysis in comment , thank you so much 🤗

BNBusdt 4H ascending channelWe can see the ascending channel in the 4-hour time frame, if the bottom of the channel is supported, we expect to rise to the top of the channel.
Its not Buy or Sell SIGNAL
DYOR
BY : M.TeriZ - @AtonicShark

BNB Cryptocurrency Behavior 2023👌👌In the analysis I did, I explained the trend of Binance Coin to my friends. In the coming years, the trend of the cryptocurrency has been like this, so if you are watching other analyzes and you are scared, know that it is a new game for the crypto market, be careful.
The negative pages that talk about crypto belong to the institutions and companies themselves.

BNB BEARISH PRICE ACTIONI think, that we will see some bearish downmove from BNB. On the USDT chart we have backtested the Golden POCKET, and one more time the Golden's Golden Pocket+ the chart is forming a RIsing Wedge . My stop loss above the last 4H High. My target is the next 12H OB, what is already in confluence with the HTF Golden Pocket+a fresh untested Daily s/r Level.
+ The full reason of my bearishness, is the BNB/BTC chart, what actually is backtesting the 12H Breaker, and moved up to the Golden Pocket, wherefrom i think will fall to the downside.

Binance Coin - local trend break and weak resumption.At the moment, the chart shows the lack of demand after the breakdown of the trend line.
Possible test of the buyer.
If you liked the idea, please like it. That's the best "Thank you!" for the author 😊
P.S. Always do your own analysis before a trade. Put a stop loss. Fix profits in installments. Withdraw profits in fiat and make yourself and your loved ones happy.

BNB - 1D bullishThe Binance coin can rise more.
A higher low in the weekly chart and double bottom in the 1D timeframe show buyers' power. Also, we had a downtrend line that the price crossed powerfully. There are those three supply zones for taking a profit.

BNB (BNB) - October 3Hello?
Welcome, traders.
By "following", you can always get new information quickly.
Please also click "Boost".
Have a good day.
-------------------------------------
(BNBUSDT 1W Chart)
Whether it can move higher than 332.4 is the key.
(1D chart)
Resistance: 332.4-353.3
If it finds support in the 278.0-286.7 zone, it is expected to move higher than 316.1.
If it falls below 267.2, I expect it to fall below 243.5.
If it falls to the 179.2-233.9 range or less, we expect a good opportunity.
So, if you want to make a mid- to long-term investment, you are expected to get an opportunity to buy.
Even if you proceed with the purchase, you should always have about 20% of your total cash in hand.
The basic thing to follow in trading is to buy in installments when the price shows support as the price declines and sell in installments when the price shows resistance when the price rises.
Occasionally, there is a way to buy when an important point or section breaks upwards.
------------------------------------------------------------ -------------------------------------------
** All descriptions are for reference only and do not guarantee a profit or loss in investment.
** If you share this chart, you can use the indicators normally.
** The MRHAB-T indicator contains indicators that indicate support and resistance points.
** SR_R_C indicators are displayed as StochRSI(line), RSI(columns), CCI(bgcolor).
** CCI indicator is expressed as overbought range (CCI > +100) and oversold range (CCI < -100).
(Short-term Stop Loss can be said to be a point where profit and loss can be preserved or additional entry can be made through split trading. It is a short-term investment perspective.)
---------------------------------
Binance Coin (BNB) - will the buyer bring the case to its logica A coin that wants to appear stronger than the market. On the daily timeframe we see a reversal formation. No offer, zero point spring with a test and subsequent transition into a trend movement. It looks interesting, observe.
If you liked the idea, please like it. That's the best "Thank you!" for the author 😊
P.S. Always do your own analysis before a trade. Put a stop loss. Fix profits in installments. Withdraw profits in fiat and make yourself and your loved ones happy.

bnb/btc possible bearish tradein the daily chart we have a rising wedge and a bearish divergence in the monitor

BNBUSDT Trend Continuation.BNBUSDT Technical analysis update
Buy zone : $282 - $290
Stop loss : $264
TP 1 : $307
TP 2 : $334
TP 3 : $360
Always keep stop loss
Thanks
Hexa

BNBusdt 12H S&R UpdateAccording to the previous analysis, I updated the support and resistance ranges that you can see in the chart.
Its not Buy or Sell SIGNAL
DYOR
BY : M.TeriZ - @AtonicShark

BNBBTC SHORT IDEABNBBTC reached the top of the channel, if from the actual 12h Bullish OB becomes a Breaker, than that can gives for us a good short opportunity.
Stop loss is above the highs.
TP 1 can be the bottom of the channel
TP 2 is between the Daily level+the 0.882 FIB SPEED FAN.
