BNB Binance Coin short Entry Range, Take Profits and Stop LossBNB/USDT short
Entry Range: $287 - 301
Price Target 1: $270
Price Target 2: $256
Price Target 3: $229
Stop Loss: $330
BNBBTC

#BNB/USDT 4Hr UPDATE !!
Hello, dear traders welcome you to this BNB/USDT chart analysis.
Hello dear traders, we here new so we ask you to support our ideas with your LIKE and COMMENT, also be free to ask any question in the comments, and we will try to answer for all, thank you, guys.
#BNB/USDT ANALYSIS:-As we can see from the above-mentioned chart BNB is currently trading on a support zone of the triangle pattern.
Here BNB needs to bounce to break this triangle pattern and enter a bullish mode.
Candles close below will lead BNB again towards its lowest levels.
Remember:-This is not a piece of financial advice. All investment made by me is at my own risk and I am held responsible for my own profit and losses. So, do your own research before investing in this trade.
Thanks for your time, we hope our work is good for you, and you are satisfied, we wish you a good day and big profits.
THANK YOU.

BNB (BNB) - May 31hello?
Traders, welcome.
By "following", you can always get new information quickly.
Please also click "Like".
Have a good day.
-------------------------------------
(BNBUSDT 1W Chart)
Resistance: 332.4-353.3
1st support: around 296.0
Second support: 165.7-210.2
In order to continue the upward trend from the current position to the mid- to long-term point, it needs to rise above 353.3 to receive support.
(1D chart)
If it finds support above 319.1, I expect it to turn into an uptrend in the short-term and medium-term perspective.
However, since the 332.4-353.3 section is a support and resistance section, it is important to check whether it rises above this section.
(buying)
- After confirming the support in the section 332.4-353.3
(Stop Loss)
- When it falls below 319.1 and receives resistance
- When it falls below 287.7
(Sell)
- When receiving resistance in the section 428.9-463.6
- When receiving resistance in the section 524.0-564.3
BNB Coin is one of the most successful exchange coins.
Accordingly, I think that BNB coin is a coin that can be invested for a long time from a mid- to long-term point of view.
However, due to the volatility of the coin market, making mid- to long-term investments with the purchase principal incurs significant risks.
Therefore, I believe that long-term investments should be continued in the direction of increasing the amount of holdings that correspond to profits.
------------------------------------------------------------ -----------------------------------------------------
** All indicators are lagging indicators.
Therefore, it is important to be aware that the indicator will move accordingly as price and volume move.
However, for the sake of convenience, we are talking in reverse for the interpretation of the indicator.
** The MRHAB-T indicator used in the chart is an indicator of our channel that has not been released yet.
** The OBV indicator was re-created by applying a formula to the DepthHouse Trading indicator, an indicator disclosed by oh92. (Thanks for this.)
** Support or resistance is based on the closing price of the 1D chart.
** All descriptions are for reference only and do not guarantee a profit or loss in investment.
(Short-term Stop Loss can be said to be a point where profit and loss can be preserved or additional entry can be made through split trading. It is a short-term investment perspective.)
---------------------------------

#BNB/USDT 4Hr UPDATE !Hello, dear traders welcome you to this BNB/USDT 4Hr chart analysis.
Hello dear traders, we here new so we ask you to support our ideas with your LIKE and COMMENT, also be free to ask any question in the comments, and we will try to answer for all, thank you, guys.
BNB/USDT ANALYSIS:-BNB/USDT tringle pattern break upside and the regression level downside break and retest the triangle pattern. and 2nd regression level is $326.
in BNB/USDT break the $316 and support level $275.
Remember:-This is not a piece of financial advice. All investment made by me is at my own risk and I am held responsible for my own profit and losses. So, do your own research before investing in this trade.
Thanks for your time, we hope our work is good for you, and you are satisfied, we wish you a good day and big profits.
THANK YOU.

BNB/USDT Bear and Bull RoadMap ( Price Predictions in HTF )#BNB/USDT Technical Overview:-
$BNB currently trading at $326
And trading in Parallel Channel which Top is $390 ( Resistance)
So If Upward side move then we can see max $390-$400
That will be best Exit Point if Price Goes up.
But Overall Long View is Bearish.
2023 will be best Accumulation Zone for BNB Lovers.
As Per Fin Retracement 0.5 Fib Level is $160 and 0.6 Fib Level is $113
So Mostly in Crypto 0.618 and 0.786 worked for Retracement level.
So 0.7 Fib level is $69.60
So As per my analysis I am expecting best Buy under $100 ( Maybe Long Wick for Liquidate Long Positions)
⛔️ Above Parallel Channel Resistance Bearish Chart Invalidated ( But Weekly candle must Close above Parallel Channel Resistance Line.
Keep it Simple:-
Best Entries:-
1st Entry :- $115
2nd Entry :- $70
I am Not Expecting BNB will go Under $50
Year 2020 Accumulation Area = $7-$38
But Keep in Mind:- I will Buy More BNB at Bottom or Dip ( Mean Under $100 if Price go below $100 )
Long Term My Target For BNB/USD is $3000-$5000
This is Not Financial Advice.
Do your Own Research Before Invest in Any Coins.
Thank you.
If you Love My Work then Please Like Share And Appreciate.

Binance Coin Peaked vs Bitcoin?On the chart above I highlighted multiple bearish candles...
The last one is very telling with increasing volume to break below EMA10, EMA50 and EMA21.
This can lead to lower prices...
Binance removed RSRBTC without notice.
Even removed it from the delisting page... Money gone, no excuses, no explanation, no warning, no reason, no time to prepare...
The same with other pairs.
I withdrew all of my Bitcoins from this exchange.
Very bad for business I guess.
Namaste.

BNB/USDT now In good Profit ( 14% up without Leverage )#BNBUSDT Inverted H&S Chart:-
- #BNB now 13% Up and Very close to our 1st TP
- Breakout + Retest + TP = ✅
- Still Upward Targets expecting
- Move Stop Loss to $299
Hope You happy with Profit and My analysis.

#BNB/USDT DAILY UPDATE BY CRYPTOSANDERS As I mentioned in my previous chart that there is not much change to watch on this daily time frame, BNB is still trading above the support area which is $293, and the Fibonacci Retracement Label support area at $280. There has been a bounce and the first resistance label is $360
This is not a piece of financial advice.
Then, hit the like button and share your chart in the comments section if you like it.
Thank you.

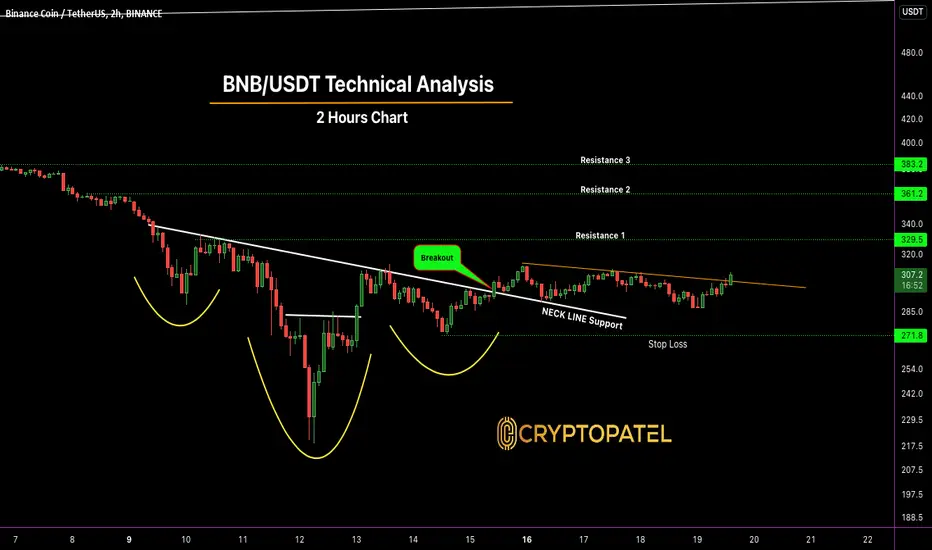
BNB/USDT now in Good profit and What next?#BNBUSDT Inverted H&S Chart:
- #BNB Bullish Entry was $292✅
- Breakout + Retest =✅
- I am expecting a Bullish Upward Move
- Targets = $329/$361/$383
- Strict Stop Loss = $271
Like and share if you are also in Profit.
#BNB/USDT DAILY UPDATE !!Hello, members and welcome to this BNB/USDT quick chart analysis.
As I mentioned in my previous chart that there is not much change to watch on this daily time frame, BNB is still trading above the support area which is $293 and Fib Retracement Label support area at $280 and The first resistance label is $360
This is not a piece of financial advice.
Then, hit the like button and share your chart in the comment section if you like it.
thank you.

05/16/2022 Pre Market ThoughtsMacro: Bearish
Micro: High Bullish Potential
I am more bullish than bearish currently.
I would like to see a start in APPL above 148.75. I think that can take us to 162 at the top. I think if Appl breaks though, we could see others like Carvana and Bill go up 30% to their respective supports.
I outline more of the specifics in the video.
I hope you all are doing well.

Binance Coin Looking bullish because Head & Shoulder Pattern#BNBUSDT Inverted H&S Chart:-
- In LTF #BNB is bullish chart (1H)
- Breakout + Retest = ✅
- I am expecting Bullish Upward Move
- Targets = $329/$361/$383
- Strict Stop Loss = $271
This is One Hours Scalp Chart Update.
And I am expecting good upward move.
But don't forget to place stop loss because the market is very volatile.

#BNB/SDT 1HOUR UPDATE !!Hello, dear traders welcome you to this BNB/USDT 1hr chart analysis.
I have tried my best to bring the best possible outcome in this chart.
Hello dear traders, we here new so we ask you to support our ideas with your LIKE and COMMENT, also be free to ask any question in the comments, and we will try to answer for all, thank you, guys.
BNB/USDT triangle pattern breakout confirm and retest and buy the dip green zone
entry:-$293,$305
target :-30% to 40%
stoploss:-$281
Thanks for your time, we hope our work is good for you, and you are satisfied, we wish you a good day and big profits.
THANK YOU.

BNBUSDT◻️BNB holding up...noo....
◻️If you take it apart from the technical side: We have a level, $230...when pinning below, the target is $115.
◻️ Looks very weak. There was a test of the $230 level, already 3 times. I would go short if we test the $230 level from the back side at 4 hours.
💡 Take a 5% deposit into the deal.
◻️Stop loss? when closing a daily candle below the level of $230, you can set a stop loss of $250
🔥Subscribe to my Tradingview profile

#BNB/USDT DAILY UPDATE BY CRYPTOSANDERS!!Hello, members and welcome to this BNB /USDT quick chart analysis.
In the current scenario, BNB is heading towards the lower support area of $270
As per the current scenario, if BNB holds the $294 level, we could see a rally from that level.
Now, IMO we should sit aside from the market until there is a bullish divergence.
This is not a piece of financial advice.
Then, hit the like button and share your chart in the comment section if you like it.
Thanks.

#BTC/USDT DAILY UPDATE BY CRYPTOSANDES. Hello, members and welcome to this BTC /USDT quick chart analysis.
As I mentioned in my previous chart that is Nothing much change to see at this daily time frame BTC is still trading above the support zone which is $29k - $29.5k.
This is not a piece of financial advice.
Then, hit the like button and share your chart in the comment section if you like it.
thank you.

BNBBTC possible reach top for this move || BNBBTC SHORT Maybe BNB here already find top and ready for move down.
Can see some Elliott wave possible count for missing C of this correction.

#BNB/USDT DAILY UPDATE BY CRYPTOSANDERS!!Hello, members and welcome to this BNB /USDT quick chart analysis.
In the current scenario, BNB is heading towards the lower support area of $260
As per the current scenario, if BNB holds the $270 level, we could see a rally from that level.
Now, IMO we should sit aside from the market until there is a bullish divergence.
This is not a piece of financial advice.
Then, hit the like button and share your chart in the comment section if you like it.
Thanks.

BNB (BNB) - May 12hello?
Traders, welcome.
If you "follow", you can always get new information quickly.
Please also click "Like".
Have a nice day.
-------------------------------------
(BNBUSDT 1W Chart)
332.4 or higher: Expected to create a new wave.
210.2 or higher: It is expected that the upward trend will continue in the mid- to long-term.
(1D chart)
We need to check if we can form a strong support section by going sideways in the 210.2-332.4 section.
Also, it is good to see support by rising above 332.4-353.3.
(buy)
- After confirming the support in 353.3
(Stop Loss)
- When it falls below 332.4 and receives resistance
(Sell)
- When receiving resistance in the section 428.9-463.6
- When receiving resistance near 524.0
(buy)
- After confirming the support in 239.7
(Stop Loss)
- When it falls below 210.2
(Sell)
- When resistance near 332.4
- When receiving resistance in the section 428.9-463.6
------------------------------------------------------------ -----------------------------------------------------
** All indicators are lagging indicators.
Therefore, it is important to be aware that the indicator will move accordingly as price and volume move.
However, for convenience, we are talking in reverse for the interpretation of the indicator.
** The MRHAB-T indicator used in the chart is an indicator of our channel that has not been released yet.
** The OBV indicator was re-created by applying a formula to the DepthHouse Trading indicator, an indicator disclosed by oh92. (Thanks for this.)
** Support or resistance is based on the closing price of the 1D chart.
** All descriptions are for reference only and do not guarantee a profit or loss in investment.
(Short-term Stop Loss can be said to be a point where profit and loss can be preserved or additional entry can be made through split trading. It is a short-term investment perspective.)
---------------------------------

#BNB/USDT UPDATE BY SANDERS!Hello, welcome to this BNB /USDT 4Hr chart update by CRYPTOSANDERS.
I have tried my best to bring the best possible outcome to this chart.
Show some support do hit the like button, follow and comment in the comment section. this motivates me to bring this kind of chart analysis on regular basis.
CHART ANALYSIS:-
In the above-mentioned chart, it is evident that BNB is trading inside the channel pattern for many days and bounced four times from the lower trend line support.
Currently it bounced from the lower trend line and is trading in a support zone.
Here I am expecting a bounce and break to this channel pattern for a short-term bullish rally.
If it breaks the support zone then this chart will be invalidated.
This is not a piece of financial advice.
Sorry for my English it is not my native language.
Do hit the like button if you like it and share your charts in the comments section.
thank you.

BNB (BNB) - May 3hello?
Traders, welcome.
If you "follow", you can always get new information quickly.
Please also click "Like".
Have a nice day.
-------------------------------------
(BNBUSDT 1W Chart)
Support: 365.6-410.1
You need to see if you can move up along the uptrend line.
(1D chart)
To turn into an uptrend, it must move above 410.1.
Therefore, it is important to see the transition to an uptrend.
There is a possibility that a whip saw may occur in the 428.9-437.2 section, so careful trading is required.
A decline below 332.4 is likely to turn into a downtrend in the medium to long term.
(buy)
- After confirming the support in 383.9
(Stop Loss)
- When it is resisted by falling below 365.6
- When it falls below 332.4
(Sell)
- When receiving resistance near 463.6
- When receiving resistance near 543.7
(buy)
After confirming the support at -410.1
(Stop Loss)
- When it falls below 383.9 and receives resistance
- When it falls below 365.6
(Sell)
- When receiving resistance near 463.6
- When receiving resistance near 543.7
------------------------------------------------------------ -----------------------------------------------------
** All indicators are lagging indicators.
Therefore, it is important to be aware that the indicator will move accordingly as price and volume move.
However, for convenience, we are talking in reverse for the interpretation of the indicator.
** The MRHAB-T indicator used in the chart is an indicator of our channel that has not been released yet.
** The OBV indicator was re-created by applying a formula to the DepthHouse Trading indicator, an indicator disclosed by oh92. (Thanks for this.)
** Support or resistance is based on the closing price of the 1D chart.
** All descriptions are for reference only and do not guarantee a profit or loss in investment.
(Short-term Stop Loss can be said to be a point where profit and loss can be preserved or additional entry can be made through split trading. It is a short-term investment perspective.)
---------------------------------

#BNB/USDT 4HOUR UPDATE BY CRYPTOSANDERSHello, welcome to this BNB/USDT 6hour chart update by CRYPTOSANDERS.
Show some support do hit the like button, follow and comment in the comment section. this motivates me to bring this kind of chart analysis on regular basis.
CHART ANALYSIS: -
BNB/USDT currently trading inside the Symmetrical triangle pattern and on the support green zone .
There is a high chance to bounce from this strong support green zone all the way to 10% TO 15%.
Q:-What do you think about this?
Do you think we will see a new ATH of BNB/USDT in the next quarter?
Share your views in the comment section.
Remember:-This is not a piece of financial advice. All investment made by me is at my own risk and I am held responsible for my own profit and losses. So, do your own research before investing in this trade.
Happy trading.
Sorry for my English it is not my native language.
Do hit the like button if you like it and share your charts in the comments section.
Thank you.

BNBUSDT is trading into Rising Wedge BNBUSD is in a range bound, and the beginning of an uptrend is expected.
As you can see the BNB after last drop to below $400 is formed Rising Wedge pattern and i think it could will continue move upward toward upper resistance trend line pattern at around $440 ~ $460 in the coming 2 weeks but before that There is a possibility of temporary retracement to the suggested support line around $390 ~ 395.0.
The RSI daily is at 54
SL= Break below $388
