#BNB BullishRising Trendline is holding for so long.
Falling Trendline is close to breakout.
Send BNB To #500
BNBBTC

BNB 1H Resistance/SellBNB 1H resistance is at ~$402
Enter 50% at the current price
and try to set some sell orders near the resistance zone
If BNB stays below the trendline,
the Take-Profit target would be 5%, 10%, and 15% from your entry
Cheers

BNBUSDT, Can not broke resistanceHello everyone
According to the chart and as you can see the condition of all financial markets, the price of BNB accept the condition of market and from months ago the price is moving is downward trend and according to the trend the price wanna make new LL.
We expect the price can continue this movement and as you can see the price can not broke the trendline resistance the chance for droping is going more to be happen this.
We have some advice for everyone that is working and trading in this market : Go and save your money and be ready to tell you when its time to buy buddy
Be lucky guys
Abtin
Previous analysis :

Binance Coin Cup & HandleWe are having a strong breakout today after BNBBTC found support right above EMA50/EMA100.
This comes after a cup & handle pattern.
This opens the door for additional growth.
Namaste.

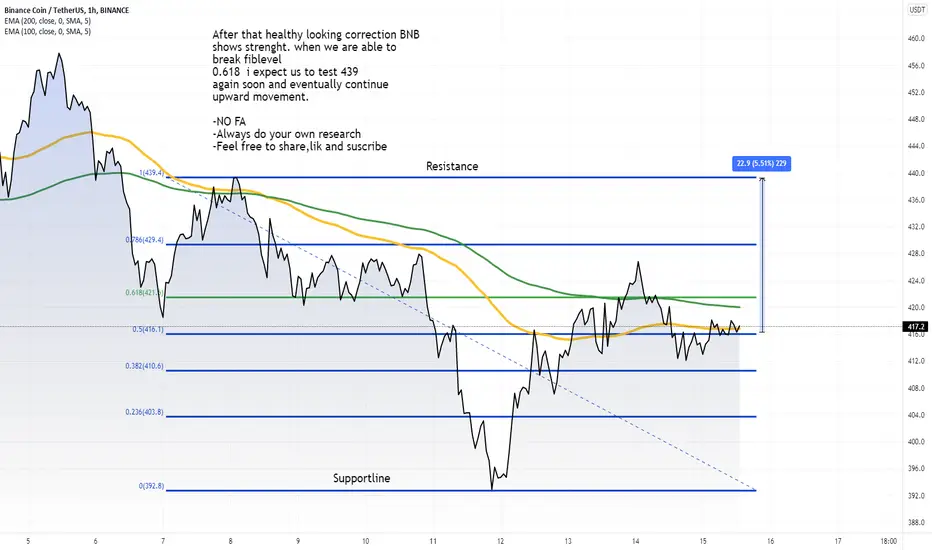
BNB After that healthy looking correction BNB
shows strenght. when we are able to
break fiblevel
0.618 i expect us to test 439
again soon and eventually continue
upward movement.
.
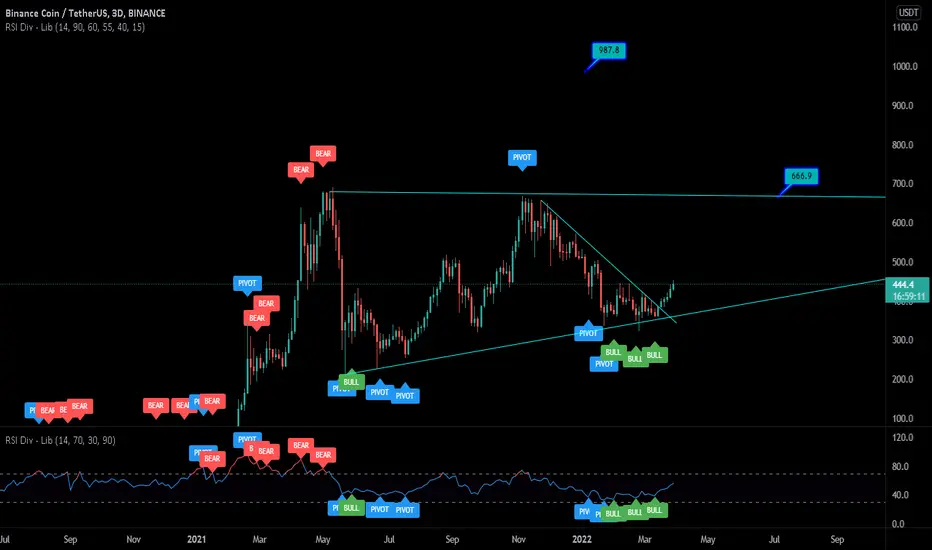
BNB possible future trend...Nothing special to say... Simplicity boils down to two steps: Identify the essential. Eliminate the rest.
BINANCE:BNBUSDT

BNB (BNB) - April 14hello?
Traders, welcome.
By "following", you can always get new information quickly.
Please also click "Like".
Have a nice day.
-------------------------------------
(BNBUSDT 1W Chart)
Support: 365.6-410.1
(1D chart)
(buy)
- After confirming the support in 410.1
(Stop Loss)
- When it falls below 383.9 and receives resistance
- When it falls below 332.4
(Sell)
- When receiving resistance near 463.6
- When receiving resistance in the section 524.0-564.3
There is a possibility that a whip saw may occur near the 428.9-437.2 section, so careful trading is required.
A move above 524.0 is expected to result in a sharp move.
------------------------------------------------------------ -----------------------------------------------------
** All indicators are lagging indicators.
Therefore, it is important to be aware that the indicator will move accordingly as price and volume move.
However, for the sake of convenience, we are talking in reverse for the interpretation of the indicator.
** The MRHAB-O and MRHAB-B indicators used in the chart are indicators of our channel that have not been released yet.
(Since it was not disclosed, you can use this chart without any restrictions by sharing this chart and copying and pasting the indicators.)
** The wRSI_SR indicator is an indicator created by adding settings and options to the existing Stochastic RSI indicator.
Therefore, the interpretation is the same as the traditional Stochastic RSI indicator. (K, D line -> R, S line)
** The OBV indicator was re-created by applying a formula to the DepthHouse Trading indicator, an indicator disclosed by oh92. (Thanks for this.)
** Support or resistance is based on the closing price of the 1D chart.
** All descriptions are for reference only and do not guarantee a profit or loss in investment.
(Short-term Stop Loss can be said to be a point where profit and loss can be preserved or additional entry can be made through split trading. It is a short-term investment perspective.)
---------------------------------

#BNB/USDT 2DAY UPDATE BY CRYPTOSANDERS#BNB/USDT 2day analysis in the chart
I have tried my best to bring the best possible outcome in this chart.
Hello members welcome to BNB/USDT 2D chart update by CRYPTOSANDERS.
First hit the like button and follow me, this motivates me to bring this kind of regular chart analysis.
As we can see from the above-mentioned chart that BNB/USDT broke the symmetrical triangle pattern and currently moving down to retest the upper trend line, for the bull trend we need a retest so we should wait for confirmation.
If it broke down the lower trend line and moves back inside then this chart will be invalidated.
This is not a piece of financial advice.
Sorry for my English it is not my native language.
Do hit the like button if you like it and share your charts in the comments section.
thank you.

BNB 1D BUYBNB 1D support is at ~$395
Enter 50% here
and try to set some buy orders near the support zone
If BNB holds above the trendline,
the Take-Profit target would be $456, $489, and $536
Cheers

BNB short Price Targets and Stop LossBNB/USDT short
Entry Range: $415 - 440
Price Target 1: $390
Price Target 2: $366
Price Target 3: $340
Stop Loss: $460
previews chart


BNB (BNB) - March 26Hello?
Traders, welcome.
If you "follow", you can always get new information quickly.
Please also click "Like".
Have a good day.
-------------------------------------
(BNBUSDT 1W Chart)
Resistance: 632.6-674.1
Support: 341.7-383.3
(1D chart)
We need to see if an attempt can be made to ascend above the 463.6 point.
In particular, you need to make sure you can move up along the rising channel.
A move above the 463.6 point is expected to turn into an uptrend.
1 and 2 are marking highs, so we expect resistance.
-------------------------------------
(BNBBTC 1W Chart)
Resistance: 0.012203-0.012947
Support: 0.006995-0.007739
It is necessary to check whether there is movement out of the range 0.009135-0.009971.
In particular, you need to make sure you can get out of the bearish channel.
------------------------------------------------------------ -----------------------------------------------------
** All indicators are lagging indicators.
Therefore, it is important to be aware that the indicator moves accordingly with the movement of price and volume.
However, for convenience, we are talking in reverse for the interpretation of the indicator.
** The MRHAB-O and MRHAB-B indicators used in the chart are indicators of our channel that have not been released yet.
(Since it was not disclosed, you can use this chart without any restrictions by sharing this chart and copying and pasting the indicators.)
** The wRSI_SR indicator is an indicator created by adding settings and options to the existing Stochastic RSI indicator.
Therefore, the interpretation is the same as the traditional Stochastic RSI indicator. (K, D line -> R, S line)
** The OBV indicator was re-created by applying a formula to the DepthHouse Trading indicator, an indicator disclosed by oh92. (Thanks for this.)
** Support or resistance is based on the closing price of the 1D chart.
** All descriptions are for reference only and do not guarantee a profit or loss in investment.
(Short-term Stop Loss can be said to be a point where profit and loss can be preserved or additional entry can be made through split trading. It is a short-term investment perspective.)
---------------------------------

Binance Coin #BNB/USDT 300% Potential from here#BNB/USDT TA Update:-
$BNB currently trading at $400
And bounced back from $350 support
Now..?
As per chart Now I am expecting updates move from here.
$350-$400 could be best accumulation zone.
If $BNB hold $350 level then we can see again New All tile high.
Targets:- $507/$667/$1004/$1511
Stop Loss:- Exit below $350
Already break out Resistance and Retest is also done.

#BNB/USDT 4HOUR UPDATE BY CRYPTOSANDERSWelcome to this quick BNB/USDT analysis in the chart
I have tried my best to bring the best possible outcome in this chart.
Hello members, welcome to our BNB/USDT quick 4hr update.
As we can see in the above-mentioned chart that BNB created an inverse HEAD & SHOULDER PATTERN and broke the neck Line and retested AND bounced right from the green zone which was the zone to go long.
This is not a piece of financial advice.
Sorry for my English it is not my native language.
Do hit the like button if you like it and share your charts in the comments section.
thank you.

BNB - best Trade idea for dear Tradingview communityBNB - best Trade idea for dear Tradingview community

#BNB/USDT WEEKLY UPDATE BY CRYPTOSANDERSWelcome to this quick BNB/USDT analysis.
I have tried my best to bring the best possible outcome in this chart.
Hello members, welcome to our BNB/USDT quick update.
Here at the above-mentioned chart, we can see that BNB is trading inside the channel in a green zone for the last five weeks.
One week back it bounced from the support level or the lower trend line.
Now it's trading above the green zone which Is the indication of an uptrend in BNB for upcoming days.
so we can take a position in BNB on the spot or low leverage for a few weeks which will be beneficial for us in the upcoming weeks.
Remember:-This is not a piece of financial advice. All investment made by me is under my own risk and I am held responsible for my own profit and losses. So, do your own research before investing in this trade.
Happy trading.
Sorry for my English it is not my native language.
Do hit the like button if you like it and share your charts in the comments section.
Thank you...

BNBUSDT-LONGBased on technical factors there is a long position in :
📊 BNBUSDT Binance Coin
🔵 Long Now 397.0
🧯 Stop loss 373.0
🏹 Target 1 408.0
🏹 Target 2 432.0
🏹 Target 3 475.0
💸Capital : 1%
We hope it is profitable for you ❤️
Please support our activity with your likes👍 and comments📝

BINANCECOIN Break TrendLineBNBUSDT It has already broken the bearish trend line in the support range, Now if stabilized, could reach the $ 430 target and with the further support of buyers up to $ 520. If the support range is broken, the analysis is updated.
Its not Buy or Sell SIGNAL
DYOR
BY : Mohamad Teriz - @AtonicShark

#BNB/USDT 2HOUR UPDATE BY CRYPTOSANDERSWelcome to this quick BNB/USDT 2hour analysis.
I have tried my best to bring the best possible outcome in this chart.
Hello members welcome to our BNB/USDT quick update
As we can see in this chart that BNB created an inverse HEAD AND SHOULDER pattern inside the triangle pattern and it broke the upper trend line and moved to retest the upper trend line which will be the confirmation that we can take some position at that level.
In the current scenario, we should wait for confirmation.
If BNB breaks down the upper trend line and moves again inside the triangle then this chart will be invalidated.
Entry;-$399
Target:-80% TO 100%
Stop loss:-$390
With leverage 3x to 5x
Share your views in the comment section.
Remember:-This is not a piece of financial advice. All investment made by me is under my own risk and I am held responsible for my own profit and losses. So, do your own research before investing in this trade.
Happy trading.
Sorry for my English it is not my native language.
Do hit the like button if you like it and share your charts in the comments section.
Thank you...

BinanceCoin BNBUSDT - Breaking out! + Massive ascending triangle- BNB is currently breaking out of the descending channel, which is ofcourse very bullish sign!
- We have a massive ascending triangle on the macro scale (weekly), which is going to break maybe this year too.
- BNB together with DOT looks very promising at this moment - very good buying opportunity.

the possibilities for BNBthere are 2 possibilities and you should take your decision today in these days💪:
1) if it breaks the resistance today or tomorrow and there is a confirmation buy it will explode
2)if it bounces on the resistance(featured) sell until the support because it won't breakdown the support
GOOD LUCK...❤️

BNBUSDT - SETUPBNBUSDT price is trying to bounce from a support zone and now the challenge for the bulls to break that area aggressively. If they do so we can expect a good upward rally towards near-term targets.
