BNB/USDT LONG CMP 2 HOUR UPDATE BY CRYPTOSANDERSWelcome to this quick BNB/USDT analysis in the chart.
I have tried my best to bring the best possible outcome in this chart.
Entry:-CMP
Target:-$380,$390
Stoploss:-NA
With leverage 3x to 5x
And long term hold and good profit 😉🙂😊✈️✈️
Remember:-This is not a piece of financial advice. All investment made by me is under my own risk and I am held responsible for my own profit and losses. So, do your own research before investing in this trade.
Happy trading.
Sorry for my English it is not my native language.
Do hit the like button if you like it and share your charts in the comments section.
Thank you...
BNBBTC

BNB Binance Coin Price Targets and Stop LossBNB/USDT
Entry Range: $361 - 385
Price Target 1: $413
Price Target 2: $430
Price Target 3: $471
Stop Loss: $334

#BNBUSDT looks prime for 100% Rally!Welcome to this quick BNB/USDT 1day analysis in the chart.
I have tried my best to bring the best possible outcome in this chart.
Reason of trade:-#BNB/USDT looks triangle pattern create and 100% Rally confirms and long term hold!
Entry:-$358
$385
Target:-80% TO 100%
Stoploss:-$307
With leverage 3x to 5x
And long term hold and good profit 😉🙂😊✈️✈️
Q:-What do you think about this?
Do you think we will see a new ATH of BNB in the next quarter?
Share your views in the comment section.
Remember:-This is not a piece of financial advice. All investment made by me is under my own risk and I am held responsible for my own profit and losses. So, do your own research before investing in this trade.
Happy trading.
Sorry for my English it is not my native language.
Do hit the like button if you like it and share your charts in the comments section.
Thank you...

BNBBTCHello Crypto Lovers,
Mars Signals team wishes you high profits.
We are in the daily time frame. The price has broken the resistance line and is making its pullback. We expect it to rise up again and hit the next resistance zone. If this resistance zone is broken, it will go higher and if the support zone is broken, it will go lower.
Warning: This is just a suggestion and we do not guarantee profits. We advise you to analyze the chart before opening any positions.
Wish you luck


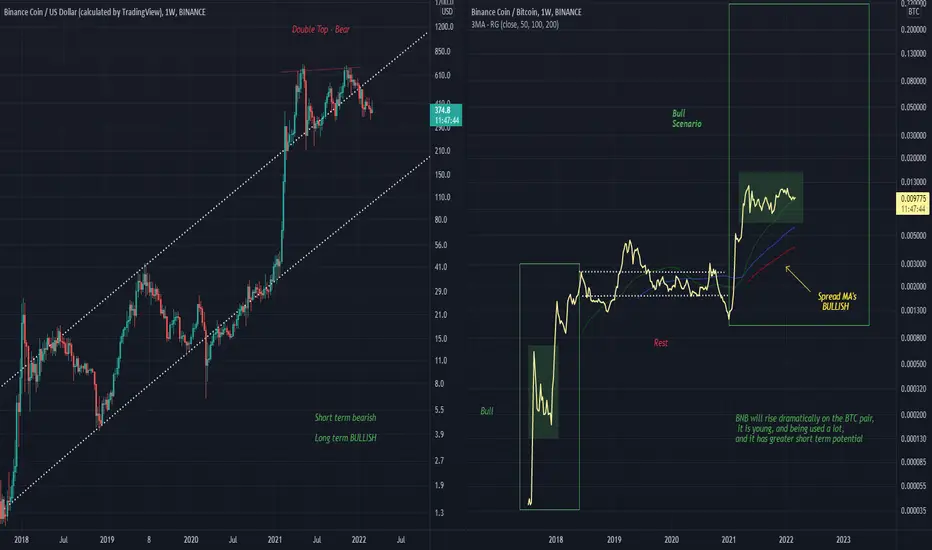
BNB AnalysisOn the USD pair the double top will dominate in the short term, leaving price to fall a bit.
On this dip it would be a great time to enter.
This dip is shown on this analysis below
The BNBBTC pair looks very bullish, you could call the current structure in the bigger rectangle a double top, but if it were an extremely bullish case it could act as a bullflag.
BNB almost reminds me of the early BLX (Bitcoin) chart. Immense bull action with little bear downtime.
BNBUSDT-SHORTBased on technical factors there is a short position in :
📊 BNBUSDT Binance Coin
🔴 Short Now 381.1
🧯 Stop loss 400.0
🏹 Target 1 371.0
🏹 Target 2 356.5
🏹 Target 3 321.0
💸Capital : 1%
We hope it is profitable for you ❤️
Please support our activity with your likes👍 and comments📝

BNBUSDT-LONGBased on technical factors there is a long position in :
📊 BNBUSDT Binance Coin
🔵 Long Now 411.10
🧯 Stop loss 389.0
🏹 Target 1 429.0
🏹 Target 2 454.0
🏹 Target 3 499.0
💸Capital : 1%
We hope it is profitable for you ❤️
Please support our activity with your likes👍 and comments📝

BINANCE COIN - AnalysisOn a daily timeframe, pattern conditions and resistances are such that the $420 range is a very important static resistance. I can expect a positive move of around $500 in the coming weeks by crossing this resistance. If it fails to cross this area, the positive trend will be broken.

BNB/USDT Technical Overview ( Bearish Retest )#BNB/USDT TA Update:-
Total Overview about This Coin:-
$BNB current price is $405
Currently trading at Resistance level.
$440 is resistance barrier.
If break this level then we can see Upward move.
If $BNB break $500 barrier then We can see $1000 also in couple of Weeks.
But below $440 , I am bearish for short term.
If Rejected from current level resistance then We can see $250-$300 level also.
Long Term best Accumulation zone will be $100-$150 ( Not now its can take time but this will be best entry. )
One TL showed Bearish Retest and One TL showed Bullish Retest.
So Personally I am bullish only above $440 level otherwise waiting for more Downside move.
This is HTF chart.
Support levels:- $280/$200
Resistance:- $440-$480 / $668

BNB/USDT 1DAY UPDATE BY CRYPTOSANDERSWelcome to this quick BNB/USDT 1 day analysis in the chart
I have tried my best to bring the best possible outcome in this chart.
hello folks
Looking at BnB/USDT it looks like the bubble top pattern created earlier may bounce back to the first double top so I can go to $360 and $440 from here and back to $395 for a retest. bounce back as $700,
This is not a piece of financial advice.
Sorry for my English it is not my native language.
Do hit the like button if you like it and share your charts in the comments section.
thank you.

WABIBTC target suppport and resistance request*****important- *****
thin line above price is the first target. thin line below price is support.. stop point. Fibonacci correction between the highest price and lowest fiat in the chart area are thick lines.. thick lines are hard support and hard resistances.. main target in fallen assets is the green line . decline in peak assets main target green line **********
thnks goodluck.. always stoploss ..

BNB (BNB) - February 25Hello?
Traders, welcome.
If you "follow", you can always get new information quickly.
Please also click "Like".
Have a good day.
-------------------------------------
(BNBUSDT 1W Chart)
The 341.7-383.3 interval is the interval that determines the trend.
Therefore, you should check the movement as the trend is likely to continue out of the 341.7-383.3 zone.
If it falls from the 332.4 point, Stop Loss is required to preserve profit and loss.
However, it may rise below the touch point near the 258.6 point, so you need to think about countermeasures.
In the wRSI_SR indicator, a similar movement to the A section is also seen in the B section.
However, careful trading is required because there is no guarantee that the movement will occur after the B section as it does after the A section.
When viewed together with the CCI-RC indicator, in section A, the CCI was above the +100 point, and in section B, the CCI was located in the range of -100 to +100.
Therefore, in order to show the same movement in section B as section A, the CCI line must rise above +100 point.
------------------------------------
(BNBBTC 1W Chart)
We need to see if we can get support and rise in the 0.009135-0.009485 section.
If it falls below the triangle, there is a possibility that it may fall near the 0.006783 point, so trade with caution.
------------------------------------------
We recommend that you trade with your average unit price.
This is because, if the price is below your average unit price, whether the price trend is in an upward trend or a downward trend, there is a high possibility that you will not be able to get a big profit due to the psychological burden.
The center of all trading starts with the average unit price at which you start trading.
If you ignore this, you may be trading in the wrong direction.
Therefore, it is important to find a way to lower the average unit price and adjust the proportion of the investment, ultimately allowing the funds corresponding to the profits to be able to regenerate themselves.
------------------------------------------------------------ -------------------------------------------
** All indicators are lagging indicators.
Therefore, it is important to be aware that the indicator moves accordingly with the movement of price and volume.
However, for convenience, we are talking in reverse for the interpretation of the indicator.
** The MRHAB-O and MRHAB-B indicators used in the chart are indicators of our channel that have not been released yet.
(Since it was not disclosed, you can use this chart without any restrictions by sharing this chart and copying and pasting the indicators.)
** The wRSI_SR indicator is an indicator created by adding settings and options to the existing Stochastic RSI indicator.
Therefore, the interpretation is the same as the traditional Stochastic RSI indicator. (K, D line -> R, S line)
** The OBV indicator was re-created by applying a formula to the DepthHouse Trading indicator, an indicator disclosed by oh92. (Thanks for this.)
** Support or resistance is based on the closing price of the 1D chart.
** All descriptions are for reference only and do not guarantee a profit or loss in investment.
(Short-term Stop Loss can be said to be a point where profit and loss can be preserved or additional entry can be made through split trading. It is a short-term investment perspective.)
---------------------------------

BNB/USDT 4HOUR UPDATE BY CRYPTOSANDERSWelcome to this quick BNB/USDT analysis.
I have tried my best to bring the best possible outcome to this chart.
BNB/USDT is looking bullish and falling wage pattern and buy the dip green zone
BNB/USDT is back on entry. BnB can long from here if breaks the downside red zone then stop loss $344
entry:-$362
$376
target;-$423
$384
$395
$405
$417
$432
stoploss:-$344
Remember:-This is not a piece of financial advice. All investment made by me is under my own risk and I am held responsible for my own profit and losses. So, do your own research before investing in this trade.
Happy trading.
Sorry for my English it is not my native language.
Do hit the like button if you like it and share your charts in the comments section.
Thank you...

BNB is going to rise to $393 after we should take a tradeBNB is going to rise to $393 after we should take a trade
Bitcoin MUST confirm that trade

BNBUSDT short🔻Hello everyone
BNB got rejected and did pullback as well in both pairs with usdt and btc.
warning: it is not a piece of financial advice always do your own research.

BnB is going to liquidate Buyers, buy it after ONLY BnB is going to liquidate Buyers, buy it after ONLY
It follows BTC in 90% of cases

BNB/USDT 4HOUR UPDATE BY CRYPTOSANDERSWelcome to this quick BNB/USDT analysis.
I have tried my best to bring the best possible outcome to this chart.
BNB/USDT is looking bullish and falling wage pattern and buys the dip green zone
BNB/USDT is back on entry. BnB can long from here if breaks the downside red zone then stop loss $370
entry:-$390
$405
target;-$423
$439
$456
$472
$500
stoploss:-$370
Remember:-This is not a piece of financial advice. All investment made by me is under my own risk and I am held responsible for my own profit and losses. So, do your own research before investing in this trade.
Happy trading.
Sorry for my English it is not my native language.
Do hit the like button if you like it and share your charts in the comments section.
Thank you...

BNB is gonna outperform BTCOn the Weekly chart in BTC pair, BNB seems to have risen after months of consolidation phase carrying out the first upward impulsive move. Its currently almost at the end of its impulse correction wave 2 and is ready to get to new heights in its BTC pair.
Since BTC also looks bullish so the USDT pair of BNB will hopefully perform well in the upcoming weeks.

BNB/USD - At CRITICAL support $400. Can it Rally Again?BNB find itself at a key junction, sitting just above the critical support at $400. If buyers fail to keep BNB above this level, then it won't be pretty as BNB will lose the current uptrend (dotted trendline).
Yesterday's drop invalidated this most recent breakout from the downtrend, hopefully BNB can go back above it again.
Right now, BNB may have another chance to test the key resistance at $450.
The indicators are not that encouraging, particularly the MACD which is losing momentum, even if still on the positive side.
The RSI did make a higher low on this most recent drop, so that is positive. Lets see if it lasts.
Volume appears flat, so that is neutral. Hence, BNB bias is neutral at this time. The chart can go either way. We will find out in the next few days.
Like and follow if you liked this analysis.

BNB/USSDT 4HOUR UPDATE BY CRYPTOSANDERSWelcome to this quick BNB/USDT analysis.
I have tried my best to bring the best possible outcome to this chart.
BNB/USDT is looking bullish and falling wage pattern and buys the dip green zone
BNB/USDT is back on entry. BnB can long from here if breaks the downside red zone then stop loss $383.5
entry:-$395
$410
target;-$423
$439
$456
$472
$500
stoploss:-$385
Remember:-This is not a piece of financial advice. All investment made by me is under my own risk and I am held responsible for my own profit and losses. So, do your own research before investing in this trade.
Happy trading.
Sorry for my English it is not my native language.
Do hit the like button if you like it and share your charts in the comments section.
Thank you...

BNB/USD - About to BREAKOUT! 20% Rally Possible! 😍BNB appears at the limit to break away from this downtrend. As you can see on this 3D timeframe, the MACD+RSI and the price action support the bullish case.
A clean break and re-test of the previous trendline as support would allow BNB to rally at least 20%.
Wait for the breakout and then take a position. The market has been quite bullish today, but most of the price increase was on weak volume. This is a warning sign that maybe this increase is a fakeout.
So make sure to use a proper stop loss if you take a position, otherwise, good luck!
Like and follow if you liked my idea!

BNB/USDT 4HOUR UPDATE BY CRYPTOSANDERSWelcome to this quick BNB/USDT analysis.
I have tried my best to bring the best possible outcome to this chart.
BNB/USDT is looking bullish and falling wage pattern and buys the dip green zone
entry:-$395
$410
target;-$423
$439
$456
$472
$500
stoploss:-$385
Remember:-This is not a piece of financial advice. All investment made by me is under my own risk and I am held responsible for my own profit and losses. So, do your own research before investing in this trade.
Happy trading.
Sorry for my English it is not my native language.
Do hit the like button if you like it and share your charts in the comments section.
Thank you...
