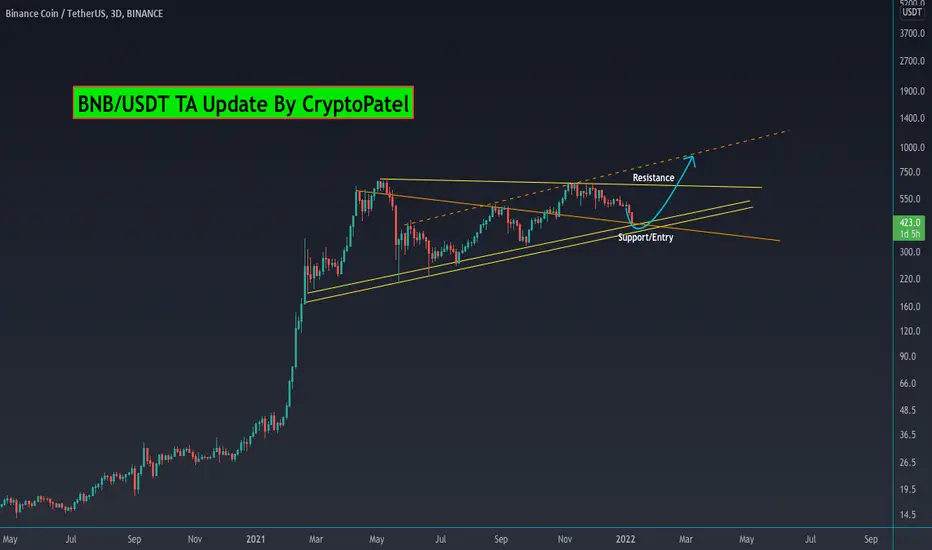
BNBUSDT Is it Good time to BUY ? BNBUSDT
- making new HH/HL
- Bullish upward parallel channel
- shows respect at Support and Resistance
Please like and follow for more updates.
Thank you
BNBBTC

Simple but smartHi guys
The channel is valid, so the midline will be valid as well. If there is a serious reaction to this midline, it can be a sell signal. This analysis may contradict herd behavior, but you can monitor it
If you are looking for a reasonable purchase, act only after breaking the midline
Do not pay attention to shadows
See my latest analysis on Bitcoin for a more detailed decision
what is your opinion?

BNB follow BTCBNB is currently on promotion, BTC affects the whole market and with a potential change in the trend of BTC and a strong rebound in price, the whole market will also rise, it is worth to be patient, because such situations have already occurred in the past


BNBUSD SUCCESS STUCK AT THE DIAGONAL RESISTANCEBNB/USDT
For now is safe for BNB
Can hold and close above the LINE
We wait after the retest, dont speculate too much for now
Market is unpredictable for now
#tipsfortradingplanning

BNB/USDT Good Time to accumulate here imo#BNB/USDT
$BNB dumped and now holding support level.
Strong support is $400
Now I am buying some here in Spot.
Target will be $640 and $900
Stop Loss :- Will update if not hold S
Support:- $400/$330
Resistance:- $640
BNB Update, bullishness holding?When we last looked at BNB-BTC we were contemplating two potential paths (Aqua and Yellow on chart). The bullish Aqua path presumed we might be finishing off a not-so-clean Cup & Handle formation. The bearish Yellow path suggested price might retreat back down towards Range Support. As it looks right now, the Aqua path seems slightly more likely to me--thought it may not keep the same high trajectory. My hesitation is that there may be divergence forming on the Weekly for this pair and that could generate some serious downward pressure. I'm considering a small, high-risk long here.
----------------------------------------------------------------
These are my personal views and not financial advice. Please do your own research before investing.
I'd love to hear your thoughts, ideas and feedback. Feel free to Comment and I'll try and get back to you quickly.
If you appreciated this analysis, consider Liking or Following . Thanks!

BNB is all set to go higherRanges for BNB are perfectly validated. The chart says all.
This is not a financial advice.
- Shoayb

The negative trend is establishedThe negative trend is established. Weakness is seen in the fall motion. If $ 570 is broken, the trend will be bullish again for a short time, and I expect resistance testing. If it loses $ 500 support, be sure to enter in the $ 450 range.

You can buy some BNB near $ 500On a daily timeframe, Binance Coin is again testing the support of $ 500 - $ 510, which must hold support for BNB. We will see a heavy sell-off if $ 500 support breaks. You can buy some BNB near $ 500 with a stoploss of below $ 490. The following support after $ 500 is $ 460 and $ 440 levels.

BNBBTCHello Crypto Lovers,
Mars Signals team wishes you high profits.
We are in the daily time frame. We had an R1 line which the price broke it. There is also an S1 line which the price hit twice and could not break it but it was broken on the third try. The price has made a pullback to this line too and now is fluctuating above it. You can buy it from here for the R1 line. Or you had better wait for the price to hit the S1 line again and buy there for the R1 line. If the price goes below our S1 line, then it would fall further. If the R1 line is also broken then higher targets will be aimed.
Warning: This is just a suggestion and we do not guarantee profits. We advise you to analyze the chart before opening any positions.
Wish you luck

BNB/USDTThe previous day had a large sales volume on a daily time frame, and BNB lost the support level of $ 540. Conditions are provided for further correction. Keep an eye on the $ 500 support level. If it can return above $ 540 and stabilize, the situation will be positive.

Daily BNBETH UpdateBNB and ETH have been trading in a range since mid May 2021 and we are still in a very tight ranging range with neither one being able to outshine the other for a sustained period. I've had most of my "trading bank" in BNB since to last bounce off the lower support line (purple line). It does appear however that BNB is starting to build strength against ETH. It is in a local (shallow) uptrend and we are above recent MACD crossovers. RSI has also just managed to lift its head up into the green, signalling that there is a net positive sentiment for BNB over ETH. Only time will tell if it can build on this further or if ETH will stage a comeback.

BNBUSDT-SHORTBased on technical factors there is a short position in BNBUSDT Binanace Coin
BNBUSDT Binanace Coin
Score 1️⃣
🔴Short Now or set on Key Level 525.5
🟢Target 1 519.0
🟢Target 2 511.0
❌Stop loss 528.5
#K_Level
Every signal has a score from 1 to 5, so accordingly adjust your risk for each signal. The signals with the score of 5 are the most probable ones.
Please support our activity with your likes and comments.


Binance Coin beginning of the year predictionBinance Coin has a Sell signal for the beginning of 2022.
I look for a return to $335 by the end of January!
Happy New Year!

BNBUSDT-LONGBased on technical factors there is a long position in BNBUSDT Binance Coin
BNBUSDT Binance Coin
Score 2️⃣
🔵Long Now or set on Key Level 517.5
🟢Target 1 526.0
🟢Target 2 538.5
❌Stop loss 515.5
#K_Level
Every signal has a score from 1 to 5, so accordingly adjust your risk for each signal. The signals with the score of 5 are the most probable ones.
Please support our activity with your likes and comments.

Binance Coin (BNB) - January 1Welcome, traders.
happy New Year!!!
If you "follow", you can always get new information quickly.
Please also click "Like".
Have a nice day.
-------------------------------------
(BNBUSDT 1M Chart)
We need to see if we can continue the uptrend along the uptrend line.
If it goes down from the uptrend line, it could drop near the 332.4 point, so trade cautiously.
(1W chart)
Above the 134.0-175.5 section: expected to continue upward trend
Above 258.6 point: Expected to create a new wave.
(1D chart)
We need to find support at the 507.9 point and see if we can move above the 526.6 point.
If it declines from the 507.9 point, it may decline to the 438.5-471.6 section, so careful trading is required.
As you get closer to the 438.5-471.6 section, you need to check whether there is a sharp movement.
We need to see if we can continue the uptrend with a move similar to Section A.
------------------------------------------
We recommend that you trade with your average unit price.
This is because, if the price is below your average unit price, whether the price trend is in an upward trend or a downward trend, there is a high possibility that you will not be able to get a big profit due to the psychological burden.
The center of all trading starts with the average unit price at which you start trading.
If you ignore this, you may be trading in the wrong direction.
Therefore, it is important to find a way to lower the average unit price and adjust the proportion of the investment, ultimately allowing the funds corresponding to the profits to be able to regenerate themselves.
------------------------------------------------------------ -------------------------------------------
** All indicators are lagging indicators.
Therefore, it is important to be aware that the indicator moves accordingly with the movement of price and volume.
However, for convenience, we are talking in reverse for the interpretation of the indicator.
** The MRHAB-O and MRHAB-B indicators used in the chart are indicators of our channel that have not been released yet.
(Since it was not disclosed, you can use this chart without any restrictions by sharing this chart and copying and pasting the indicators.)
** The wRSI_SR indicator is an indicator created by adding settings and options to the existing Stochastic RSI indicator.
Therefore, the interpretation is the same as the traditional Stochastic RSI indicator. (K, D line -> R, S line)
** The OBV indicator was re-created by applying a formula to the DepthHouse Trading indicator, an indicator disclosed by oh92. (Thanks for this.)
** Support or resistance is based on the closing price of the 1D chart.
** All descriptions are for reference only and do not guarantee a profit or loss in investment.
(Short-term Stop Loss can be said to be a point where profit and loss can be preserved or additional entry can be made through split trading. It is a short-term investment perspective.)
---------------------------------


BNB (Analysis)On a 4-hour timeframe, there is a range between $ 500 and $ 545. If BNB can break the negative trend line and $ 545 point, the $ 600 target will be activated for lower intervals. Binance Coin is in the range between $ 500 and $ 670 at higher timeframes.

BNBUSDT Technical Analysis💎 BNBUSDT has broken above the resistance. After the pullback and retest, we can expect that the price continues to make the second impulse move. At the entry level if you see a Bullish setup, you can go long
💵 Invest Only 5% of your Portfolio
🎳 Entry now or from 547.5 - 533.6
☕️ TP1 572.1
🍺 TP2 598.5
🍻 TP3 624.6
🍾 TP4 650.0
🍷 TP5
🍸 TP6
🍹 TP7
🎁 TP8
🚫 SL 532.6 - 518.7
Good Luck 🎲
Check the Links in Description and if you LIKE this analysis, please support our page and Ideas by hitting the LIKE 👍 button. ❤️ Your Support is really appreciated! ❤️
Traders, if you have your own opinion about it, please write your own in the comment box. We will be glad for this.
Feel free to request any pair/instrument analysis or ask any questions in the comment section below.
We will have more FREE forecasts in TradingView soon
Have a profitable day 😊👍🏻

BNBUSDT - Enjoy 🚀🚀🚀 Follow me, its good IDEA :)
BNB now are inside if triangle, 1. we can scalping 5, 15m Chart or wait a trend conformation and next open position.
Please share your opinion in the comments !!!
This is not financial advice !!!

🔥BNB short#BNB/USD
🔥BNB is trading in the 500-550$ range
now we are moving to the lower border of the range.
