BNBUSDT-LONGThere is a long position in BNBUSDT Binance Coin
BNBUSDT Binance Coin
🔵Long Now or set on Key Level 519.5
🟢Target 1 555.0
🟢Target 2 593.0
❌Stop loss 511.0
#K_Level
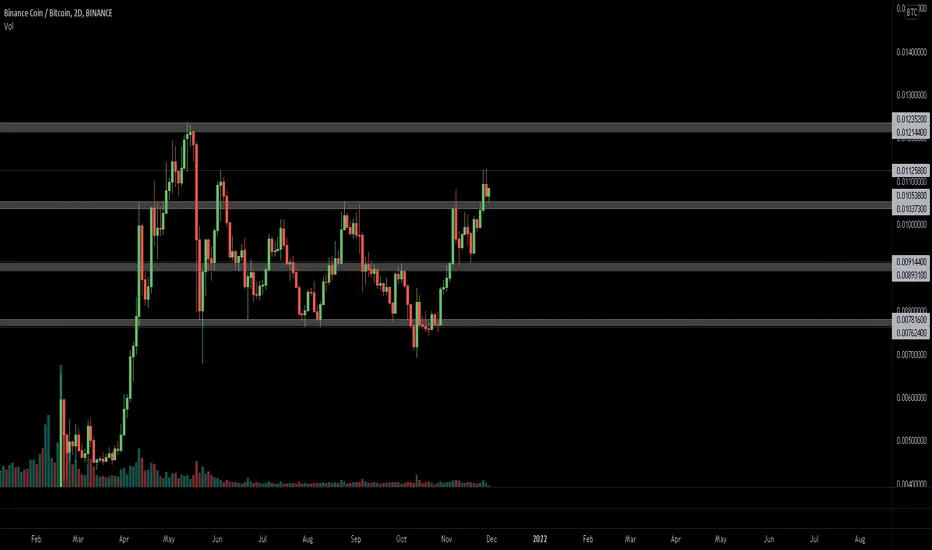
BNBBTC

BNBUSDT-LONGThere is a long position in BNBUSDT Binance Coin
BNBUSDT Binance Coin
🔵Long Now or set on Key Level 525.0
🟢Target 1 544.0
🟢Target 2 570.0
❌Stop loss 514.0
#K_Level

BINANCE COIN LONGS 💰💰💰Expect bullish price action on BINANCE COIN as we are in a bullish market structure on a HTF, price retraced back into discount market area on fibonacci and rejected from psychological level 500$. New ATH's should be seen on this chart this is what i expect 750/800 around those levels.
What do you think ? Comment below..

Binance BNB Retracement coming 🥶Hello Traders,
this is my view on BINANCE:BNBUSD .
Need a closur above 50 MA or the support will be hit.

BNB LONG!Hi! this is my BNB set up for the upcoming week.
TARGET 1 - 617$
Potential profit 18.75%
Target 2 - 647$
Potential profit: 24.52%
Stop Loss - 483.8$
Potential Loss: 6.89%
Hope you will like it! if you have any feedback about the chart pls feel free to tell me:)
MY IDEA ONLY NOT A FINANCIAL ADVICE!!!
Love Yall :)

BNB potential growth CAN BNB bounce back from this support level or not? I think it can bounce especially if BTC will be stable as the coin has shown a good performance against BTC.
I already entered from $520.
Targets and stop loss are clear for my trade.
What do you think guys?
NFA

OMG, there is a bearish wedge on the BNB chart. An upward wedge has formed on the BNB chart. Which statistically breaks downwards. It is also worth noting that the bulls' attempt to break the upper boundary of the wedge failed and there was a false breakdown.
According to the rules, the target of the figure = the height of the figure, in this case, it is 10%. In the case of a breakdown of the lower boundary of the wedge, there might be a good opportunity to sell. In the case of a false breakout of the 489$ level, there may be a good buying opportunity.
Write in the comments all your questions and instruments analysis of which you want to see.
Friends, push the like button, write a comment, and share with your mates - that would be the best THANK YOU.
P.S. I personally will open entry if the price will show it according to my strategy.
Always make your analysis before a trade.

BNBUSDT-SHORT Head and ShouldersThere is a short position in BNBUSDT Binance Coin
BNBUSDT Binance Coin
🔴Short Now or set on Key Level 576.5
🟢Target 524.5
❌Stop loss 585.0
#K_Level

BNBUSDT-SHORT Head and ShouldersThere is a short position in BNBUSDT Binance Coin
BNBUSDT Binance Coin
🔴Short Now or set on Key Level 589.5
🟢Target 524.5
❌Stop loss 602.0
#K_Level

$BNB, if its able to bounce above ~0.11 sats$BNB
Not sure whats going on with volume on this pair but if its able to bounce above ~0.11 sats, it may go up for the ATH
#BNB
Binance Coin (Update)On a daily TF, the trend is in the range of $ 500 to $ 670. Be patient, and if it breaks the $ 670 line, you can enter for $ 760 and $ 860.In case of price correction, the $ 500 range is suitable for entry.

my opinion about the bnb todayIt is not yet fully understood how valid this failure is and that it is likely to be bitcoin-dependent, and we will have to wait for bitcoin to stabilize and then decide, but what is clear at this point is the entry into binance.

Binance Coin - Entry pointsOn a daily timeframe, BNB is in the range of $ 500 and $ 670. If it breaks $ 670, enter for the $ 763 and $ 860 targets. If it is going for correction, enter within the $ 500 range.

BNBUSDT-SHORTThere is a short position in BNBUSDT Binance Coin
BNBUSDT Binance Coin
🔴Short Now or set on Key Level 565.5
🟢Target 1 610.5
🟢Target 2 666.0
❌Stop loss 542.5
#K_Level

BNB/USD - From strength to strength! BULLISH! BNB barely noticed the crash on Saturday and recovered most of it already... similarly to Ethereum, BNB has displayed tremendous strength during this time.
What does that mean? BULLISH.
Always look at how coins cope during a crash, those that hold the best are the horses to bet on.
BNB and ETH are both posed to make significant gains and capitalize on BTC weakness. No surprise that ETH and BNB are the 2nd and 3rd largest coins by market cap after BTC...
If BNB can cross above $600, I expect a rally. Until then, best to be patient.
Indicators are trying to recover, but the volume today is already looking great! If we close in a bullish engulfing candle, BNB bulls are in control.
Like and follow if you liked my idea!

BNBUSDT-SHORTThere is a short position in BNBUSDT Binance Coin
BNBUSDT Binance Coin
🔴Short Now or set on Key Level 635.0
🟢Target 1 574.0
🟢Target 2 511.0
❌Stop loss 652.0
#K_Level

BNBBTCThere is divergence and i see ending diagonal end of the way 5 of B of triangle, so i think it ca breakdown

Elliott Wave Analysis: BNBBTC Is Looking For Wave (C)Hello Crypto traders!
Today we will talk about BNBBTC pair, in which we see very nice and clean EW pattern.
If we take a look on BNBBTC daily chart, we can clearly see it unfolding a bigger, higher degree (A)-(B)-(C) correction. Currently we can see it trading in final stages of an A-B-C pullback within wave (B) that can be followed by another sell-off within wave (C), similar as in May 2021.
So, if we are on the right path, then Binance coin may see limited gains and could turn down anytime soon, which can send the BNBBTC price down to 0.0065 - 0.0040 support zone before bulls show up again.
Be humble and trade smart!
If you like what we do, then please like and share our idea.
Disclosure: Please be informed that information we provide is NOT a trading recommendation or investment advice. All of our work is for educational purposes only.

BNB - is going to skyrocketA trend line has formed on the BNB chart. In the first attempt to break the trend line, the bulls got trapped and a false breakout occurred.
The price has now moved to the trend line again and is trying to break it, which could be a good buying opportunity.
Write in the comments all your questions and instruments analysis of which you want to see.
Friends, push the like button, write a comment, and share with your mates - that would be the best THANK YOU.
P.S. I personally will open entry if the price will show it according to my strategy.
Always make your analysis before a trade.

BNB - Safest range to enterThe positive trend is established in a 4-hour TF, and only BNB is well preserved and close to its historical ceiling. This range is suitable to enter, but the safest way is to enter the $ 712, 769, and $ 860 ranges after breaking the $ 670 resistance.

Binance CoinOn a daily timeframe, the trend is positive and much more powerful than other cryptocurrencies. Enter for the targets of $ 763 and $ 860 by breaking and fixing above $ 670.

bnb wanna break the linesadabada dadaba badddbajahsio mndhuydod asjcdbhdolsdkjd lkjsabjhdhdcmncd diudhdkjhd s;ljsdkdhcjhbsdl.
ok?

