✴️ BNB breaks the major resistance!Well, as you can see, BNB breaks the major resistance of $500 - $510 and is now trading above it. We may see a retest of $500 - $510 area (New Support) before the next move up. The next resistance is $550 and $600 levels, and I mentioned them in the chart. BNB is bullish after the breakout, and we see good movement in the coming days.
BNBBTC

BNB a new price level and an attempt at defenseAfter a long price stagnation, BNB broke the new price level and we will now observe whether the trend will continue or whether we will return to the old price level

BNB/USDT Ready for $3000 after Huge Breakout#BNB Supper Bullish After This Breakout.
Waiting for Huge Target.
Strong Resistance Became strong Support at $500
Currently BNB Broke out $507 Strong resistance and now Toward bullish Targets.
If dip around $500-$510 then That will be good entry zone.
Support: $508/$440

BNBUSDTAfter hitting the PRZ area, the probability of increase is high
But if Bitcoin does not fall ;)

Continuation of the trend and a new price levelBNB shows strong resistance to the impact of the rest of the top cryptocurrencies, nice slight corrections, returns to its price level and continues to break through the next price levels (good sign)

BNB strong price positionBNB defends its price level very well, after price declines it almost immediately regains control and continues the trend upward

BNB - when is the best time to buy 🤔❓❓The entire cryptocurrency market corrected sharply today. BNB corrected by more than 10%.
It is unclear if the correction will continue or if the market will recover quickly and reach new levels.
The best scenario to buy is if the price makes another re-low and then breaks the trend line.
Write in the comments all your questions and instruments analysis of which you want to see.
Friends, push the like button, write a comment, and share with your mates - that would be the best THANK YOU.
P.S. I personally will open entry if the price will show it according to my strategy.
Always make your analysis before a trade.

BNB calm and stabilityBNB has a strong price position, for many days BNB has not had any corrections or major artificial price DUMP, this shows that BNB is moving strongly in its direction

BNBBTC MAPThe past 3-year #BNB/BTC makes one last dip before it starts to recover December into January
I would start to accumulate in November.
The KEY level 0.0064 holds this and this pattern should repeat itself.
Alt will do amazing Q1 going into Q2
Use this Q4 to accumulate as much as u can. don't get robbed like last year...
TP on the chart.
if u like the idea make sure to hit the like:)

BNB defending the price level and changing the trendBNB looks like a very strong cryptocurrency, the price has not moved much during the BTC correction and the next trend is starting to form

BNB it's just a correctionBNB is currently heavily influenced by BTC on the chart, BTC is currently heavily influenced by cryptocurrencies and such situations are perfectly normal

BNB/USDTBNB tested the major resistance level and rejected from there. There is also a small uptrend line that is working as support. The first local support is $480 and after that $460 area. The major support still remains in the $435 - $440 area. The next resistance after $500 is $560 and $600 area. Place your buy orders near the support zone.

BNBUSDT trade will complete head and shoulders pattern. NEXTBNBUSDT trade will complete head and shoulders pattern. after that there is two pathways for BNBUSDT trade. One is correction around 23% fib level where you will get good lower price to re-enter for rally. Supply zone area is showing buy yellow rectangle. Second path is fundamental based. If trade crosses above $530 level then trade will move up without correction towards 161% Fib level. In both situation trade will be up. You van keep position at current situation as well as lower level to get handsome outcome.

BNBUSDT , We are in rocket ...Hello guys
Congratulations to everyone on the new Bitcoin ATH
In here we are in rocket for jump the price , toward our target we have minor resistance to break and can reach the last ATH and hit new ATH , we think in these 2-3 days later we can jump toward the first target
Dont forget use stop loss and money management
Good Luck
Abtin

BNB follow BTCWe have a perfect example of how BTC has a strong influence on other cryptocurrencies, the growth is only due to BTC and I recommend following BTC


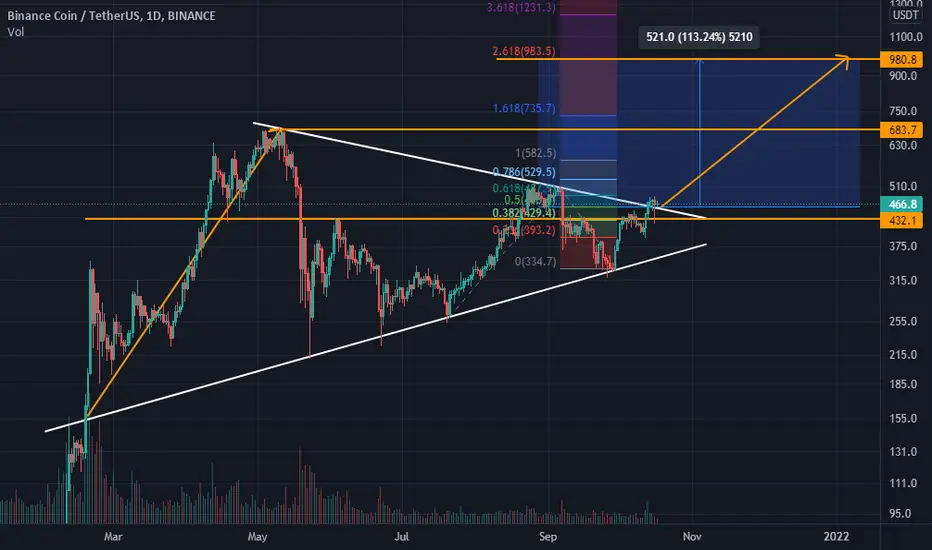
BNBUSDT At Time 4H and Price 483.3$According to the patterns formed in the points of the price cluster
And support and resistance and
Fibonacci waves and charts
At price 510.0$ or 512.0$, according to supply and demand points and the possibility of getting shorts at the resistance point
There is a possibility of price correction
But if this resistance is broken, we expect significant growth
And this is a dramatic increase to $ 690.0 in the long run .
Of course, with the short-term break of Bitcoin , we expect the price to decrease in the short term.
Good Luck

BNB trend formationBNB has held its price level for many days, the chart shows the formation of an uptrend. Binance is also starting to move towards regulation and this will be the deciding factor

BNB/USDTBNB has started to move up after liquidating the traders. As altcoins don't have a clear direction, wait for a proper breakout. Around $510 is the major resistance area. The price might gonna have a reaction to it. If the price directly breaks above the zone, we gonna find potential entries in the pullback.

BNB LONG BreakoutAs we can see in the chat BNBUSDT make inverse head and shoulders on 4hr & breakout and Cup handle on 1day time frame and bullish Signal on EMA MehranBahader indicator which is bullish Bias for me about BNB.
Disclaimer: Not a financial advise

BNB/USD - HUGE Bullish Hammer on 3 Day Chart = 🚀Did you spot this? Can this bullish hammer take us above our first resistance?
Seems likely. Next candle will settle it. :)
Chart screams bullish bias.
Like and follow if you liked this idea!

BNBUSDT breakout and targets, Oct 17This is BNB's targets after this breakout
This is the moment that I was talking about if you want to buy it.
BNBBTC Technical Analysis⏳ Spot
💎 BNBBTC has been moving along the descending channel. It is Bearish now and it might go lower to the Pullback zone. if it breaks above the channel it is expected to reach TP1
🌐 Tradingview
🏁 Short & Medium Term
💵 Invest Only 5% of your Portfolio
🎳 Entry at Market or at 0.006666
☕️ TP1 0.008560
🍺 TP2 0.010222
🍻 TP3 0.011888
🍾 TP4 0.013333
🍷 TP5 _________
🍸 TP6 _________
🍹 TP7 _________
🎁 TP8 _________
🚫 SL 0.006000
Good Luck 🎲
Check the Links in Description and If you LIKE this analysis, Please support our page and Ideas by hitting the LIKE 👍 button. ❤️ Your Support is really appreciated! ❤️
Traders, if you have your own opinion about it, please write your own in the comment box. We will be glad for this.
Feel free to request any pair/instrument analysis or ask any questions in the comment section below.
We will have more FREE forecasts in TradingView soon
Have a Profitable Day
