Binance Coin BNB Supports and Resistances
Greens: Supports - Buy Levels
Reds: Resistances - Sell Levels
Let me know if you need supports and resistances of any other coin.
Thanks for visiting.
Happy Trading!
BNBBTC

BNB - Today I understood some of the advantagesEither you like Binance or not, it's a beast.
In the last days I have been doing research on building a Token (yes, we are thinking to launch something.. like everyone else) and apparently the cheapest, fastest and easiest way it's with Binance... plus you can get your token listed if you have the funds (info from a third party, not from Binance, don't take my word for this).
Anyways, you asked for the BNB chart, here it is. Bullish and potential for 600 range for now.
the FX PROFESSOR


BNB-USDTWowwww... huge money inflow and big pump. BNB did not grow after burning tokens... next trgets are 560 and 600

BNB wants its 3rd Place Back
Nice breakout from parallel channel.
BNB.D weekly is bullish, formed HL and this week could be new HH.
nothing has changed here we are going to send BNB to 0.015 sooner or later.

Binance Coin (BNB) - August 23Hello?
Welcome, traders.
By "following", you can always get new information quickly.
Please also click "Like".
Have a nice day.
-------------------------------------
(BNBUSDT 1W Chart)
If the price is maintained above the 186.10-211.70 range, the uptrend is expected to continue.
In particular, if the price is maintained above the 296.00-348.70 range, it is expected to create a new wave.
(1D chart)
We need to see if we can sustain the price above the 453.99 point.
If it goes down, you should see support at the 390.08 point.
A move above the 453.99 point is expected to accelerate the uptrend.
This flow is expected to continue through the 564.32-588.0 section.
If it falls from the 296.00 point, a Stop Loss is required to preserve profit and loss.
Above the 186.10-211.70 section mentioned in the 1W chart means from a mid- to long-term point of view.
Even so, if you go down after an uptrend, you need a support point or section to protect.
This is because it is an investment to get a return on your holdings.
Therefore, a short-term response is required if a decline is made from the current price position.
However, since the current coin market is located in the volatility zone, there is a high possibility that a too quick response will result in a decrease in profits or a loss.
In the 1W chart, the section above 296.0-348.70 is described as a section where it is possible to create a new wave.
So, when the decline comes to the 296.0-348.70 range, we need to see if it finds support or if the decline is accelerating.
Then you have to react according to the direction it comes from.
You should think about how to react before the move, i.e. when you are in the price position right now.
It is because the third party can make a more objective judgment about how to respond when the price has dropped to the 296.0-348.70 range from the current point of view.
A way to think about it is
1. How much stock will you respond to?
2. At which point will the split selling or buying proceed?
3. How many divisions will you proceed?
4. How to determine the split ratio
You should think about it roughly in the same way as above.
--------------------------------------
(BNBBTC 1W chart)
If the price holds above the 0.004813 point, it is expected that the uptrend will continue.
In particular, if the price holds above the 0.006783 point, it is expected to create a new wave.
(1D chart)
It remains to be seen if the 0.008672-0.009485 zone can find support and build a new wave as it rises above the 0.009971 point.
If it goes down, you should check to see if it finds support at the 0.006995-0.007739 zone.
If it falls in the range of 0.006995-0.007739, Stop Loss is required to preserve profit and loss.
------------------------------------------
We recommend that you trade with your average unit price.
This is because, if the price is below your average unit price, whether it is in an uptrend or in a downtrend, there is a high possibility that you will not be able to get a big profit due to the psychological burden.
The center of all trading starts with the average unit price at which you start trading.
If you ignore this, you may be trading in the wrong direction.
Therefore, it is important to find a way to lower the average unit price and adjust the proportion of the investment, ultimately allowing the funds corresponding to the profits to regenerate themselves.
------------------------------------------------------------ -----------------------------------------------------
** All indicators are lagging indicators.
Therefore, it is important to be aware that the indicator moves accordingly with the movement of price and volume.
However, for the sake of convenience, we are talking in reverse for the interpretation of the indicator.
** The wRSI_SR indicator is an indicator created by adding settings and options to the existing Stochastic RSI indicator.
Therefore, the interpretation is the same as the traditional Stochastic RSI indicator. (K, D line -> R, S line)
** The OBV indicator was re-created by applying a formula to the DepthHouse Trading indicator, an indicator disclosed by oh92. (Thanks for this.)
** See support, resistance, and abbreviation points.
** Support or resistance is based on the closing price of the 1D chart.
** All descriptions are for reference only and do not guarantee a profit or loss in investment.
Explanation of abbreviations displayed in the chart
R: A point or section of resistance that requires a response to preserve profits.
S-L: Stop Loss point or section
S: A point or section where you can buy to make a profit as a support point or section.
(Short-term Stop Loss can be said to be a point where profit and loss can be preserved or additional entry can be made through split trading. It is a short-term investment perspective.)
GAP refers to the difference in prices that occurred when the stock market, CME, and BAKKT exchanges were closed because they are not traded 24 hours a day.
G1 : Closing price when closed
G2: Opening price
(Example) Gap (G1-G2)

BNB/BTC- Binance-coin long term nalysisBinance coin has remained relatively stagnant over the past two months.
Looking ahead, the first weekly resistance lies at VBRN 0.010000. If the shorters will be able to push the price down to 0.008000 we can expect that the price will drop all the way down to the demand area at 0.006695 which is also a 50.00% Fibonacci retracement from the start of the year 2021.
If the price will break the demand zone at 0.006695 the next support at 0.004500 will follow.

BNBUSDT Is Going Up
Welcome back Traders, Investors, and Community!
BNBUSDT on H4 has been moving along the Ascending channel and has been making HHs and HLs in the channel. After the rejection from the support line it is expected to go higher.
⬆️Buy now or Buy at 432.00
⭕️SL @ 408.00
✅TP1 @ 458.00
✅TP2 @ 464.00
✅TP3 @ 470.00
✅TP4 @ 480.00
✅TP5 @ 490.00
✅TP6 @ 520.00
Check the Links in Description and If you LIKE this analysis, Please support our page and Ideas by hitting the LIKE 👍 button. ❤️ Your Support is really appreciated! ❤️
Traders, if you have your own opinion about it, please write your own in the comment box. We will be glad for this.
Feel free to request any pair/instrument analysis or ask any questions in the comment section below.
We will have more FREE forecasts in TradingView soon
Have a Profitable Day

BNB is ready to action...Well, are you ready?
BNB is broke the resistance and starting to rise. I hope great things will happen soon...

BNB to 0.15 SATBNB looks bullish in all time frames.
I think there is a good chance it touch 0.015 SAT area within 1.5-2 months.
Closing weekly above 0.00095 is the key.
I am mid-long term bullish on BNB.

BNBBTC 1D long setup; Breakout of desc TL and above EMAsTA explained
BNB broke out of the descending trendline and now trading above all 1D EMAs. A little pullback needed to activate the trade.
Trade setup
Best entries: 0.008595 - 0.008968
TP1: 0.010236
TP2: 0.011198
TP3: 0.012133
SL: 0.7525
RR: 2.67
Max leverage: na
—————
MDSquared Crypto Lounge
—————
Do Your Own Research (of course)
Trade at own risk (of course)
Only trade what you can afford to lose (of course)

BNB/USDT 61% pure profit guys congrats #BNB/USDT Profit Update:-
$BNB currently trading at $428
And went upto $437
Mean to say that our 2 Targets has been achieved.
62% pure profit.
Entry:- $260-$270 ✅
TP1:- $330 ✅
TP2:- $430 ✅
Now…?
I closed my 70% positions here and holding only 30% Profit positions.
And If breakout $432 resistance level then we can see $600 also.
Resistance:- $432/$600
Support:- $330/$270
Please click like button and Appreciate my hard work.
Must follow me for latest crypto real time updates.
Thank you.


JUST BEAT ITNo one wants to be defeated
Showin' how funky strong is your fight
It doesn't matter who's wrong or who's right

Binance BNBUSDT - 3x Ascending channel on the weekly timeframe!- Binance Coin - BNB Rank #3, Volume 24h $2,582,016,045
- BNB is by far one of the most bullish altcoin out there!
- My impulse Elliott wave is telling me that there will be another pump very soon.
- 3x Parallel channel can act as a support / resistance in the future.
- For expected duration of the trade, probability, stop loss, profit target, entry price and risk to reward ratio ( RRR ) - please check my signature below ↓
- If you want to see more of these ideas, hit "Like" & "Follow"

ATA uptrend?Daily closed above previous daily high and holds fine.
BSC coins pumps with BNB and BNB looks good.
Low caps pumps hard and could touch 1500 SAT from here.


BNB back to 550$, #BNB #BNBBTC BreakoutHello my dear padawans,
First thing, do not take this as a piece of financial advice.
I expect BNB will breakout from this level and will fly to 0.011BTC level asap.
BNB should bullish in this situation because most Bitcoiners jumping to strong alts from BTC.
This will be a mini-rally.
this can be a beta #Altseason in cryptoverse.
Let's see what's gonna happen.
May the force be with you,
Cheers.

BNBUSDTbears are going to take control for the next week ,waiting to buy agani at the end of the bear move wic will be confirmed by my indictor and full wave completion

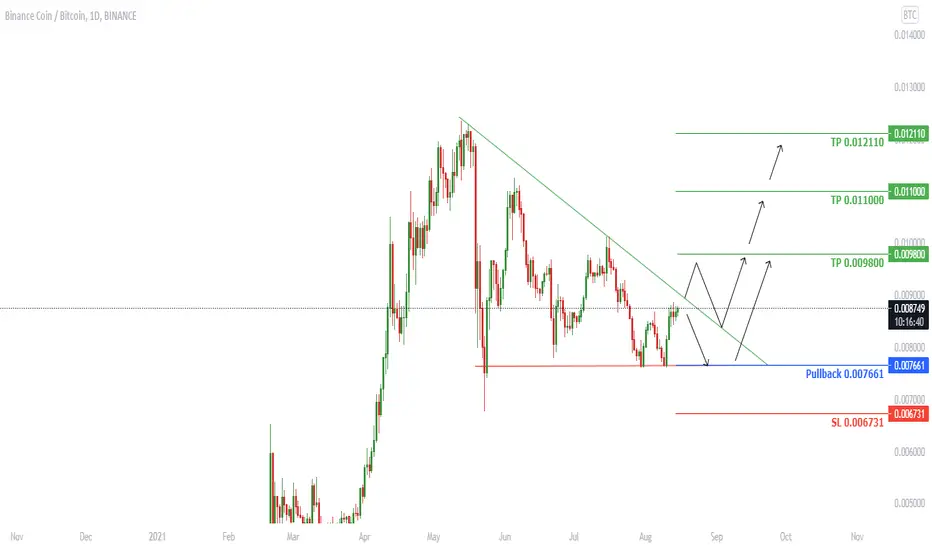
BNBBTC Will Go Up After the Breakout
Welcome back Traders, Investors, and Community!
BNBBTC on daily TF has formed a Descending Triangle which after the breakout above the resistance the pair has a potential of going higher.
⬆️Buy now or Buy at 0.007661
⭕️SL @ 0.006731
✅TP1 @ 0.012110
✅TP2 @ 0.011000
✅TP3 @ 0.009800
Check the Links in Description and If you LIKE this analysis, Please support our page and Ideas by hitting the LIKE 👍 button. ❤️ Your Support is really appreciated! ❤️
Traders, if you have your own opinion about it, please write your own in the comment box. We will be glad for this.
Feel free to request any pair/instrument analysis or ask any questions in the comment section below.
We will have more FREE forecasts in TradingView soon
Have a Profitable Day
BNB VS BTCChart is clear
Targets on the charts .
Negative divergence occured alread.
Bnb will dump soon or later .
Cheers.
BINANCE:BNBBTC
Dont Forget !!! This is a weekly chart not for a day trader .
Bye ... :)
BINANCE:BNBBTC

Massive BNBUSD Bat Completes, Saves BTC A DrubbingBINANCE:BNBUSDT
BNBUSDT up top with that Bat Harmonic Pattern, and on the right AB=CD on the second half of the final leg (CD) was appreciated
Below chart BNBBTC has been in that wedge for months. Bat Pattern completed as BNB went for another run at it.
Just a brawl down there

BNBUSD RETEST AND RESISTANCE UPDATEBNBUSD is always having that pullback but full Uprise.
Strong resistance: 402.2497
possible retest: 372.7566
Up Prediction: 478.1948
Recommendation: "Always Trade with stop loss and take profit''
Please leave a like and comment as it will help us a lot.
Trade safe. BINANCE:BNBUSD
