BNBUSDT/BNB KING COIN ✔👌👍🎁 JUSt BUYTrump scares ordinary people to buy themselves at the best price✔✔✔❤❤❤❤👍👍👍👍
BNBBTC


BNB weekly forecastslowly making its way to mitigate daily supply zone, high probability trade can be taken at ~306-336 - buy and hodl

BNB Possible Long!BNB has a high probability of being a good Long. Let me explain my reasons.
First of all, if we apply the Fibonacci retracement from the beginning of the parabolic bullish movement we can notice a great growth in BNB being that this retracement has led it to test 0.618% which is a fairly good zone in liquid currencies to initiate a possible Long . This means that BNB has a high probability of staying above these levels. In the hypothetical case that BTC and the bulls manage to reduce the bearish force a bit.
If we talk about indicators we can denote that the RSI has touched the lowest levels since the beginning of the bearish in all cryptocurrencies due to the panic. Currently the reports show strong purchases, but the bearish force is still there and everything indicates that they do not think to reduce their trend. But the RSI indicates oversold and is starting to regain strength, if we manage to retake the 50 level, it could be a good sign for the bulls.
What worries me a bit is the MACD issue, as we see this fall, it led BNB to bearish levels that it had never had before, taking it to the value of -65. This being quite negative, currently in the macd we can see loss of bearish strength, but are they really losing strength?, The values are still negative, this could be a false upside at this point.
If we talk about supports and resistances we can denote that we have tested the support that BNB took at the beginning of the bullish from 240 to 600. This being a clear buying force at these levels.
And based on MD Lines we could say that we already started a bullish of 6-9 candles, currently we have 2, I would expect the 537 level as a target since in this area, we can see quite a strong selling force. Which could indicate that the bears are waiting to open more positions.
Currently in BTC there are 1087 shorts according to CFTC. So personally I'm not that positive, but the bulls are gaining ground. I will open a small position using 2x and settlement at 0. It should also be added that we can visualize a perfect test of the 200-day moving average, which gives me some confidence to open this position.

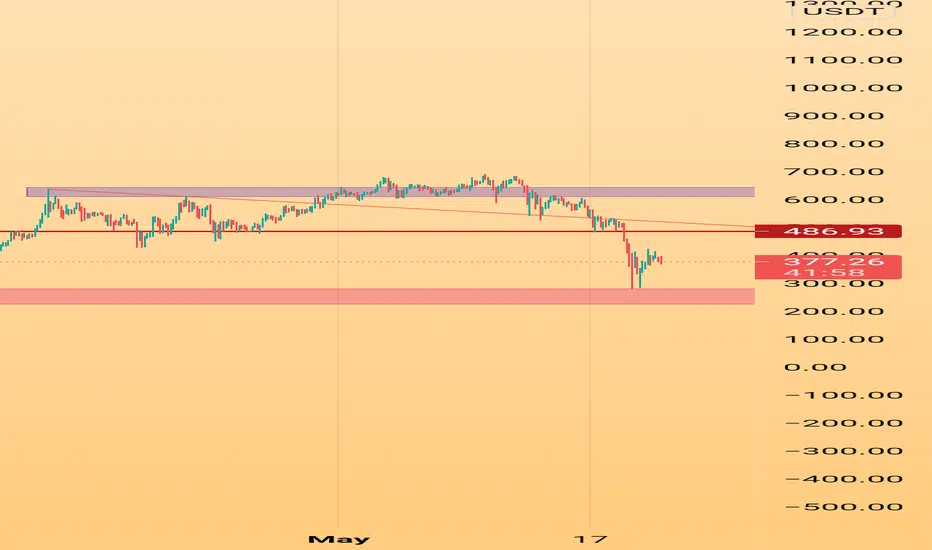
BNB 1H SUPPORTBNB 1H support is at ~$380
Try to set some buy orders near the support zone
If BNB holds above the trendline,
the Take-Profit target would be $404, $420, and $445

BNB 1H SUPPORT LEVELBNB 1H support is at ~$330
Try to set some buy orders near the support zone
If BNB holds above the trendline,
the Take-Profit target would be $364, $385, and $408

BNBUSD - Bullish BreakoutBNBUSD gave a bullish breakout over the sideways congestion, with immediate target zone seen at 425 with next at 485/525 short term.
Near term traders may place 378 as stop.

BNB, Binance Coin - don't buy coin before that ❌I see only one scenario when I'll buy BNB. We have a clear resistance line at 387.6. Only if the price starts squeezing near to the level, I will ready to buy it after breakout and retest.
Write in the comments all your questions and instrument analysis of which you want to see.
Friends, push the like button, write a comment, and share with your mates - that would be the best THANK YOU.
P.S. I personally will open entry if the price will show it according to my strategy.
Always make your analysis before a trade


Binance Coin (BNB) - June 1Hello?
Welcome, traders.
By "following", you can always get new information quickly.
Please also click "Like".
Have a good day.
-------------------------------------
(BNBUSDT 1W Chart)
(1D chart)
We should see support at the 333.22 point and move above the 375.55 point to see if we can break out of the downtrend line.
If it falls from the point of 333.22, Stop Loss is required to preserve profit and loss.
However, it may follow an uptrend line, so you need to trade cautiously.
1st support section: 225.23-252.23 section
Second support section: section 90.25-117.24
If it moves towards the 414.21-441.21 section and finds support, I would expect further upside.
-------------------------------------
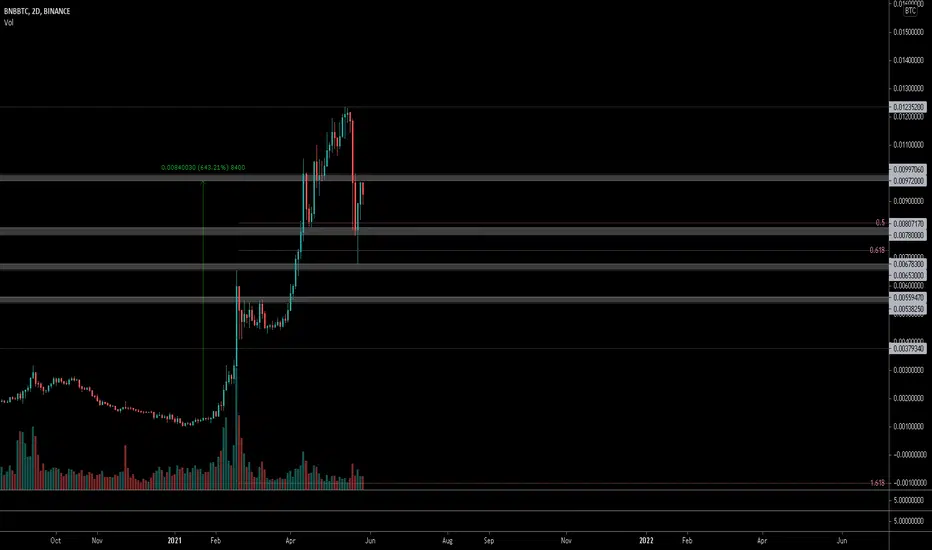
(BNBBTC 1W Chart)
(1D chart)
It remains to be seen if the 9242 Satoshi-9651 Satoshi section can support and rise.
If it goes down, we should see if we can move up along the uptrend line.
If it falls in the 7192 Satoshi-7602 Satoshi section, Stop Loss is required to preserve profit and loss.
------------------------------------------
We recommend that you trade with your average unit price.
This is because if the price is below your average unit price, whether it is in an upward trend or in a downward trend, there is a high possibility that you will not be able to get a big profit due to the psychological burden.
The center of all trading starts with the average unit price at which you start trading.
If you ignore this, you may be trading in the wrong direction.
Therefore, it is important to find a way to lower the average unit price and adjust the proportion of the investment, ultimately allowing the funds corresponding to the profits to regenerate themselves.
------------------------------------------------------------ -----------------------------------------------------
** All indicators are lagging indicators.
Therefore, it is important to be aware that the indicator moves accordingly with the movement of price and volume.
However, for the sake of convenience, we are talking in reverse for the interpretation of the indicator.
** The wRSI_SR indicator is an indicator created by adding settings and options to the existing Stochastic RSI indicator.
Therefore, the interpretation is the same as the traditional Stochastic RSI indicator. (K, D line -> R, S line)
** The OBV indicator was re-created by applying a formula to the DepthHouse Trading indicator, an indicator disclosed by oh92. (Thanks for this.)
** See support, resistance, and abbreviation points.
** Support or resistance is based on the closing price of the 1D chart.
** All descriptions are for reference only and do not guarantee a profit or loss in investment.
Explanation of abbreviations displayed in the chart
R: A point or section of resistance that requires a response to preserve profits.
S-L: Stop Loss point or section
S: A point or section where you can buy to make a profit as a support point or section.
(Short-term Stop Loss can be said to be a point where profit and loss can be preserved or additional entry through split trading.
GAP refers to the difference in prices that occurred when the stock market, CME, and BAKKT exchanges were closed because they are not traded 24 hours a day.
G1 : Closing price when closed
G2: Opening price
(Example) Gap (G1-G2)

Last idea on issue & check the chartIf you say btcusdt correction percentage is somehow equal to (for example) bnbbtc you can generate dips on bnbusdt.
I could aplly the concept on any pair if it got btc pair and finally i picked one
I say correction will be over since we didn't observe the balanced growth on alts if you think they are related to btcusdt price.
so there is dip
Probable correction targets on btcusdt are:
18k (cme chart)
20k
22k
25k
27k
In bnbbtc pair i assumed that it's going to touch a lower and closest support if correction keeps going and it ends there
So from 100_150 i have an entry range
Entry on 150 with leverage 2 on 120 leverage 4 on 105 leverage 5, it's better to set equal amount on 120 & 150
If btc wants to keep digging i say btcusdt at 17k is good as my stop, i pick 90 in bnbusdt as stop, money management is up to u
Right your idea
Take care

BNB USDT NEW UPDATETake care of your capital
The first point is not to lose money
Support me with likes and comments
$BNB
#bnbcoin

$BNB, If a breakout above ~.01 sats happens..$BNB
As reference.
If a breakout above ~.01 sats happens, then it may get some traction. Until then, not buying retest on resistance.
UCTS bearish on the daily
#BNB
BNB - Waiting for EMA to breakWe have a consolidation zone given by the volume poc and the EMAS of 20 and 55. Once broken with force, bnb could reach the 500usd approx. values.
My entry price will be approximately 494usd. When the previous maximum has been exceeded .
ANAGE YOUR RISK! The loss you take in case of failure should NEVER be more than 2% of your total capital. NEVER. You invited to share your vision in the comments. Thank you

300$ incomingBNB broke through the rising wedge on the 4h chart.
Price objective is equal to the height of the back of the wedge, i.e. $291.
Position: Long
Entry: $300 (trigger 291)
Targets: 360, 385, 420
Stop loss: $294

BNB Buy a break setup.BNBUSDT - Intraday - We look to Buy a break of 401.2 (stop at 376.1)
Daily signals are mildly bullish.
A break of bespoke resistance at 400.0, and the move higher is already underway.
The overnight dip was bought into and follow through upward pressure was noted.
We are trading at oversold extremes.
A higher correction is expected.
Our profit targets will be 479.1 and 499.1
Resistance: 400.0 / 450.0 / 490.0
Support: 365.0 / 330.0 / 300.0


BNB USDT - NEW JUMP 🚀🚀🚀DISCLAIMER:
1.trade carefully and have stop loss for sure
2.Past performance is not indicative of future results.
<>
<>