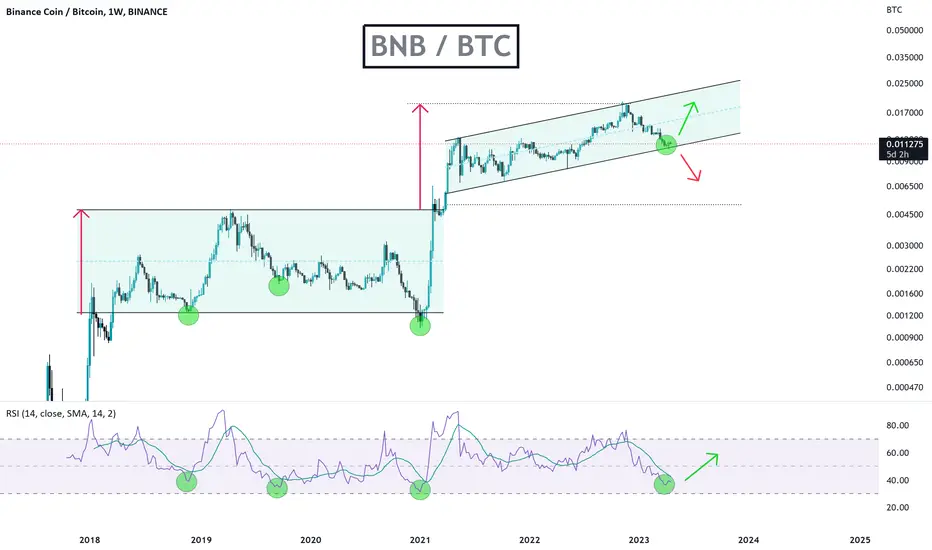
Decision Time for Binance Coin (BNB)Decision Time for Binance Coin (BNB)
- RSI at this low level is typically followed by
significant price increase (See Green Circles).
- A buy here could make sense with a tight stop
below the upward channel border. Equally on a break
of the border to the downside, you could short and set
your stop loss at the channel border.
- We are trending up in the channel but technically we are
not in a full uptrend as we are below the 200 day. Caution
advised.
As we are meeting the border of the channel now is a good time
to consider a position, place it, ENFORCE a stop loss and sit back and
see what happens next.
Best of luck, the parameters are set.
PUKA
BNBBTC
Potential Reversal Amid Market PressureBinance Coin (BNB) is currently trading at $235 with an RSI (Relative Strength Index) of 25. Let's delve into the details of recent market movements and the potential implications for BNB's price.
In recent times, BNB encountered a significant support level at $300, after which it experienced a positive swing. The price escalated precisely from this range to reach the resistance level situated at the floor of the previously broken corner pattern, which coincided with the blue range at $320. However, since this level had been breached in the past, it resulted in the formation of a range channel between the aforementioned resistance and the $300 support.
The market dynamics took a negative turn when news regarding the SEC complaint against the Binance exchange surfaced. This led to a prevailing wave of fear and selling pressure across the market, causing important support levels to crumble not only for altcoins but also for Bitcoin. It's worth noting that Bitcoin had already been following a bearish trend within the 4-hour timeframe and was correcting towards its support.
Given the intensified downtrend experienced by BNB, a crucial support range is observed within the $217-$200 bracket. This support level nearly aligns with the floor of the weekly channel range for BNB. If there are discernible signs of reaction and a change in trend within this range, particularly within the 4-hour period, it could potentially herald a positive fluctuation in the price of BNB. Traders and investors should closely monitor for any indications of bullish activity within this key support zone.
However, if selling pressure persists and there are no apparent signs of a shift in market sentiment, the support at $200 is at risk of being breached. In such a scenario, BNB's price may experience further decline, potentially reaching the ranges of $160-$150 and $114-$110. It is crucial to closely track market developments and assess the situation accordingly to make informed trading decisions.

BNB will be bearish for months!Hi, dear traders. how are you ? Today we have a viewpoint to SELL/SHORT the BNB symbol.
For risk management, please don't forget stop loss and capital management
When we reach the first target, save some profit and then change the stop to entry
Comment if you have any questions
Thank You

BNBBTC.1DHello dear friends,
*Mars Signals Team wishes you high profits*
This is a daily time frame analysis for BNBBTC.1D
We are in the daily time frame. As you can see, after hitting our resistance line several times, the price failed to consolidate above that line and moved towards your first support line. Now, we expect the price to support once again and this time after breaking the first resistance line, it can move towards our second resistance line. But if it fails to stabilize above our support line, there is a possibility of a fall to lower numbers.
Warning: This is just a suggestion and we do not guarantee profits. We advise you to analyze the chart before opening any positions.
Take care

Right back Where it Started From !! #BNBSEC suing exchanges right & left . SEC sued binance & Ceo of binance for operating illegal business in US ! Price of BNB Dropped 16% following on this news !!
Technically if we see #BNBUSDT chart its forming #BearFlag on Weekly time frame and now the price of BNB is at $260 and its breaking the trendline of the channel ! if weekly closed below the channel we can see a Sell off to $214 . $214 level of BNB is the most imp level to be hold ! if BNB failed to hold $214 There is higher probability that BNB will dump below $40 following the Bear Flag !!
Remember BNB haven't retested its Pre Pump levels ( 37$ ) while rest of altcoins are down 90% from the highs !!
@Crypt001337

BNB | funds are safu ?At press time, crypto market head bitcoin fell below $30K, resulting in selling pressure dumps BNB token price by 4.5% overnight, when the current price remains at HKEX:326 level. Meanwhile, the market capitalization of BNB reached HKEX:51 billion in the ongoing selloff. Buyers failed to keep BNB above the 9-day simple moving average, but the 21-SMA remains to be seen for a trend reversal. The pullback appears as a retracement phase before the next bullish run to HKEX:400 if the buyers defend the HKEX:310 support area. now lets talk about new upgrade
Binance will announce its upcoming BNB Beacon Chain (BEP2) network upgrade and Hard Fork on April 21.the upgrade will take place at an estimated 11:00 AM on April 21, 2023 at block height of 310,182,000. as part of the upgrade process, token deposits and withdrawals on the BNB Beacon Chain will be temporarily suspended from approximately 09:45 on April 21, 2023. Suspending is necessary to ensure that all transactions on the network are processing properly and the upgrade is successful.
BNB Beacon Chain is an Ethereum 2.0 compatible chain that allows users to stake Binance Coins to earn rewards and secure the network. The upcoming upgrade aims to improve the overall performance and security of the network.by supporting the upgrade, Binance helps ensure that the BNB Beacon Chain remains a solid and reliable network for its users.
After the options delivery ended today, the prices of BTC and ETH fell sharply we are in correction mode now
we heading to 325, 323 and 320. 315 and 305 is true war zone and good time for bulls to show who run the game
Be Bull , Be Cool

Bnb Not Looking good Consolidating In Bearish Flag In 3 days tf Incase Of Breakout expecting Move Towards 220 top 230$

BNBUSDT#BNBUSDT
#BNBUSDT in daily chart time-frame we have very important and strong support zone buy and hold it to the next targets at the chart i expect there will be a correction move RSI showing bullish EMAs showing a bullish move MACD is showing bullish Ichimoku cloud is neutral ZELMA is showing uptrend-moveA Accumulation distribution is bullish Fib retracement is neutral i expect the price will fly to the target at the chart

BNB/USDT 1DAY UPDATE BY CRYPTOSANDERSHello, welcome to this BNB/USDT 1DAY chart update by CRYPTOSANDERS.
I have tried to bring the best possible outcome to this chart.
Show some support, hit the like button, and follow and comment in the comment section. this motivates me to bring this kind of chart analysis on a regular basis.
CHART ANALYSIS:-BNB, or Binance coin, was also in the green to start the week, with prices moving to a multi-week high in the process.
Following a bottom at 307.53 on Sunday, BNB/USD rose to an intraday peak of 316.83 earlier today.
This surge saw BNB hit its highest level since May 9, when the token was trading above 320.00.
BNB is now trading 2% higher than at the same point last week, with today’s rally sending the RSI to its strongest reading since May 1.
In addition to this, the 10-day (red) moving average (MA) is also moving towards an upwards crossover with the 25-day (blue) MA.
Should this cross take place, there is a good chance that BNB will move towards a long-term ceiling at the 340.00 mark.
This is not a piece of financial advice.
Hit the like button if you like it and share your charts in the comments section.
Thank you

BNBusdt 1D Triangle Pattern Due to the uptrend line chart, the price has increased the price to the resistance area and has completed the triangle pattern.
Its not Buy or Sell SIGNAL
DYOR
BY : M.TeriZ - @AtonicShark

Short BNB to 276 $The chart is simple. In the case of a bearish market and Bitcoin moving towards $25,000 and below, the first support of Binance Coin is at the bottom of the daily ascending channel. You can open a sell transaction for Binance Coin with capital management if the $27,000 Bitcoin support is lost.

BNBUSDT DailyHi guys, Hope you well
We have two scenario for binancecoin. I agree with first that go down to daily demand .
SecondChanceCrypto
⏰27/April/23
⛔️(DYOR)
always do your research.
If you have any questions, you can write them in the comments below, and I will answer them.
And please don't forget to support this idea with your likes and comment

BNB $5000Binance coin (BNB) is the cryptocurrency of the largest volume trading crypto exchange Binance. BNB allows owners to receive significant discounts (25%) on trading fees within the exchange, participate in initial coin offerings, and earn income through staking.
The BNB price is heavily influenced by the success of the exchange and the popularity of cryptocurrency trading, which makes it quite volatile. In 2021, it was a very successful year for BNB, and the price rose from HKEX:40 at the beginning of the year to HKEX:690 at its peak, but then there was a decline.
In this regard, many investors wonder if it is worth expecting a repeat of this success?
For investors now, the key question is whether the BNB cryptocurrency is a good investment now, whether the growth of the cryptocurrency will return next year, or in the medium-term perspective of 3-5 years.
I have conducted an analysis and can say that it is definitely worth it:
There are no competitors, and we will not see any in the near future.
The coin trades in an upward channel (an example will be the TWT coin locally).
The coin has good tokenomics, and there is a burning every quarter.
New listings give an allocation.
There are many more factors to consider. Personally, I am actively buying BNB and recommend you to take a closer look at it.
My expectations are MYX:HUMEIND , mark this down.

BNB/BTC - BNB: Super_Trend◳◱ We've detected a Super Trend pattern on the CRYPTOCAP:BNB / CRYPTOCAP:BTC chart. The Super Trend indicator is showing a bullish trend, indicating a potential trend reversal. The next resistance key levels are at 0.011868 | 0.012264 | 0.013324 and the major support zones are respectively at 0.010808 | 0.010144 | 0.009084. We may consider opening a trade position at the current price zone at 0.011703 and benefit from the trend continuation.
◰◲ General info :
▣ Name: BNB
▣ Rank: 4
▣ Exchanges: Binance, Kucoin, Gateio, Hitbtc
▣ Category/Sector: Financial - Smart Contract Platforms
▣ Overview: Binance Coin is digital asset native to the Binance blockchain and launched by the Binance online exchange.
◰◲ Technical Metrics :
▣ Mrkt Price: 0.011703 ₿
▣ 24HVol: 678.958 ₿
▣ 24H Chng: 3.585%
▣ 7-Days Chng: -0.43%
▣ 1-Month Chng: 1.84%
▣ 3-Months Chng: 9.58%
◲◰ Pivot Points - Levels :
◥ Resistance: 0.011868 | 0.012264 | 0.013324
◢ Support: 0.010808 | 0.010144 | 0.009084
◱◳ Indicators recommendation :
▣ Oscillators: SELL
▣ Moving Averages: STRONG_BUY
◰◲ Technical Indicators Summary : BUY
◲◰ Sharpe Ratios :
▣ Last 30D: -0.49
▣ Last 90D: 1.06
▣ Last 1-Y: -0.07
▣ Last 3-Y: 1.45
◲◰ Volatility :
▣ Last 30D: 0.41
▣ Last 90D: 0.47
▣ Last 1-Y: 0.67
▣ Last 3-Y: 1.03
◳◰ Market Sentiment Index :
▣ News sentiment score is N/A
▣ Twitter sentiment score is 0.58 - Bullish
▣ Reddit sentiment score is 0.88 - V. Bullish
▣ In-depth BNBBTC technical analysis on Tradingview TA page
▣ What do you think of this analysis? Share your insights and let's discuss in the comments below. Your like, follow and support would be greatly appreciated!
◲ Disclaimer
Please note that the information and publications provided are for informational purposes only and should not be construed as financial, investment, trading, or any other type of advice or recommendation. We encourage you to conduct your own research and consult with a qualified professional before making any financial decisions. The use of the information provided is solely at your own risk.
▣ Welcome to the home of charting big: TradingView
Benefit from a ton of financial analysis features, instruments and data. Have a look around, and if you do choose to go with an upgraded plan, you'll get up to $30.
Discover it here - affiliate link -

BNB - LONGJust created a trend zone with support and resistance zones , im not giving you signals with where and when to Buy or sell.
You have all prepared, so just make it simple and follow the trend or wait for a breakout.

BNB-USD - Wait for broken patternWe have an upward trend, so at this moment I would expect a break in the trend and enter a SHORT.
RSI shows that BNB is overbought, which would make sense with a trend change soon.
Maybe an interest rate hike in MAY would bring some corrections to the crypto market.

We're ready, target 450Following weekly.
Weekly candle close will show us whether to go or not.
As following my 2 indicators, they're more likely to go long, so waiting for a blow up!
TP1 450
TP2 650
SL 286 - Wait for weekly candle close.

BNB NEW UPDATEHi, dear traders. how are you ? Today we have a viewpoint to BUY/LONG the BNB symbol.
According to the structure, we can imagine a FLAT correction for BNB, we have two buying areas. The target is specified. Invalidation level is also specified. If the price goes below the invalidation level and stabilizes below it in the daily time, this analysis expires
Comment if you have any questions
Thank You

BNB LONG SETUPHi, dear traders. how are you ? Today we have a viewpoint to BUY/LONG the BNB symbol.
For risk management, please don't forget stop loss and capital management
When we reach the first target, save some profit and then change the stop to entry
Comment if you have any questions
Thank You

bnb 4h analices✈️ BNB
⭕️I think it will go up to 327.8 to 332 and drop from there
🔴322
🔴316
🔴311
🔴305
🔴300
🔮 I also placed an order for you, you can use it
🟢ENTER 1: 327.9
🟢ENTER 2: 330.7
🔴STOP: 333.5
🔴LEV max: 20
💻Capital max: 5%

BNB Weekly Close - Only a personal opinion Only a personal opinion
Weekly close for BNB is still not a bullish indicator.
Area 320 appeals to me since there has been a lot of rejection there.
examine something else. when he gets back to area 320
If there is a pending, there is still a chance for additional drop, with the 290–282 area being supported by the atr indicator.

BNB Snipper Entry#BNB bounced back Excatly from my Daily Trend line. According to this it has done with retracement. We can try a Snipper entry with Stoploss just 1.38%.
Welcome to my channel! Here you'll find daily technical analysis of the latest trends in the crypto market. From Bitcoin to altcoins, I'll be sharing my insights and predictions to help you make informed decisions about your investments. Follow me for the latest updates and join the conversation in the comments!
Crypto technical analysis uses past price history to predict future price. It's not a guarantee and shouldn't be relied on solely for investment decisions. Consider other factors such as market trends, economic strength and information dissemination. Use with caution.

BINANCE imagine being bearish in BNB 😂Imagine being bearish in BNB lmao. Think of it anon, if BNB crashes crypto would be sent back to stone age. I've been a user on Binance platform for 7 years and I know enough to know this is all driven FUD by USA after FTX collapsed.
With that being said, knowing BNB is not going away after being put on the spotlight and gaslighted by american exchanges, powell, and the FED. Knowing its not going anywhere, Binance is going to be one big monster in the crypto industry which is what the FED did not want.
Once the fire settles, BNB will go to all time highs.
In a hypothetical scenario where Binance, one of the world's largest cryptocurrency exchanges, were to collapse, it could have significant effects on the cryptocurrency space. Here are three possible effects:
Decreased Liquidity and Volatility: Binance is one of the most liquid cryptocurrency exchanges in the market, meaning that it facilitates a significant amount of trading volume. Its collapse could lead to a decrease in liquidity and increased volatility, as traders may struggle to find buyers and sellers for their cryptocurrencies. This could lead to significant price swings, making it difficult for traders to manage their positions.
Loss of Investor Confidence: Binance is known for its security and reliability, and its collapse could lead to a loss of confidence in the cryptocurrency market as a whole. Investors and traders may question the security and reliability of other cryptocurrency exchanges and the underlying technology itself. This could lead to a decline in investment and a decrease in adoption of cryptocurrencies.
Regulatory Scrutiny: The collapse of Binance could lead to increased regulatory scrutiny of the cryptocurrency market. Governments and regulatory bodies may see the failure of a large exchange like Binance as evidence that the market is not mature enough to be trusted. This could lead to increased regulation, which could be detrimental to the growth and adoption of cryptocurrencies. Additionally, regulatory uncertainty could cause other cryptocurrency exchanges to be more cautious in their operations, potentially leading to decreased innovation and investment in the space.
