BNB 4H ResistanceBNB 4H resistance is at ~$250
Enter 50% at the current price
and try to set some sell orders near the resistance zone
If BNB stays below the trendline,
the Take-Profit target would be 5%, 10%, and 15% from your entry
Cheers
BNBBTC

BNB ANALYSIS#BNB UPDATE.
#BNB is currently trading in ascending triangle where blue box and pink line qare the resistance bnb is currently facing.For now bnb needs to close above the blue box area for upside move however if bnb loses the black line support then it might again test the net support level.

BNB/USDT -32% Down From Our Entry and Still Bearish#BNB/USDT Technical Update:-
$BNB currently trading around $248 and went down to $220
Which is -32% from our Analysis.
Hope you are happy.
Now I am expecting Still BNB is bearish and It can hit below $100
Which will be best entry zones.
Support:- $210/$80
Resistance:- $360
Please Like and Appreciate.

BNB POTENTIALLY BULLISH AS DEPOSITORS INCREASEBNB flips potentially bullish VS Bitcoin as deposits increase on binance as FUD becomes less effective. There are some huge shorts on BNB right now but if the FUD fails they will have to close, being they are already in profit its seems likely they will have to buy into the order book to close the positions. I have taken a small long on BNB. For more information lookup TMG Trades on a common video website.
Strong bullish divergence on the 1hr BNB chart.

BNBBTC 1DBNBBTc threatened to break through the MM200, but soon retreated and continued above the MM200. At this moment it is returning to the median of the Keltner channel. Allied to this, there are also negative rumors about Binance, which is causing many to sell their assets.
BNB continues with its great fundamentals and Binance resolving these small issues it returns to normal.
Here are the supports and resistances:
S: 0.01377 / 0.01218
R: 0.01588 / 0.0172

Bnb Support and Resistance Area. A pue buying OportunityIf market crash then a pure buying opportunity BNB.

BNB ANALYSIS#BNB UPDATE.
#BNB has lost the crucial support daily support which is at the the blue box area and has now become the resistance on daily.If bnb does not close above this resistance then we might more pullback and might test the next support on daily around 220

Binance Coin Analyze (12/04/2022)!!!
Binance Coin wasn't able to break the resistance zone.
I expect Binance Coin will go down to a heavy support zone again, and this zone can be a good chance for buying BNB for your portfolio.
Binance Coin Analyze, ( BNBUSDT ), Timeframe 2Days⏰.
Do not forget to put Stop loss for your positions (For every position that you want to open).
Please follow your strategy, this is just my Idea, and I will be glad to see your ideas in this post.
Please do not forget the ✅' like '✅ button 🙏😊 & Share it with your friends; thanks, and Trade safe.

BNBTC - Gartley Follow the trend. Need we say more? Follow the trend, investopedia and no one can tell you. It is what it is. Theres no time like now! Now is the time. The further the time way the bigger the risk. The time is now. :) <3 Downtrend in Favour! Be careful buyers. Buy and sell .. dont hold!

BNBNot financial advice.
The essence of investing & trading is the intelligent and patient preying on the greed, fear, impatience, addiction and ignorance of the majority. It's definitionally Darwinian.

BNB/BTC - prefer BTC over BNBI am not saying BNB is not prominent or bad.
I am just saying that BNBBTC seems like it broke the trend line, and headed downward.
Would prefer BTC over BNB for a while.

BNBUSD - sorry but you won't like itFirst of all, we would like to apologize if you are BNB bull and this trading idea made you shaking or you already have a panic attack.
But let's be honest now! BNB pumped like crazy and didn't give it back yet in the current bear market.
Is it impossible for BNB to drop to $45 area? Probably no. It would be 93 % drop. In 2019 bear market ETH dumped over 94 %.
In the current bear market there's a lot of FUDs around. We already saw FTX collapse, rumors about crypto.com insolvency and many more. It looks that CEXes are in trouble .
Perhaps we will see more FUDs regarding Binance and it would be a trigger for BNB price to dump heavily?
We believe that if BNB breaks down below 184$ and there are more / new FUDs around, the price may drop to 45$ again. There's literally no support anywhere between.
Many won't like this trading idea, but it is what it is.
Probably it will take some time to drop so low, but if the bear market for risk on assets were to continue , it will happen sooner or later.
From another hand we expect Binance to be a leader amongs crypto exchanges therefore $45 would be a golden opportunity for a long-term investment.

A shallow correction is expected from Binance Coin!BNB had a range trend during the last week. The support provided for Binance Coin in the $282-$275 range has had a positive reaction, and we can expect this range to have the power to reverse the trend in lower times. Therefore, considering a downward trend line on the last pivots and in case of breaking this trend line, we can expect the price to grow up to the targets of 310-315 dollars. We expect a more complete approach to the specified support range for the short term.
But in any case, due to the previous upward wave of BNB, which is considered a strong wave, a shallow correction is expected from Binance Coin. In terms of time, the corrective wave is nearing its end, and we can expect the continued growth of BNB price this week. Also, another point that can be a sign of price growth is the presence of a large number of bullish candles among the bearish candles of the corrective wave. Therefore, the ratio of these candles is equal, increasing the probability of buyers entering them.
Bullish on $BNB with a projection towards $883 by June 2022BNB is one of the coins that may rise up.
I have given a way forward towards $883 where retail FOMO may kick in for $1k mark.
However I think it would be too fomo to go as new after $883 (fib).
Shown ichi for projection. Can we get e2e to start with
Aladdin is bullish as well on 2day tf

BNB (BNB) - December 1Hello?
Traders, welcome.
If you "Follow", you can always get new information quickly.
Please also click "Boost".
Have a good day.
-------------------------------------
(BNBBTC 1W chart)
There are no support and resistance points as it is breaking ATH.
Therefore, it is expressed using trend-based Fibonacci expansion.
The key question is whether it can rise along a long-term uptrend channel.
The section where the rising power is lost is when it falls in the 0.009485-0.011 section.
-----------------------------------------
(BNBUSDT 1M Chart)
The key question is whether it can rise above 353.3 and break out of the downtrend line.
(1W chart)
The question is whether it can maintain the price above 284.8, following the uptrend line, moving up to or above the 332.4-353.3 zone.
If not, you need to make sure it is supported in the 179.2-233.9 section.
If BNB declines to around 179.2, we expect a good buying opportunity.
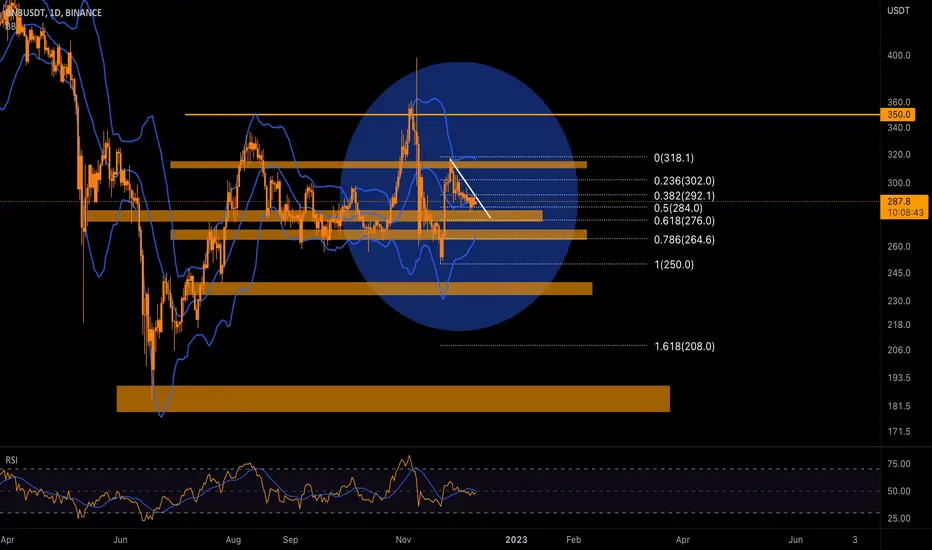
(1D chart)
The 297.5-316.1 section forms an important support and resistance zone.
Accordingly, the key is whether or not it can be supported in this section.
If it rises from the 297.5-316.1 section, it is expected to rise above 332.4.
If it falls below 297.5 and becomes resistance, a decline below 253.0 is likely.
-------------------------------------------------- -------------------------------------------
** All descriptions are for reference only and do not guarantee profit or loss in investment.
** If you share this chart, you can use the indicators normally.
** The MRHAB-T indicator includes indicators that indicate points of support and resistance.
** HA SRRC indicators are displayed as StochRSI (line), RSI (columns), and CCI (bgcolor).
** The CCI indicator is displayed in the overbought section (CCI > +100) and oversold section (CCI < -100).
(Short-term Stop Loss can be said to be a point where profit or loss can be preserved or additional entry can be made by split trading. This is a short-term investment perspective.)
---------------------------------

BNB 4H BUYBNB 4H support is at ~$286
Enter 50% at the current price
and try to set some BUY orders near the support zone
If BNB stays above the trendline,
the Take-Profit target would be 5%, 10%, and 15% from your entry
Cheers

What is needed to continue the upward movement!BNB has received a lot of attention due to the huge increase in transaction volume on the exchange and has registered a 25% growth within a week. The support level, which was considered in the range of $263-269, was fake broken in the last encounter. And with the break of the downtrend line in the 4-hour time frame, the price had strong growth. We can expect more price increases for the short term until the $300 support is maintained.
The resistance in the range of $315 can be broken, and the price increase can continue up to the level of $320-330. But to continue the upward movement of Binance Coin, it is necessary to completely break the resistance of 320-330 dollars and stabilize the price above this level. In this case, we expect the price growth to continue the upward movement to the level of $350. If the second resistance is also broken, the price trend in the daily time frame can be bullish. In this case, the potential for medium-term growth and reaching the previous ceilings in the weekly time frame will increase.

BNBBTC - BNBBTC vs BNBUSDT Possible trading opportunity against the overall market trend. If BNBUSDT can flip resistance into support that would be a nice start. Or if you started earlier, even better :p

BNB (BNB) - November 21Hello?
Traders, welcome.
If you "Follow", you can always get new information quickly.
Please also click "Boost".
Have a good day.
-------------------------------------
(BNBBTC 1W chart)
As long as it doesn't fall below the 0.013068-0.013926 range, I expect it to retain its upward force.
--------------------------------------
(BNBUSDT 1W Chart)
While falling significantly, it is falling below the MS-Signal indicator.
So, the question is whether the price can be maintained above 243.5.
(1D chart)
Around 267.2 is an important support and resistance point.
Therefore, it is important to be supported and able to ascend around this point.
If not, you should check for support around 243.5.
At 243.5, the HA-Low line of the 1W chart was formed, so it will be an important point to maintain the uptrend.
If it drops to the 179.2-2339 section, you should see if there is a sharp move.
This sharp move will be a very important move for price defense.
If you invest from a long-term perspective, I think you will have a good opportunity when it falls below the 179.2-2339 section.
-------------------------------------------------- -------------------------------------------
** All descriptions are for reference only and do not guarantee profit or loss in investment.
** If you share this chart, you can use the indicators normally.
** The MRHAB-T indicator includes indicators that indicate points of support and resistance.
** HA SRRC indicators are displayed as StochRSI (line), RSI (columns), and CCI (bgcolor).
** The CCI indicator is displayed in the overbought section (CCI > +100) and oversold section (CCI < -100).
(Short-term Stop Loss can be said to be a point where profit or loss can be preserved or additional entry can be made by split trading. This is a short-term investment perspective.)
---------------------------------

Strong reactive area!During the last week, BNB, like many altcoins in the market, has had a completely range trend. The price of this currency is again at the support level of 264 to 270 dollars, and an almost appropriate reaction was observed yesterday. But note that the overall market trend is bearish, and there is also the potential for another price drop for BNB. If the selling pressure increases and the current support breaks, the support range of $233-240 for this currency can be considered a strong reaction zone. But on the other hand, a break of the current support could send the price into a new bearish wave, which would indicate a reversal zone in the $179-$191 range.
Therefore, increasing selling pressure in the market can even lead to the breaking of the previous floor in the weekly time frame. If the candle closes below the 264 support area this week, with a very high probability, the previous floor could be the next target for sellers. For the short term and in the 4-hour time frame, we can see a range trend on the chart. A dynamic resistance has been broken to the upside, and given the positive divergence, we expect a short-term rally to the 283-290 resistance range. A break of the $290 resistance can be considered for a short-term uptrend.

#BNB/USDT DAILY UPDATE BY CRYPTOSANDERS!!Hello, welcome to this BNB/USDT 1DAY chart update by CRYPTOSANDERS.
I have tried to bring the best possible outcome to this chart.
Show some support, hit the like button, and follow and comment in the comment section. this motivates me to bring this kind of chart analysis on a regular basis.
CHART ANALYSIS:-Binance coin (BNB) rose to a five-month high to start the week, as cryptocurrency markets surged on Monday.
BNB/USD moved to a peak of $336.52 earlier today, which comes less than a day after trading at a low of $307.37.
Monday’s rise in price sees the token hit its highest point since May 9, when the coin was trading at $359.
Overall, BNB has now extended its recent bull run, with prices moving higher for a fourth consecutive day.
Despite recent hacks on a blockchain linked to Binance, its native token remains unscathed and has now risen by as much as $100 in the last ten days.
As a result of this, the 14-day relative strength index (RSI) has risen to overbought territory and is now tracking at its highest point since last April.
This is not a piece of financial advice.
Hit the like button if you like it and share your charts in the comments section.
Thank you

BNB Bearish Reversal (BNB/BTC)I am a fan of BNB longterm but the monthly/weekly charts on this pair look like they need to cooldown a bit after a huge run up, and the shooting star candle pattern indicates a potential bearish reversal. At lower levels I would definitely buy some BNB especially now that they have very little competition since the FTX situation.

BNB - breaking through the local highs.After the reversal formation through the zero point spring, we saw a breakdown of the upside of the trading range. At this point in time it is hard to predict the further direction of the price but most likely we will see the price going to test the buyer. It is also possible that the price will not retrace too much and the asset will continue to show positive dynamics from the upper boundary of the range.
If you like the idea, like this. That's the best "Thank you!" for the author 😊
P.S. Always do your own analysis before a trade. Put a stop loss. Fix profits in installments. Withdraw profits in fiat and make yourself and your loved ones happy.
