BINANCE COIN: BEARISH NOW! Do not long it!As we can see on the BNB/USDT chart, the Binance coin has entered beasish mode.
A strong trend line has been broken, which has also been retested, so that it is now likely to fall below this TL.
In addition, at this point is Fibonacci level 0.618, which is generally considered the most important.
The price is also reflected from the bottom edge of the EMA 100.
At the moment, we should not trade the Binance coin in the direction of Long.
The entire market is in an area of strong fear, according to the Fear & Greed Index.
Stay with us and you will be informed about further events in the crypto markets.
Don't forget to like and write a comment.
Happy trading, Alex_UCT
Bnbshort

BNB 2H BUYBNB 2H support is at ~$587
Enter 50% here
and try to set some buy orders near the support zone
If BNB holds above the trendline,
the Take-Profit target would be $616, $645, and $704
Cheers

Awesome fundamental info about | BNB BNBUSDT
_______
Hey , guys !
What's fundamental ?
Ok
So , we will see the killing of some coin by Binance Smart Chain with all transactions and it will be good for the price !
By technical we can see awesome trend , guys ! ; )
_______
Add the coin to you watchlist , guys !
____
Have an awesome profit and visit more of our idea here @Professional_Crypto_Analytics and alright follow us ; )
Best wishes ; )

BNB Short SetupI think BNB needs a good retracement as you see in the chart.
-Do your own research -

BNB 6H BUYBNB 6H support is at ~$575
Enter 50% here
and try to set some buy orders near the support zone
If BNB holds above the trendline,
the Take-Profit target would be $632.5, $690, and $805
Cheers

BNB USD is ready to fall!My TA on 1D shows that:
1. Price is at the top border of its red channel. I cannot foresee where it will hit its peak, but it would be plausible to go SHORT within 555-580 USD range. RSI index supports this peak, it is almost at 80 level. It may go above. However, while the price is still rising, the vertical volume is decreasing. Best to check MACD for further confirmation just to be on the safe side.
2. Take Profit 1 is best to take at the liquidity level. Currently it's around 38.2% on Fib along with the bottom border of a red channel.
3. The red channel is forming Wolf waves. If this is indeed the case, then exit and TP 2 will be around 430-420 USD, which is 53%-55% on Fib!

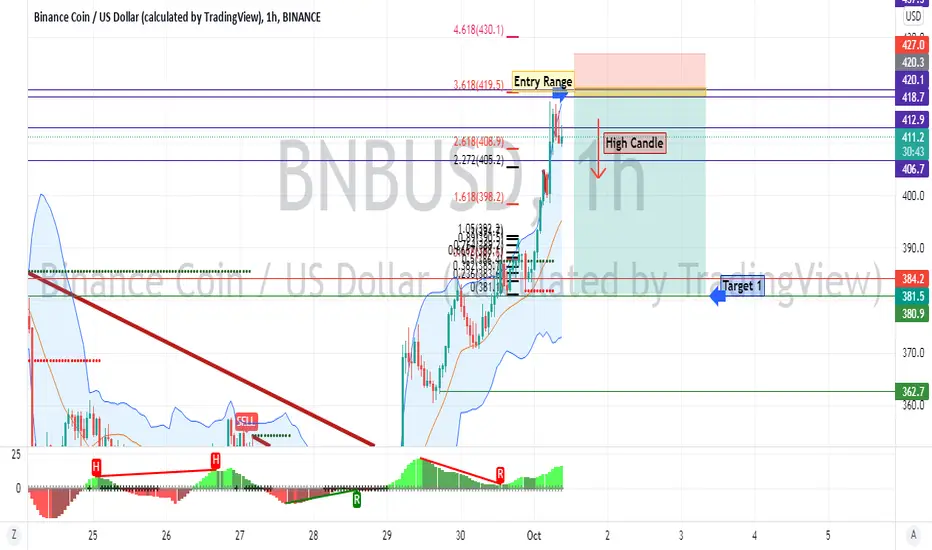
BNB next movesBNB is taking position for a last pump before to have big fall, also after that we can have big bearish candlestick (represented in chart with red arrow), so also EMA indicator shows that BNB is ready for this bearish move

BNB BEAR FLAG breakdownIn lower time frame 1 hr
bnb make a bear flag and bear flag breakdown
and bnb going to buy zone so don't miss this opportunity
buying 408$ to 399$
set your limit order right now

BNB bearish timeAs you can see in roundtrip its time now to look for a good entry for a short position, so as expected bullish one went very good and very accurate, so please plan properly a good entry after current Elliots wave cicle in 1H.
BNB shortthis note just for me. I'm researching by date.
I see every after that blue line. there is always a significant decrease.
blue line on 7 september, 15 september, 23 september, 10 october and 17 october.
the further back the date range the further away.
I think after october 3rd there will be another big sale.
I am confused why there is no number 4 on the blue line, straight from blue line 3 to blue line 5.
I think the farther the range of the blue line makes the candle go wild up and down. or just a boring side way.
I'm still trying to think that bnb will 211-217 before continuing to increase to 400 and above.
these are all just my thoughts. anything can happen. if i miss, no problem. if it's right, no problem.

bnbusdt/bnbshortBINANCE:BNBUSDT
Start the downward movement of the binance currency
Do not take a buying position

BNB In a Short SetupHi guys!
$BNB is in a triangle and since we are in a downtrend it could break from the bottom with a $377 target, this target exactly matches with 0.5 fib level (Daily). If this triangle is acting like a pennant, it could reach all the way down to $354 level or 0.382 fib level (second target)

BNB LONG Quick analysis 2hr chartBNB breaks the wedge we can see a bullish trend on BNB this analysis is on 2hr chart


bnb/usdtIn bnb chart we see trendline is good support for now and if bnb is failed to break 427 to 431 resistance area then we will see good support will be 404.. if break the resistance area and confirm the support above 431 then we will see bnb to 450...


BNB double topWe can see in 3h timestamp that bearish tendency is confirmed with double top pattern.

BNB bearish After cheched tendency lines I saw that BNB is not ready to broke this new tendency so, BNB is in a bearish incomplete channel

BNB SHORT IDEABNB SHORT IDEA. THESE ARE MY LEVELS TO TAKE MAJOR PROFITS ON BNB SHORTS. THESE ARE WEEKLY AND MONTHLY LEVELS WHERE I SEE INTEREST ON PRICE ATION. ENJOY!


BNB WYCKOFFHey traders,
I've spotted multiple accumulations on BNB in the past days, but we've looked much worse than BTC (take a look at my latest idea). We've been rejecting the breaker block which will act as our OTE and we really like grabbing the 0.5 fib level which I've annotated using a magnet icon. I expect to take some profits there and then as price hits the golden line.
As always like and follow if you found this analysis helpful and want more quality price action breakdowns in crypto.
Happy Trading all!

BNB USDT SHORT POSITIONIn rsi the downward trend is quite clear
Please do not forget to like and comment

BNB will cry!There is a scenario for BNB which says it's forming an A-B-C pattern.
After wave (C) completion of wave from a larger degree, downward wave will begin and it'll collapsing.
