"BNB Primed for a Pump – Thief Trading Mode Activated!"🚨 BNB/USDT HEIST PLAN – SWIPE THE BULLISH LOOT BEFORE COPS ARRIVE! 🚨
🌟 Attention, Money Makers & Market Robbers! 🌟
(Hola! Oi! Bonjour! Hallo! Marhaba!)
The BNB/USDT vault is CRACKED OPEN—time to execute the ultimate heist! 🏦💰 Based on 🔥Thief Trading Style Analysis🔥, here’s your lucrative robbery blueprint for the Binance Coin vs. Tether market.
🔐 MASTER PLAN: LONG ENTRY HEIST (HIGH-RISK, HIGH-REWARD)
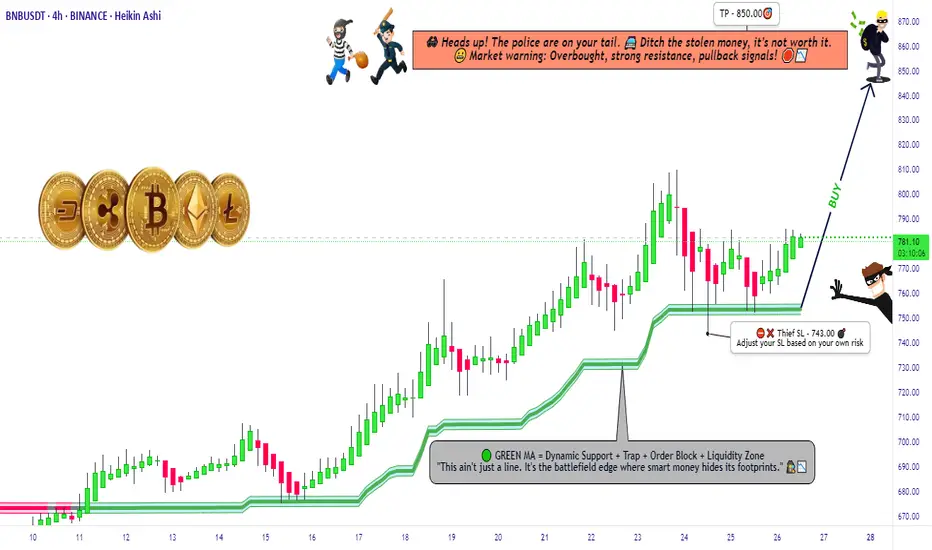
🎯 TARGET: 850.00 (or escape before the cops show up!)
🚨 POLICE TRAP ZONE: Overbought + Strong Resistance – Bears & cops are lurking!
💎 TAKE PROFIT EARLY & TREAT YOURSELF! (You’ve earned it, outlaw!)
⚔️ ENTRY STRATEGY: SWIPE FAST OR WAIT FOR THE PULLBACK!
🤑 VAULT IS OPEN! Enter any price if you’re bold (instant long).
🕵️♂️ SMART THIEVES: Use buy limit orders near 15M/30M swing lows/highs for a safer heist.
🛑 STOP-LOSS (ESCAPE ROUTE)
Thief SL: 743.00 (4H candle wick – adjust based on your risk tolerance!)
⚠️ WARNING: If the cops (bears) break in, DON’T HESITATE—RUN!
🎯 TARGETS & ESCAPE PATHS
Scalpers: Trail your SL & escape with quick loot! (Only long-side allowed!)
Swing Bandits: Hold strong but watch for police traps!
📡 MARKET INTEL (WHY THIS HEIST WILL WORK)
Bullish momentum in play! (But stay sharp—consolidation & reversals possible.)
Fundamentals, COT Reports, On-Chain Data, & Sentiment all hint at more upside!
🚨 TRADING ALERTS – DON’T GET CAUGHT!
📰 NEWS = VOLATILITY! Avoid new trades during major releases.
🔒 LOCK PROFITS! Use trailing stops to protect your stolen gains.
💥 BOOST THIS HEIST – STRENGTHEN THE SQUAD! 💥
🔥 Hit the LIKE & FOLLOW to support the robbery team!
🚀 More heists coming soon—STAY TUNED, OUTLAWS! 🚀
🎯 Trade Smart. Steal Big. Escape Faster. 🏴☠️
BNBUSDT
BNB WEEKLYHello friends🙌
🔊We are here with BNB analysis:
A long-term analysis that can be viewed as an investment, but in the long term, with patience and capital management...
You can see that after weeks of price suffering, a good upward move has now been formed by buyers, which has also caused a new ceiling to be set. Considering the market decline and the decline of most currencies, you can see that BNB is well supported and its price has suffered.
⚠Now, with the arrival of buyers, you can enter a long-term buy trade with capital management.
🔥Follow us for more signals🔥
*Trade safely with us*

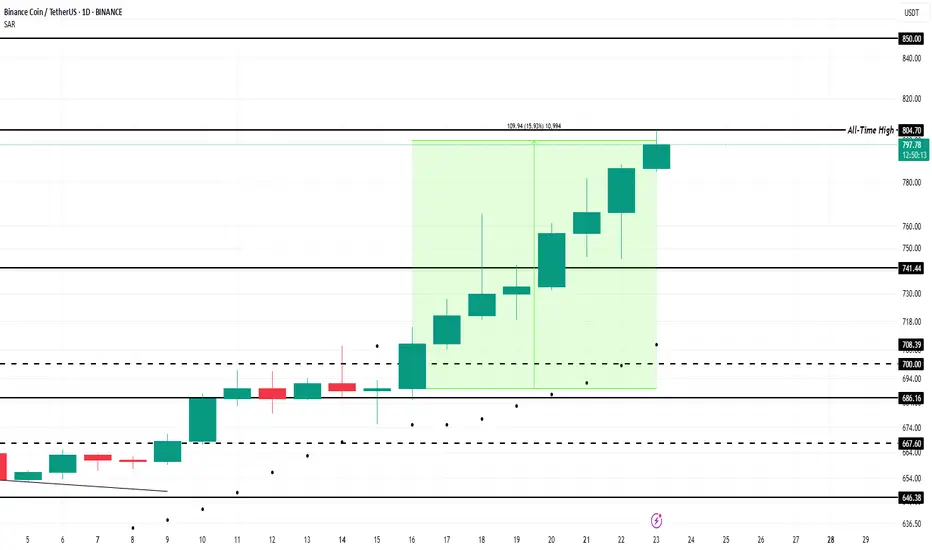
BNB Price Forms New All-Time High Above $800; Ends 7-Month WaitBINANCE:BNBUSDT price reached $804 today after a 16% increase over the past week, marking a new ATH . The altcoin has successfully ended a long period of consolidation and now stands at $799.
Its recent price movements indicate strong upward momentum, suggesting the potential for further gains. For nearly seven weeks, BINANCE:BNBUSDT has seen consistent accumulation . This trend is reflected in the exchange net position change, which shows growing investor interest in the altcoin
The bullish market sentiment is helping BINANCE:BNBUSDT break through key resistance levels. If this momentum continues, BNB could reach the $850 mark , a psychological milestone for the altcoin. This level could attract more investors and provide further price support, pushing BNB higher in the coming days.
However, should BNB holders decide to secure profits , the altcoin could face a price pullback. If selling pressure intensifies, BINANCE:BNBUSDT may slip below its current support level of $741 , which would invalidate the bullish outlook. A drop to this level would suggest a shift in sentiment, likely leading to a market correction.
Why BNB Remains Bullish and Its Next Potential Move !Currently,is forming an ascending triangle, indicating a potential price increase. It is anticipated that the price could rise, aligning with the projected price movement (AB=CD).
previous analysis
Stay Awesome , CobraVanguard.
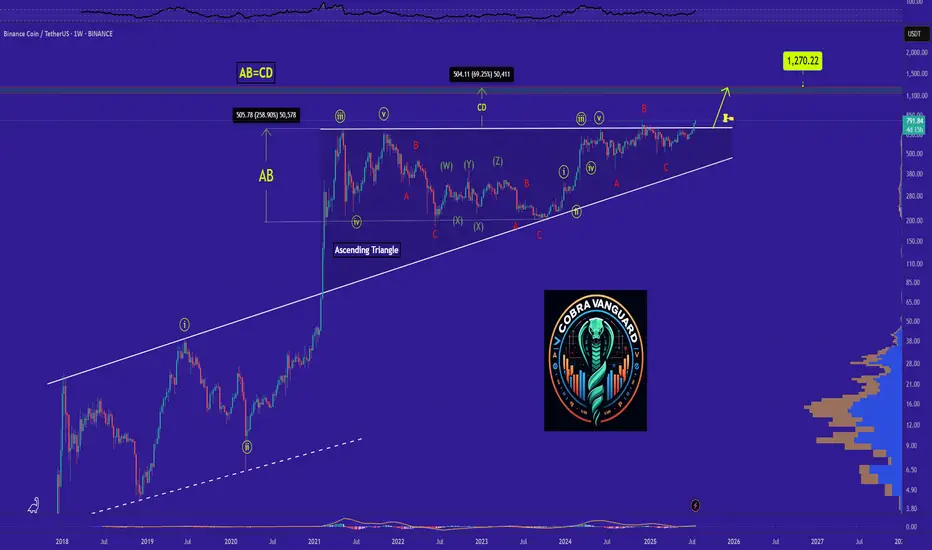
Can BNB reach around $1000 ?...The BNB is in a ascending triangle now which means the price will increase and also It is expected that the price would at least grow as good as the measured price movement(AB=CD)
Note: we should wait for the breaking of the triangle and than make a move!
See my first anaysis on BNB in 2020
✨We spend hours finding potential opportunities and writing useful ideas, we would be happy if you support us.
Best regards CobraVanguard.💚
_ _ _ _ __ _ _ _ _ _ _ _ _ _ _ _ _ _ _ _ _ _ _ _ _ _ _ _ _ _ _ _
✅Thank you, and for more ideas, hit ❤️Like❤️ and 🌟Follow🌟!
⚠️Things can change...
The markets are always changing and even with all these signals, the market changes tend to be strong and fast!!

Here I buy Binance Coin at $800Here I buy Binance Coin at $800
buy orders starting at $800
sell orders getting filled
binance coin supply shock is getting triggered
right now. Time to make binance coin great again
if sardines are thinking im done with altcoins, they are dead wrong
there are many to be bought still
THE THIRD GUY
t.I usher baby
hey, hey
hey what's happenin e'erybody
i hope they get my good siiiiide
you know i gotta look good when i walk out the house
you know i know the camera's following
i know they taking pictures, right drama?
ay man you watch it I live it you dig that
yall sit back relax get some popcorn man
im gonna make it a good show you dig that
this goin make a helll of a movie huh
my life your entertainmeeeeeeeeeent
you watch while I live iiiiiiit
i walk they follow
i talk they holla
just here for your amusemeeeeent
my life you entertainmeeeeent
you watch while i live iiiiit
you wait for me to lose it
I guess i'm just here for your amusemeeent
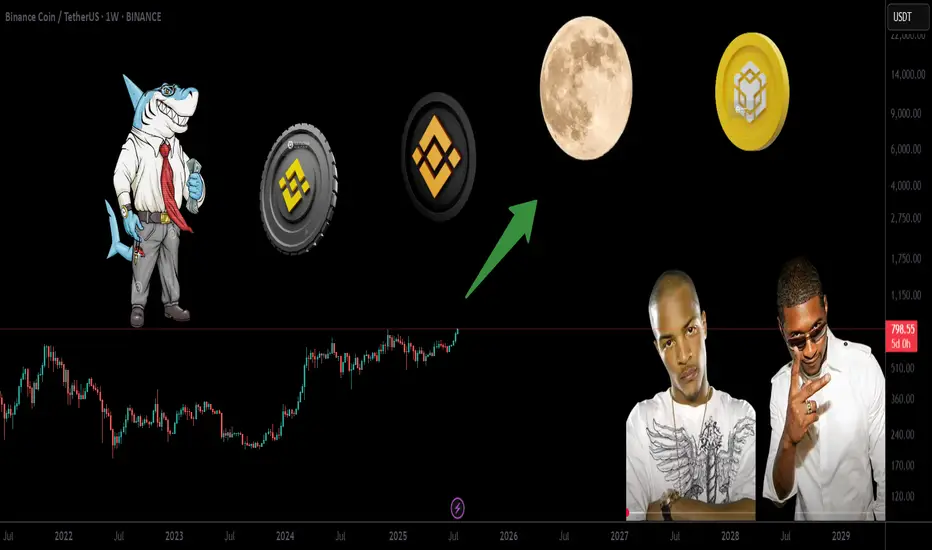
Massive Breakout Coming for BNB? Eyes on 1250, 1700, 2300 LevelsHello✌
Let’s analyze Binance Coin’s upcoming price potential 📈.
BINANCE:BNBUSDT , I expect an upward bullish trend in the long term.
I have three main targets in this analysis: $1250, $1700, and a final target of $2300. These targets could potentially be reached over a period of 2 to 6 years.
The price may form parallel channels along the way, which are shown on the chart. I also expect the current upward bullish channel to remain valid throughout this movement.
✨We put love into every post!
Your support inspires us 💛 Drop a comment we’d love to hear from you! Thanks , Mad Whale🐋
🐋Many of the points and levels shown on the chart are based on personal experience, feeling, and over 7 years of research and daily study of crypto charts.
Some of the lines, channels, and price zones are drawn to make the chart easier to understand and to help imagine possible future price movements.
I’ve also included one very big drop in price even bigger than the others because in the crypto market, it’s common for prices to suddenly fall hard and push out small investors and traders with positions.
The targets on the chart are not guaranteed; they might be reached, or they might not.📚

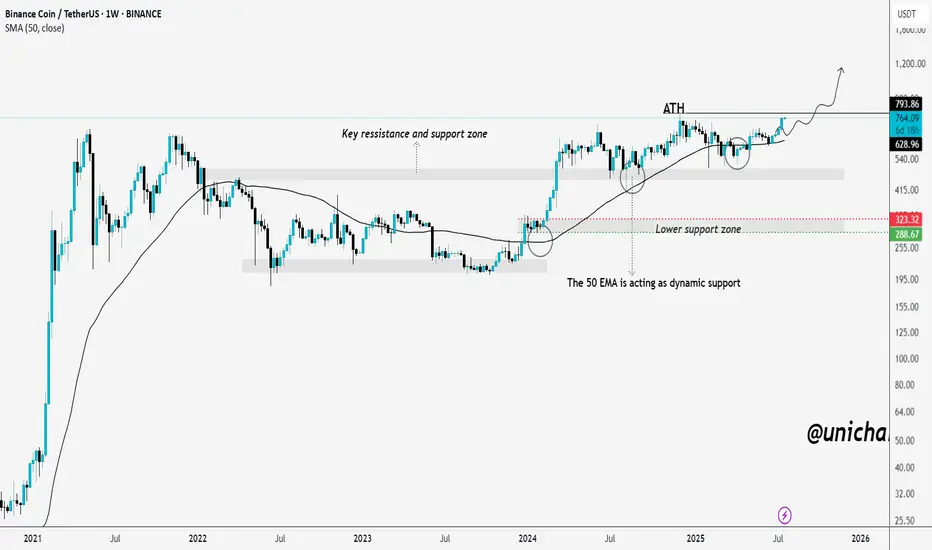
BNB on the Brink of a Breakout – ATH in Sight!We told you earlier — mark our words. BNB is now on the verge of breaking into a new all-time high, and the chart has been signaling this move for months.
The price has consistently respected the key support-resistance zone around $500–$540, and the 50-week EMA has acted as dynamic support throughout the uptrend.
Each dip into the lower support zone between $290–$320 was quickly bought up, showing strong buyer interest and demand. After several healthy consolidations and retests, BNB is once again approaching the previous ATH around $793.
If it breaks above with strong volume, we could enter price discovery mode. All the signs are aligning — and if you caught the early setups, you’re already in a great position. If not, it’s time to stay sharp and watch this breakout zone closely.
The momentum is real, and the fireworks might just be getting started.
THANKS
$BNB Is ready for $1k USDLow 700s before continuation?
This one’s been coiling up beautifully — still waiting on that strong move to hit.
OKX:CATUSDT and BINANCE:CAKEUSDT are part of the rotation I’m betting on.
BINANCE:BNBUSDT has one of the strongest consolidation structures among high caps — and it’s also one of the biggest laggards.
Looks like a setup worth the risk.

Binance Coin (BNB) to $780? Chart Says 5.8% Rally Incoming!BNBUSDT is currently showcasing a clear bullish structure, supported by consistent demand and a strong breakout beyond previous resistance zones. The price action has steadily evolved into higher highs and higher lows since July 10, confirming bullish market control.
After consolidating around the 707–710 USDT range, the pair decisively broke out, flipping this level into support. The price is now hovering near 736.50 USDT, holding its gains despite brief intraday corrections.
The ascending pattern that started from mid-July saw a short-term dip toward 675 USDT, but strong buying interest quickly stepped in. This bounce marked the formation of a new swing low, followed by a powerful rally above the previous resistance.
The recent long-bodied bullish candles reflect strong momentum and possible accumulation by larger players. Buy and sell signals shown on the chart further validate the demand zone around 674–691 USDT, where bulls aggressively defended support.
The breakout structure is now entering a price discovery phase, with room for a measured move toward the upper resistance near 780 USDT, which is both a psychological round number and the projected Fibonacci extension zone.
________________________________________
📍 Trading Setup (Based on Chart)
• Entry Price: 736.50 USDT (current market price)
• Stop-Loss: 725.00 USDT (just below the recent structure low and horizontal support)
• Take-Profit: 780.22 USDT (Fibonacci target + psychological resistance)
• Risk: 11.78 USDT (~1.60%)
• Reward: 42.94 USDT (~5.82%)
• Risk-Reward Ratio: ~3.65 — favorable for swing-long positions
________________________________________
🧭 Key Zones to Watch
The support zone between 707.54 and 691.35 USDT is now the major demand base. As long as BNBUSDT holds above this area, the bullish thesis remains intact. A retest of this level followed by a bounce would further strengthen the ongoing uptrend.
Immediate resistance is at 737.28 USDT, but the market is attempting to flip this level. If it holds as support on the next retest, upside continuation to 780.22 USDT becomes highly probable.
If bulls fail to defend the 725 USDT level, we could see a deeper retracement toward 707 or 691 USDT, but currently that risk remains low given the strength of the latest breakout.

Perfect Sync: V Reversal Meets Bull Flag
Two clean and classic technical structures:
✅ V-Reversal Formation
✅ Bull Flag – still active and building pressure
After a sharp reversal, the price entered a bullish continuation phase.
Currently moving within the flag structure toward its upper edge.
If we see a breakout to the upside, the move could match the flagpole length, which aligns well with the target from the V-reversal pattern.
📍 Bullish scenario remains valid as long as we stay within structure.
📉 Breakdown below $570 invalidates this setup.
🧠 Important Reminder:
Enter only after a confirmed breakout.
✅ Apply strict risk management
✅ Never risk more than 1% of your capital on a single position.
Everything’s clear. No noise. Just wait for confirmation — let the market come to you.

Why BNB Remains Bullish and Its Next Potential Move !Currently,is forming an ascending triangle, indicating a potential price increase. It is anticipated that the price could rise, aligning with the projected price movement (AB=CD).
However, it is crucial to wait for the triangle to break before taking any action.
Stay Awesome , CobraVanguard.

#BNBUSDT: A Major Bull Move Incoming $1000 Target! Binance coin is currently in consolidation phase, with no clear direction of where it will go. We consider two possible areas where it may reverse. Both of these areas have a chance to hit $1000, which we believe the price could head towards once reversed.
If you like our idea, please like and comment!
Good luck and trade safely,
Team Setupsfx_

Is BNB About to Explode—or About to Collapse?Yello Paradisers! Could this be the beginning of the next BNB rally, or just another classic trap to liquidate early longs before the real move begins? Let’s dive into this high-probability setup before it’s too late.
💎BNBUSDT is currently showing good signs of bullish continuation. The price has successfully broken out of a descending channel and performed a precise retest of that structure—an early confirmation of strength. Following this, we’ve seen a strong reaction from a Fair Value Gap (FVG) and the 200 EMA, both of which align perfectly with the inducement taken just before the bounce. This confluence of technical signals significantly increases the probability of a sustained bullish move in the near term.
💎If price pulls back from current levels, it could offer us a more attractive risk-to-reward opportunity for long entries. Traders who are targeting higher RR ratios, such as 1:2 or beyond, may prefer to wait for a deeper pullback into our predefined support zone for a cleaner entry. This zone remains critical for maintaining our bullish bias.
💎However, if the price breaks down and we see a full candle close below that support zone, the entire bullish scenario becomes invalid. In such a case, it would be more prudent to stay on the sidelines and wait for a clearer and more favorable price action setup to emerge before jumping back in.
We are playing it safe right now. If you want to be consistently profitable, you need to be extremely patient and always wait only for the best, highest probability trading opportunities.
MyCryptoParadise
iFeel the success🌴

$BNB Chart Showing Bullish Flag Pattern and Price Will Hit +$750CRYPTOCAP:BNB Previously Chart showing Bullish Inverse Head and Shoulder Pattern and Gain Profit of Range. It's a Reversal Pattern .
Now Chart Showing a Bullish Flag Pattern and it's Continuation Pattern. Time to Bullish for BNB Coin for FOMC 10th July Thursday 2025.
The upsloping 20-day EMA and the RSI just above the midpoint indicate a slight edge to the bulls. If the $665 resistance falls, the BNBUSD pair could rise to $675 and then to $698.
Sellers are likely to pose a solid challenge at $698 because a break above it could propel the pair to $732. I'm guess BNB Price Breakout of ATH and $888 Mystery will Happen.
This optimistic view will be negated in the near term if the price turns down and breaks below the moving averages. The pair may then drop to $636.
NEWSBTC: BNB Price Gears Up for Upside Break — Will Bulls Deliver?
BNB price is gaining pace above the $650 support zone. The price is now showing positive signs and might aim for more gains in the near term.
BNB price is attempting to recover from the $620 support zone.
The price is now trading above $655 and the 100-hourly simple moving average.
There is a key contracting triangle forming with resistance at $662 on the hourly chart of the BNB/USD pair (data source from Binance).
The pair must stay above the $655 level to start another increase in the near term.
BNB Price Eyes More Gains
After forming a base above the $620 level, BNB price started a fresh increase. There was a move above the $645 and $650 resistance levels, like Ethereum and Bitcoin.
The price even surged above the $660 level. A high was formed at $666 before there was a downside correction. The price dipped below the 50% Fib retracement level of the upward move from the $650 swing low to the $666 swing high.
The price is now trading above $655 and the 100-hourly simple moving average. On the upside, the price could face resistance near the $662 level. There is also a key contracting triangle forming with resistance at $662 on the hourly chart of the BNB/USD pair.
The next resistance sits near the $665 level. A clear move above the $665 zone could send the price higher. In the stated case, BNB price could test $672. A close above the $672 resistance might set the pace for a larger move toward the $680 resistance. Any more gains might call for a test of the $700 level in the near term.
Another Decline? If BNB fails to clear the $662 resistance, it could start another decline.
Initial support on the downside is near the $655 level and the 61.8% Fib retracement level of the upward move from the $650 swing low to the $666 swing high. The next major support is near the $650 level.
The main support sits at $644. If there is a downside break below the $644 support, the price could drop toward the $632 support. Any more losses could initiate a larger decline toward the $620 level.
Technical Indicators
Hourly MACD – The MACD for BNB/USD is gaining pace in the bullish zone.
Hourly RSI (Relative Strength Index) – The RSI for BNB/USD is currently above the 50 level.
Major Support Levels – $655 and $650.
Major Resistance Levels – $662 and $665.
#Write2Earn #BinanceSquareFamily #BinanceTurns8 #BNB #SUBROOFFICIAL
Disclaimer: This article is for informational purposes only and does not constitute financial advice. Always conduct your own research before making any investment decisions. Digital asset prices are subject to high market risk and price volatility. The value of your investment may go down or up, and you may not get back the amount invested. You are solely responsible for your investment decisions and Binance is not available for any losses you may incur. Past performance is not a reliable predictor of future performance. You should only invest in products you are familiar with and where you understand the risks. You should carefully consider your investment experience, financial situation, investment objectives and risk tolerance and consult an independent financial adviser prior to making any investment.

Skeptic | BNB Surge: Rocket Triggers for Spot & FuturesHey everyone, it’s Skeptic! 😎 Is BNB ready to rocket? I’m diving into a pro-level breakdown of Binance Coin (BNB), a top 5 crypto with a $92.9B market cap, now trending on CoinMarketCap with surging momentum. This analysis unpacks recent upgrades, ecosystem strength, and technical triggers for spot and futures trading, grounded in cycle-based strategies. Trade with no FOMO, no hype, just reason.
Recent Performance & Key Events
Binance Coin ( BNB ), trading at $ 660 with a $92.9 billion market cap, ranks among the top 5 cryptocurrencies globally. The Maxwell hard fork in recent weeks slashed block times to 0.75 seconds, boosting network speed and efficiency, adding $8 billion to the Binance Chain’s market cap. BNB powers the Binance ecosystem, supporting staking, NFTs, and DeFi projects. Despite regulatory scrutiny, ongoing platform expansion and token burn mechanisms sustain BNB’s utility and investor interest. Let’s dive into the technical setup for actionable trades. 📊
Technical Analysis: Cycle-Based Breakdown
The Weekly timeframe is range-bound, so lower timeframes drive price action. Let’s break it down:
Daily Timeframe
On the Daily, we had a primary uptrend within an upward channel, which broke downward. I cloned the channel and placed it below, and price has reacted well to the midline, still holding there. A midline break could drive price to the channel floor at $536.47. However, a V-pattern stands out as one of the strongest patterns. Why? It shows sellers broke support and consolidated below, but buyers overwhelmed them, pushing price back above support instantly. This signals immense buying pressure, liquidating shorts despite heavy selling—big respect to buyers! lol
💬 For spot trading , wait for BTC.D to turn bearish, as rising BTC.D means liquidity flows to Bitcoin, making altcoin buys less attractive. BNB/BTC turning uptrend is another confirmation—currently, BNB/BTC is bearish, so focus on Bitcoin for now. Check pair/BTC ratios to spot coins outperforming Bitcoin.
Key Insight: Volume and BTC.D/BNB/BTC confirmation are critical for spot buys to avoid low-liquidity traps.
4-Hour Timeframe (Futures Triggers)
On the 4-hour, for longs:
Trigger: Break of resistance at $ 664.69 , confirming the V-pattern. Validate with a volume surge on breakout and RSI entering overbought.
Short Trigger: If support at $ 637.46 breaks again, go short, as buyers may lack strength after exhausting their effort in the prior defense. Volume confirmation is essential.
Pro Tip: ALWAYS use volume to confirm positions. Without a volume spike, fakeout risk is high. Stick to 1%–2% risk per trade to protect capital.
Final Vibe Check
This BNB breakdown delivers precise triggers: long at $664.69 (futures with V-pattern confirmation), short at $637.46 (futures). With a range-bound Weekly and Daily V-pattern, volume and BTC.D/BNB/BTC signals are your edge. BNB’s Maxwell fork and ecosystem strength fuel its potential, but regulatory risks demand tight stops. Want more cycle setups or another pair? Drop it in the comments! If this analysis sharpened your game, hit that boost—it fuels my mission! 😊 Stay disciplined, fam! ✌️
💬 Let’s Talk!
Which BNB trigger are you eyeing? Share your thoughts in the comments, and let’s crush it together!

BNBUSDT Forming Bullish PennantBNBUSDT is showing an impressive breakout pattern that’s catching the attention of crypto investors and traders alike. Binance Coin has consistently proven itself as a top altcoin, and this breakout signals a strong shift in momentum that could push prices higher by 10% to 20% in the short term. The current surge in trading volume supports this bullish scenario, indicating that both retail traders and institutional players are positioning themselves for potential upside gains.
This breakout is not just a technical event — it’s underpinned by BNB’s robust fundamentals. Binance Coin remains one of the most utility-driven tokens in the crypto market, with use cases ranging from transaction fee discounts on the Binance Exchange to staking, launchpad participation, and even DeFi projects. As Binance continues to expand its ecosystem, the demand for BNB is likely to grow, adding fuel to this breakout rally.
For traders, the key is to watch for price stability above the breakout level and look for confirmation signals that the move is backed by sustainable momentum. Managing risk with clear stop-losses and profit targets will be crucial as the market reacts to broader trends and any news from the Binance ecosystem. With the current sentiment positive and buyers stepping in aggressively, BNB could be poised for another leg higher in its long-term uptrend.
✅ Show your support by hitting the like button and
✅ Leaving a comment below! (What is You opinion about this Coin)
Your feedback and engagement keep me inspired to share more insightful market analysis with you!

BNB Surge Incoming? Why Traders Are Watching $674On the 4H timeframe, BNBUSDT is showing a clear bullish structure with a consistent sequence of higher highs and higher lows since the low formed around June 23. Price action has gradually climbed, forming a well-respected ascending support base. This bullish momentum is further supported by the trend indicator (likely a custom moving average or Supertrend) that has shifted from red to blue and remained supportive of upside movement since late June. The recent consolidation just above the 651–652 support zone suggests that bulls are absorbing selling pressure before potentially pushing higher 📈.
What stands out is how price has broken above previous resistance near 659 and is now hovering near it, turning it into support. This is a textbook break-and-retest pattern, which adds to the bullish case. Buyers seem to be stepping in with confidence around this level.
Key levels are well-marked:
• Support Zone / SL Region: 651.18 – This area has been tested multiple times, making it a strong support and a good level to define risk.
• Resistance 1 / TP1: 674.03 – This is the next target zone, aligned with prior swing highs.
• Resistance 2 / TP2: 687.89 – A more ambitious target in line with broader continuation if momentum holds.
🔐 The current price at 662.07 shows signs of consolidation right above the support-turn-resistance level of 659.03. If the bulls defend this level successfully, continuation toward higher targets is likely.
Trade Setup Summary 🧾
• Entry: Around 662.07 (current market level, post breakout consolidation).
• Stop Loss: Just below the support zone at 651.18, giving enough breathing room while keeping risk controlled.
• Take Profit 1 (TP1): 674.03, a logical level of prior resistance.
• Take Profit 2 (TP2): 687.89, extended resistance zone from previous price action.
• Risk/Reward Ratio: Roughly 1:2.25, offering favorable reward compared to risk.
✅ Why This Trade Setup Makes Sense:
• Break-and-retest confirmation around 659 adds reliability 🔄
• Trend indicator is supportive of bullish momentum 📈
• Risk is clearly defined just below a major support zone 🛡️
• Room for upside toward TP2 offers good potential for reward 💰
Unless price breaks down below 651 with heavy volume, the technical structure remains bullish. If it dips to the support zone again, it might offer a second chance entry opportunity before heading to targets.

BNB Stuck in Barrier Triangle?CRYPTOCAP:BNB appears to be in a macro wave 4 barrier triangle, and for some time.
It has held up particularly well during the alt coin massacre, not even reaching the .382 Fibonacci retracement.
Price is testing the upper boundary for the 4th time, that starts to give us the higher probability breakout which increases with each test. The daily 200EMA and pivot were tested as support successfully.
Safe trading.

BNB Ready for PUMP or what ?The price could drop to the PRZ range and then rise toward the wedge's ceiling. If the wedge breaks, higher prices are not out of the question.
Best regards CobraVanguard.💚

HolderStat┆BNBUSD consolidated above the $650 levelKUCOIN:BNBUSDT is holding firm above 650 after breaking through a symmetrical triangle. The price structure is supporting a bullish continuation toward the upper resistance zone at 690–700. A clear uptrend is forming with tight consolidation along support, hinting at a breakout move.

BNB Price Today: Downtrend Ends As Bullish Momentum Strengthens
BNB is currently priced at $658 , showing resilience despite market volatility. However, it’s facing a micro downtrend this month. The positioning of the exponential moving averages (EMAs) below the candlestick indicates a potential bullish trend.
This pattern suggests that if BNB can maintain its current price, there could be an upward movement, making it a favorable outlook for investors despite the ongoing market uncertainty.
For BNB to regain bullish momentum, breaking free from the downtrend is key. A bounce off $646 support could help BNB target $667 , which has proven difficult since May.
The RSI remains above neutral, signaling growing buying pressure that could fuel the uptrend. A successful breach of $667 into support would confirm a more optimistic outlook for the coin.
If market conditions worsen, BNB risks dropping below the $646 support . In this scenario, the next levels of support at $628 and $615 would be tested.
A break below these levels could invalidate the bullish outlook, leading to further declines. Investors should stay alert to shifts in broader market sentiment.

BNB/USDT 1D🕵️♂️ General context
• Steam: BNB/USDT
• Price: 649.52 USDT
• Time: 1D (daily interval)
• Currently, the reflection is underway after the inheritance, but the technical situation remains uncertain.
⸻
📈 Trend and market structure
• You can see a previous strong drop (visible long red candles).
• Currently, reflection is underway to the level of technical resistance (approx. 650–672 USDT).
• A medium -term inheritance trend is still in force - marked with an orange interrupted line of decreasing (inheritance) trend.
⸻
📊 Technical levels
🔹 Opora (green levels):
1. 651.01 USDT - the first tested resistance (current price right next to it).
2. 672.68 USDT - another resistance, above SMA (2), historically strong level of sales.
3. 700.81 USDT - strong psychological and technical level, tested in the past.
🔻 Support (red levels):
1. 636.40 USDT - short -term support (price maintaining just above this level).
2. 625.65 USDT - key support - if it is broken, a possible test of lower levels.
3. 607.62 and 595.27 USDT - subsequent support, where purchases appeared earlier (Long Knoty).
⸻
📉 Technical indicators
🔵 MacD
• Histogram comes out of red - a potential signal of Momentum change to upward.
• The MacD line begins to turn up to the signal line - possible Bullly Crossover soon (buy signal).
🟣 RSI
• RSI oscillates around line 40-50-it is a neutral zone with a slight tilt down, but RSI-Based has a possible reflection.
• Lack of purchase or sale - suggests that traffic can go both ways.
⸻
🔃 Medium walking (SMAS)
• The price is tested by several medium (green, red, blue line):
• SMA (1) and SMA (5) are similar and flat - no clear short -term trend.
• SMA (2) acts as a strong resistance at 672 USDT.
• Need to break out over 672.68 to recognize that the trend can turn around.
⸻
✅ Applications - technical scenarios
🔼 Bullish (upward) scenario:
• Crossing the level 651–672 USDT and closing the daily candle above.
• Confirmation by RSI> 50 and MacD crossover.
• Target: 700–710 USDT.
🔽 Bearish (inheritance) scenario:
• Price rejection with current resistance and descent below 636 → 625 USDT.
• If 625 falls, a possible drop in around 607/595 USDT.
• RSI may then fall into the sale zone.
⸻
🧠 Neutral / swing strategy
• Currently, the market in potential consolidation between 625 and 672 USDT.
• You can consider:
• Buying at the lower consolidation limit (625–636) with a stop-loss below 620.
• Short or Take Profit at the upper limit (670+) until it breaks out.
