BNB/USDT 4HInterval Chart ReviewHello everyone, let's look at the 4H BNB to USDT chart as we can see that the price is moving below the local uptrend line.
Let's start by setting goals for the near future that we can include:
T1 = $586 at which the price is struggling to maintain
T2 = $615
T3 = $636
AND
T4 = $663
Now let's move on to the stop-loss in case of further market declines:
SL1 = $563
SL2 = $527
AND
SL3 = $503
Looking at the RSI indicator, it indicates a potential change in direction, but with room to make another upward move. However, on the STOCH indicator we are moving above the upper limit, which causes the growth to slow down and a possible recovery.
BNBUSDT

BNBUSDT - This ALT flashes Strong BULLISH Signals 📈📉Hi Traders, Investors and Speculators of Charts📈
BNB / Binance coin is another altcoin with good upside potential for the next bullish cycle. I expect this to come into full force only after the BTC halving.
Looking at the clear bottom followed by a bullish flag pattern, it seems highly likely that BNBUSDT may make higher-highs for the short term.
It's impressive to see that BNB mid-range support held, this shows a sign of strength from buyers. Around this zone the price ultimately made the inverse Head and Shoulders bottom pattern:
A little closer look in the daily, we see the bullish flag pattern forming. A breakout UNDER will invalidate the pattern:
From a technical indicator perspective, we see two strong "BUY" signals flash in the weekly timeframe, confirming a bullish bias:
If you found this content helpful, please remember to hit like and subscribe and never miss a moment in the markets.
_______________________
📢Follow us here on TradingView for daily updates📢
👍Hit like & Follow 👍
CryptoCheck
BINANCE:BNBUSDT BINANCE:BNBUSDT.P CRYPTO:BNBUSD

Binance Coin can reach resistance level and then start to fallHello traders, I want share with you my opinion about Binance Coin. By observing the chart, we can see that the price some time ago started to trades in a range, where it first made a fake breakout of the 548 support level, which coincided with the buyer zone and then in a short time backed up. After this, BNB continued to move up and reached the 598 resistance level, which coincided with the top part of the range and seller zone, after which it rebounded and fell below. Then price made a strong impulse up, thereby exiting from the range and breaking the 598 resistance level. After this movement, BNB even rose higher than the seller zone, but when it reached the resistance line, the price at once turned around and started to fall. In a short time, BNB declined lower 598 level, breaking it one more time, and later fell to the support level. AS well then, the price rebounded from this level and started to move up to the resistance line. At the moment, BNB trades very close to this line and in my opinion, Binance Coin can break this line and reach the resistance level, after which BNB will turn around and fall below the resistance line. So, for this reason, I set my target at the 565 level. Please share this idea with your friends and click Boost 🚀

Binance Coin BNB Technical Analysis [April 2024]BNBUSD Weekly Chart Conditions for a Bullish Scenario
In the weekly chart, BNB is lingering around the key weekly support zone at $577 (or the range of $563-$597).
It has to maintain the price action and weekly candle closures above this zone, preferably above $597 to remain in the bullish territory.
A price consolidation above $597 will push BNB towards the next weekly resistance zone around $509 and, possibly, higher to $738-$800, the new All Time High.
A weekly candle closure below $577 zone (or below the bottom of the zone at $563) in the weekly chart will not necessary make Binance Coin bearish, but will:
1. place BNB price into the wide weekly range zone where we will see slow and choppy price action; and
2. increase probability for a further decline towards $509 and, most likely, lower to $440 region, the key weekly support.
BNBUSD Daily Chart Conditions for a Bullish Scenario
In the daily chart, Binance Coin has to maintain the price action above the zone around $589 (marked grey) to become bullish to move towards the key daily resistance of $717 and higher towards $830.
Binance Coin price can decline more from its current location towards $534.
A bearish break-out of this level will push the price towards $480.
The price action with $480 will be very important as a rejection of this support will lead to a bullish move towards $589 and could complete the ABC correction started on March 16.
Once the bearsih pullback in BNB price chart is completed, I expect to see a continuation of a bullish rally.
A strong bullish break-out of $589 from its current price location is not very likely and BNB has to complete the corrective structure (triangle, flat) before moving further up.
However, the completion of this corrective structure could be very fast.
BNBUSD Daily Chart Conditions for a Bearish Scenario
Right now the sentiment in the daily chart is neutral and it will remain neutral as long as BNB is trading below $589.
A deeper pullback is likely and the price action with $480 zone will be very important.
A bearish break-out of the key support zone around $480 and the dynamic support in the form of 50-Day Moving Average will place BNB into the bearish territory and we see an impulsive move towards $421 and, lower, to the key daily support zone at $352.
As long as BNB is trading above $480, the bearsih scenario is irrelevant.
Binance Coin BNB: A Short-Term Price Action
After testing the top of the second key support zone at $539, BNB found a base in the between $552 and $561.
Yesterday, we saw a bullish reaction to this support zone, which is an expected price action.
BNB price can push back to $586, the key intraday resistance.
The price action with these resistance level will be very important.
A bearish rejection of either of these levels could send price for a re-test of the second zone between $529 and $539, and possibly even lower to $504.
In the alternative scenario, we need to see a strong bullish break-out of $586.
In this case, the price will move to $607.
BNB will become bullish in the 4-Hour chart only upon reclaiming $607 level.

BNBUSDT.4HAnalyzing this Binance Coin (BNB) to Tether (USDT) chart, I'll provide my perspective as a trader looking at the technical setup on a 4-hour time frame.
Firstly, I'm taking note of the overall trend that Binance Coin has experienced on this chart. The price is trending below the Ichimoku Cloud, which suggests a bearish environment for BNB in the short term. The Ichimoku Cloud is a comprehensive indicator that provides an instant view of the market sentiment, trend, and strength by comparing current price to the average price level.
The Conversion Line (blue) is below the Base Line (red) within the Ichimoku setup, which typically indicates bearish momentum. However, it seems the price might be attempting to cross back above these lines, which could signal a shift in momentum if confirmed.
Looking at the pivot point levels marked on the chart, we can see the current price is trading between the pivot point support S1 and resistance R1. A pivot point and its associated support and resistance levels are often turning points for the direction of price movement. The price currently hovering between these levels suggests a decision point for the future direction of BNB's price.
The Relative Strength Index (RSI) is at 34.12, which is close to the oversold territory (below 30). This can often indicate that the asset might be undervalued and could potentially see a reversal or at least a pullback to the upside.
The Moving Average Convergence Divergence (MACD) is showing the MACD line just below the signal line, with the histogram bars pointing downwards in negative territory. This indicates that the bearish momentum is still present, although we should watch for any crossover above the signal line as a potential early sign of bullish momentum.
To sum up, the current technical setup in BNB/USDT on this chart shows a bearish trend with potential signs of a reversal in the near term. I would keep a close eye on the Ichimoku Cloud for any price movement above the cloud which would be a bullish signal. Additionally, any crossover of the MACD line above the signal line or an RSI move above the 30 level might indicate increasing bullish momentum. As always, it's important to look for confirmation and be prepared for the possibility of false signals. Proper risk management and a well-thought-out trading strategy are crucial.

HelenP. I Binance Coin can rebound up from trend line to $590Hi folks today I'm prepared for you Binance Coin analytics. If we look at the chart we can see how the price a not long time ago rebounded from the trend line and reached the 516 support level, which coincided with the support zone, after which broke this level. Then BNB made a retest and made a strong impulse up to the resistance zone, which coincided with the 618 resistance level, but at once rebounded down, after which in a short time backed up to the resistance zone. After this movement, the price rose a little higher than the resistance zone, turned around, and started to decline to the support zone. When BNB fell to this zone, it at once turned around and in a short time rose back to the resistance level. But when the price reached the 618 level, it at once rebounded and a not long time declined to the trend line, after which bounced from this line and started to rise. So, now I expect that Binance Coin will decline to the trend line and then rebound up, therefore I set my target at the 590 level. If you like my analytics you may support me with your like/comment ❤️

Inflation Deflator Indicator Signals Sell for $BNBID has printed two 4h sell signals. The price has retraced to sell signal candle and supply zone formed at this price. We should get a hard rejection off this area to the previous swing low/demand zone.

BNB Down TargetI believe a channel will be formed from here which may give Target upto $350 in upcoming days for BNB

BINANCE - Back Down To 200... Yes yes, we know... this is rather a glum view of the market BUT, we'd rather be open to every possibility so that we're not taken by surprise.
According to Elliott Wave Theory, it's often the case that if Wave 2 is a simple correction, wave 4 turns out to be a complex correction. This seems to be what we're seeing right now. Wave 2 was a simple ABC correction and now wave 4 appears to be a flat (or maybe a zigzag correction). If we pierce the highs, it's likely it's a flat correction. If we stay below the highs, it may be a zigzag.
For confirmation that we're moving towards the 200 mark, we'll be watching for the break of the red trendline to indicate that bears have stepped in.
It'll be a no brainer to buy around the 200 mark as we're expecting the next wave to reach above 1k!
Goodluck and as always, trade safe!

BNBUSDTBNBUSDT, from my perspective, is a currency that I believe has potential on a medium-term basis. I have identified key resistance areas that are likely to turn into support once reached, and the price should respect these levels during corrections.
Please note that trading is done at your own responsibility; the above is merely my opinion.

Binance Coin can break resistance level and continue to riseHello traders, I want share with you my opinion about Binance Coin. Observing the chart, we can see that the price Some time ago declined to 355 points, after which started to trades in an upward wedge, where it rebounded from the support line and made a strong impulse up to the 500 support level, which coincided with the support area. Soon, the price broke this level and continued to rise to the resistance level, which coincided with the seller zone, but when BNB reached this level, it at once fell below and then rose to the resistance line of the wedge, after which made a downward impulse to support level, making fake breakout of 619 level. Then the price bounced from this level and started to move up near the support line of the wedge until it reached the resistance level again. After this, BNB rolled down and now trades close resistance line of the wedge. So, in my opinion, Binance Coin can rebound from the support line and reach to resistance level. After this, the price can break this level, thereby exiting from the wedge and continuing to grow, therefore I set my target at the 660 level. Please share this idea with your friends and click Boost 🚀

BNB about to melt faces !BNB / USDT
BNB is forming a huge accumulation zone 2021-2024 like the previous one between 2018 - 2021
Breakout here and i see you above 2000$

BNB/USDT About to Escape an Ascending Triangle? 👀🚀BNB Analysis💎Attention Paradisers! The #BNBUSDT chart is hinting at a potential surge. We’re locked onto a crucial support line within an ascending triangle at $561.9.
💎If the support holds, the asset will just ignite a bullish charge towards the $647 resistance mark and possibly climb higher.
💎If #BinanceCoin falters here. We’ve got a safety net at the $502 support zone, famed for its market magic. This area has often shown impressive rallies and painted the chart with vibrant green strokes for $BNB.
💎Slipping beneath this vital line will mean shifting gears to a bearish phase, marked by a rush of sales. Stay alert and adaptable as we navigate the twists and turns of the #BNB trading adventure.

HelenP. I Binance Coin can break trend line and fall to $560Hi folks today I'm prepared for you Binance Coin analytics. A not long time ago price declined to the 598 resistance level, which coincided with the resistance zone, and in a short time broke it. After this, BNB continued to decline to the 535 support level, which coincided with the support zone and also broke this level too and fell to the trend line. After this, the price turned around and made an impulse up from the trend line to 585 points, thereby breaking the 535 support level. After this movement, BNB made a correction to the support level and then continued to move up to the 598 resistance level. When the price reached this level, it at once rebounded and declined to the trend line, after which, a not long time ago bounced and continues to move up near this line. For my mind, Binance Coin will reach the resistance level again, after which the price can rebound and decline to the 560 level, breaking the trend line. If you like my analytics you may support me with your like/comment ❤️


BNB/USDT 4HInterval Chart ReviewHello everyone, let's look at the 4H BNB to USDT chart, as we can see that the price is staying above the local downtrend line, but at the border of the uptrend line.
Let's start by setting goals for the near future that we can include:
T1 = $589
Next, there is a strong resistance zone from $613 to $646.
After going up, we may see a price increase towards $739.
Now let's move on to the stop loss in case of further market declines:
SL1 = $542
SL2 = $506
SL3 = $468 to $417 zone
AND
SL4 = $417
Looking at the RSI indicator, you can see that it remains below the downtrend line and indicates a transition into a downtrend. However, the STOCH indicator is approaching the lower limit, but there is still room for a greater decline.

BNBUSDT - Price can exit from channel and fall to support levelHi guys, this is my overview for BNBUSDT, feel free to check it and write your feedback in comments👊
Some time ago price started to trades in wedge, where at once made upward impulse from support line.
After this, BNB broke $537 and $611 levels, but soon made a correction, after which it soon rose to resistance line.
Next, price in a short time declined to support line of wedge, thereby breaking $537 and $611 levels one more time.
Then BNB turned around and later exited from wedge also, after which started to move up in rising channel.
In channel, price rose to $598 points, but recently it fell to support line, where at the moment trades near.
Now, I think that Binance Coin can little grow and then decline to $537 level, thereby exiting from channel.
If this post is useful to you, you can support me with like/boost and advice in comments❤️
BNB - Holding Strong and Ready for next moveBINANCE:BNBUSDT (4H CHART) Technical Analysis Update
BNB is currently trading at $317 and showing overall bullish sentiment
We are seeing nice 1D candle which is showing a bullish sentiment. We can expect the trend to continue until 340$ and we can see some resistance at that range.
Once BNB breaks the 340 range then next target is an easy 400$
Entry level: $310-317
Stop loss level $280
Target 1: $ 337
Target 2: $ 374
Target 3: $396
Target 4: $448
Max Leverage: 2x
Don't forget to keep stop loss.
Follow Our TradingView Account for More Technical Analysis Updates, | Like, Share and Comment Your thoughts.
Cheers
GreenCrypto

BNBUSDT: Riding the Bullish Wave with Strategic Analysis"In the dynamic world of cryptocurrency trading, identifying patterns and key zones is essential for navigating market trends effectively. One such pattern that often signals a bullish trend reversal is the W pattern, characterized by a double bottom formation. Within the context of BNBUSD trading, the emergence of a W pattern signifies a potential shift from bearish sentiment to bullish momentum.
At the heart of this pattern lies the main buy zone and order block zone, where whales and significant investors strategically position themselves to capitalize on favorable market conditions. In the case of BNBUSD, this critical zone is observed between $528 to $524. Within this range, market participants identify a convergence of factors that make it an attractive accumulation area.
The $528 to $524 range represents a level of significant support, where historical price action suggests increased buying pressure and a reluctance of sellers to push the price lower. As the price approaches this zone, traders and investors perceive BNB as undervalued, prompting increased buying interest and positioning for potential price appreciation.
Moreover, within this buy zone, the presence of order blocks further solidifies its significance. Order blocks are areas on a price chart where significant buying or selling activity has occurred, often leaving behind a "block" of orders yet to be filled. In the context of BNBUSD trading, the $528 to $524 range represents a notable order block zone, indicating substantial buying interest from whales and large institutional investors.
The strategic accumulation of BNB within this zone is driven by the anticipation of future price growth. Traders and investors recognize the potential for a bullish reversal following the formation of the W pattern, with the $528 to $524 range serving as a launching pad for upward momentum.
It's important to note that the significance of this buy zone extends beyond mere price levels. It reflects a collective sentiment among market participants, including whales and institutional investors, who strategically position themselves to capitalize on future price movements. Their accumulation within this zone not only provides support for the price but also signals a vote of confidence in the long-term prospects of BNB.
In conclusion, the W pattern observed in BNBUSD trading signals a potential bullish trend reversal, with the main buy zone and order block zone identified between $528 to $524. Within this critical range, whales and significant investors strategically accumulate BNB in anticipation of future price appreciation. By recognizing the significance of this zone and understanding the dynamics at play, traders can make informed decisions to capitalize on potential opportunities for profit.

BNB?USDT 1HInterval Chart ReviewHello everyone, let's take a look at the 1H BNB to USDT chart, as we can see the zena is staying above the upward trend line, and locally we can see an upside exit from the triangle.
Let's start by setting goals for the near future that we can include:
T1 = $570.8
T2 = $592.50
T3 = $608.4
AND
T4 = $627.6
Now let's move on to the stop-loss in case of further market declines:
SL1 = $547.1
SL2 = $535.3
SL3 = $514.6
AND
SL4 = $482.4
Looking at the RSI indicator, it can be seen that it has returned to the upward trend, with room for a possible continuation of growth. However, on the STOCH indicator we can see that it is approaching the upper limit, but it also has some room before recovery.

BNB Price Action Trading- BNB sound dangerous with all the FUDs made by US government.
- But Binance is still from far the first exchange in the world by liquidity and trades volumes.
- they won't let go BNB so easily.
- it's still an easy trade for now if u play it wisely, and with strategy.
- No Danger, No Glory.
--------------------------------------------------------------
Trading Parts
--------------------------------------------------------------
- Buy : 200$ ish
- TP1 : Before 350$
- TP2 : Before 650$
--------------------------------------------------------------
- Stop Loss : 170$ ( don't touch anything under 170$ )
--------------------------------------------------------------
- Rebuy a big Dip : 50$ ish
--------------------------------------------------------------
Happy Tr4Ding !

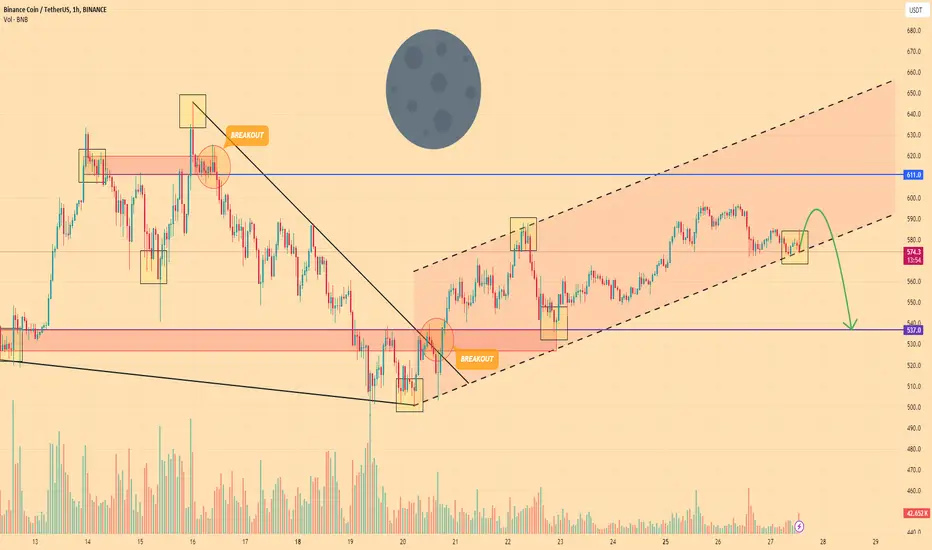
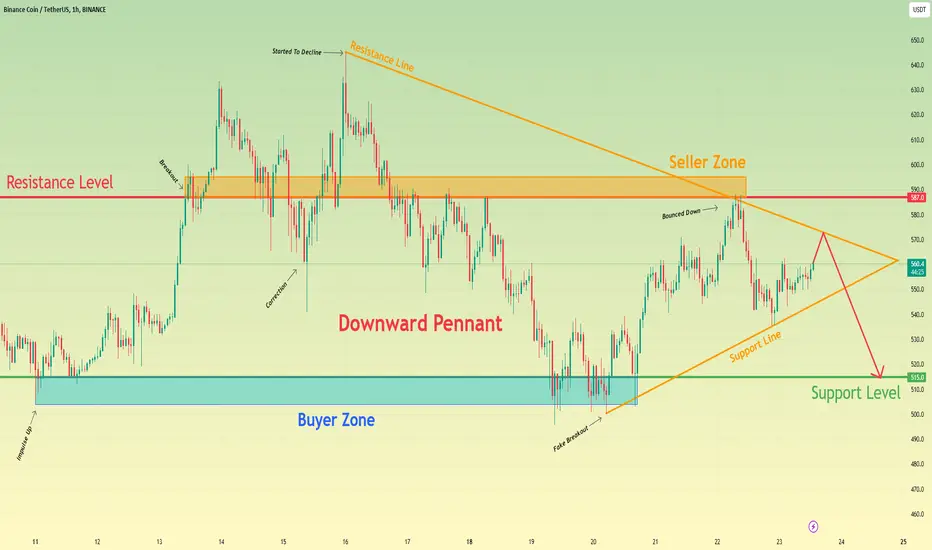
Binance Coin can exit from pennant and decline to 515 levelHello traders, I want share with you my opinion about Binance Coin. Looking at the chart, we can see how the price some time ago declined to 515 support level, which coincided with the buyer zone and at once rebounded and started to move up. Soon, the price reached a resistance level, which coincided with the seller zone and broke it, after which BNB rose a little and then made a correction below this level. Next, the price broke the 587 level again and later rose to 645 points, after which it turned around and started to decline in a downward pennant, where soon broke the resistance level one more time. After this movement, BNB made a retest of the resistance level and in a short time declined to the buyer zone, which later reached the support line of the pennant. Then price rebounded from the support line and rose to the resistance line, which coincided with the resistance level, but a not long time ago BNB rebounded and fell to the support line, which continues to rise near to this day. So, I think Binance Coin can reach the resistance line, after which turns around and starts to decline to the support level, thereby exiting from the pennant. For this case, I set my target at the 515 level. Please share this idea with your friends and click Boost 🚀
Cryptolean Binancecoin BNB UpdateYesterday Binancecoin failed to reclaim $586.
An inability to break $586 to the upside will push BNB price towards $504-$529 and, if unable to sustain price action above $504, lower to $455-$477.
A daily candle closure above the key daily resistance of $586 is required for Binance coin to have another bullish extension to re-test $635-$660.
