BNBusdt last time on this prizeSorry for the many lines, because friends are trading with lower times, I had to specify all the goals.
This may be the last chance to see a bnb at these prices
Don't forget that anything can happen, even a sharp price drop, and this market has a high risk.
But if you have done your research and you want to have bnb, it is a good opportunity to buy and bnb may not return to these prices, especially if bitcoin continues to rise or does not have a sharp correction.
Good luck
EntryPoint:
238.8
231.8
222
Supports:
210
195.6
188.5
178.8
Resistances:
246.3
255.7
Targets:
267.3
281
299.6
324.6
338.6
360
Midtime:
403.3
436.9
484.4
HODL:
542.2
588
652
730.6
783.2
877.6
GL
BNBUSDT

BNBUSDT Buy LimitThe H1 chart for BNB indicates the presence of Supply Demand zones. Bulls are making concerted efforts to establish new resistance levels and achieve higher highs. The risk-reward ratio stands at 1:2, Those who have confidence in BNB may choose to hold it for an extended period.

BNB at critical junctureBNB is coming to a close on this descending triangle which is typically seen as a bearish structure. Depending on the price action we see, whether the descending line is broken to the upside for a bullish trade or the horizontal line breaks for a bearish trade, it could signal where the overall market could be heading over the next 12 months given the positive correlation across crypto.
Considering the recent price action and weakness in BNB relative to Bitcoin along with the CZ fiasco the probability of a downside break seems likelier. Watching closely to see how price action unfolds.

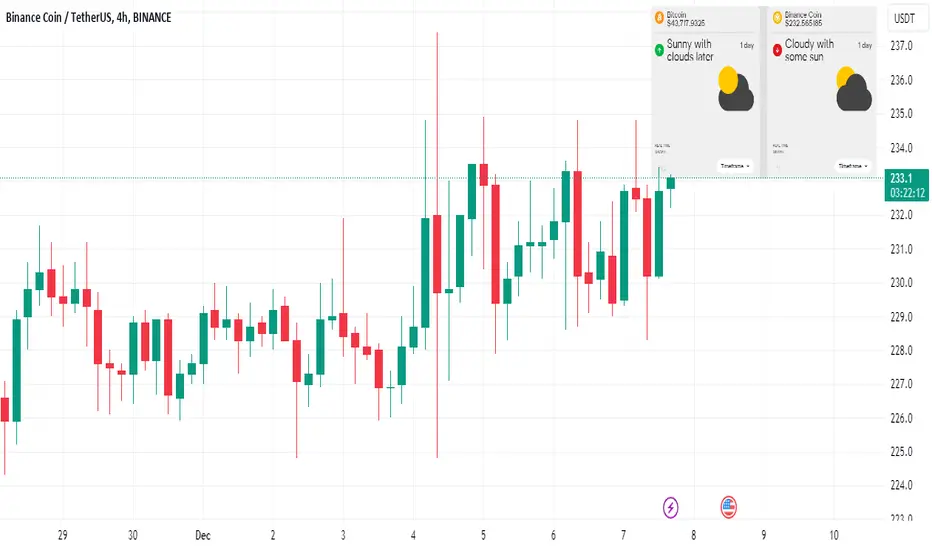
BNB ☁️ 24-Hours, Rebound in 1 Week; BTC Bullish ☀️A bullish ☀️ shines over most of the global crypto market, including Bitcoin and Ether, in the next 24 hours and seven days, ATTMO shows.
However, cloudy or rainy ☁️ bearish trading conditions will prevail over Binance Coin, Dogecoin, and Uniswap over the next 24 hours, although the bullish sun ☀️ will later come back and shine on Binance Coin.
Follow us for more crypto weather insights!
BNB: Approaching SupportBinance (BNB) technical analysis:
Trade setup : Trends are mixed. Following a bullish breakout from Sideways Channel, price reached our target of $260, where it got rejected again, just as it did in July.
Swing Traders: Pullback near $220 support area could be an attractive swing trade entry, with upside back to $260 near-term. That $220 level was previously a resistance area, which was broken and turned into support area (concept known as polarity).
Trend Traders: Price needs to break above 200-day moving average and $260 resistance zone to confirm Uptrend. If it does, it could revisit $300 next.
Trend : Downtrend on Short- and Medium-Term basis and Uptrend on Long-Term basis.
Momentum is Mixed as MACD Line is below MACD Signal Line (Bearish) but RSI ~ 50 (Neutral). MACD Histogram bars are rising, which suggests that momentum could be nearing another upswing.
Support and Resistance : Nearest Support Zone is $220 (previous resistance), then $200. The nearest Resistance Zone is $260, then $300.

BNB Possible scenarioWhite box is resistance zone for Binance coin. If we can flip it into resistance, we could reclaim trendline level around 260. From here a big drop looks possible

BNB#BNB
Many possible ways to play out.
1. We see breakout above orange resistance line or 241.2$ in this case BNB will go higher to test 281$ level
2. BNB doesn’t manage to break the 242$ level and comes to retest 212$ level again where important to see the bounce and W close above 212$ for up trend continuation
3. BNB break below 212$ and thats it… bye bye BNB coin…

BTC & Most Alts Look ☀️, Yet, BNB Faces ☁️ - Downward Trend A bullish sun ☀️ continues to dominate the skies over the global crypto market in the next 24 hours, indicating further upside potential for Bitcoin, Ether, and many altcoins. These bullish conditions will persist over a one-week horizon, according to ATTMO.
Exceptions are Avalanche, Binance Coin, and Uniswap which will face bearish clouds ☁️ and downside risk in the next 24 hours, as well as Ripple’s XRP and Uniswap over the coming week.
Folow us for more crypto weather reports!

BTC repeating history again? Hey everyone, let's talk about Bitcoin! Remember back in June 2019 when Bitcoin really took off and hit that special 65% mark, known as the golden pocket?
Now, it looks like Bitcoin might be getting ready to do something similar. We're seeing signs that it could reach the golden pocket again, which this time means hitting around $50,000 before we begin the next bearish retracement.
Which could be idk, $28,000ish and maybe a swing lower than a buy back up? Perhaps. Lets see...

Binance Coin can exit from triangle and then rebound to 245Hello traders, I want share with you my opinion about Binance Coin. Observing the chart, we can see that the price a few time ago traded near the 224 support level, which coincided with the buyer zone and later BNB declined to this zone, after which it rebounded and made impulse up to the 245 resistance level. When the price reached this level, which coincided with the seller zone, BNB broke it and started to trades in range. After the range, Binance Coin made an upward impulse to 272 points, thereby exiting from the range and entering to triangle, where it at once rebounded from the resistance line and made a strong downward impulse to 224 support level. Also, the price broke the 245 level again, and after impulse down, BNB rebounded from the support level and tried to rise, but failed and made a correction. Then it bounced to the resistance line of the triangle and recently price rolled down from it and now trades near. In my mind, Binance Coin can decline a little more and then rise to the resistance line. Next, the price can break this line, exiting from the triangle, and make a retest. After these movements, the price can bounce from this line and continue to move up to the resistance level. For this reason, I set my target at the 245 level. Please share this idea with your friends and click Boost 🚀

BNB ☁️ 24 Hours Ahead; Bearish Momentum & DowntrendA strong bullish sun shines ☀️ over the global crypto market in the next 24 hours, indicating upside potential. Binance Coin bucks this positive trend with cloudy ☁️ bearish trading conditions ahead, ATTMO indicates.
Bullish trading conditions will also prevail over a one-week horizon, with additional upside potential for altcoins as well as both major cryptocurrencies – Bitcoin and Ether. However, ☁️ bearish clouds will be appearing over Ripple’s XRP, Avalanche, Polkadot, and Uniswap over this longer time horizon. 📈🌧️
Follow us for more crypto weather reports!

BNBUSDT - After retesting, price can start grow to $240Hi guys, this is my overview for BNBUSDT, feel free to check it and write your feedback in comments👊
Some time ago price traded near resistance level, which their moment located in resistance area, and soon BNB broke it.
After this, price made upward impulse to $272 points, but soon started to decline and in a short time fell to $225 level, breaking $245
Also, price started to trades in triangle, where it long time traded near $225 support level, which coincided with support area.
Later price reached resistance line of triangle, made a little movement down, and then rose higher than this line, exiting from triangle.
As well BNB made retest and now trades close to this line, and possibly Binance Coin can bounce from it and rise to $240
If this post is useful to you, you can support me with like/boost and advice in comments❤️

BNB: Approaching SupportBinance (BNB) technical analysis:
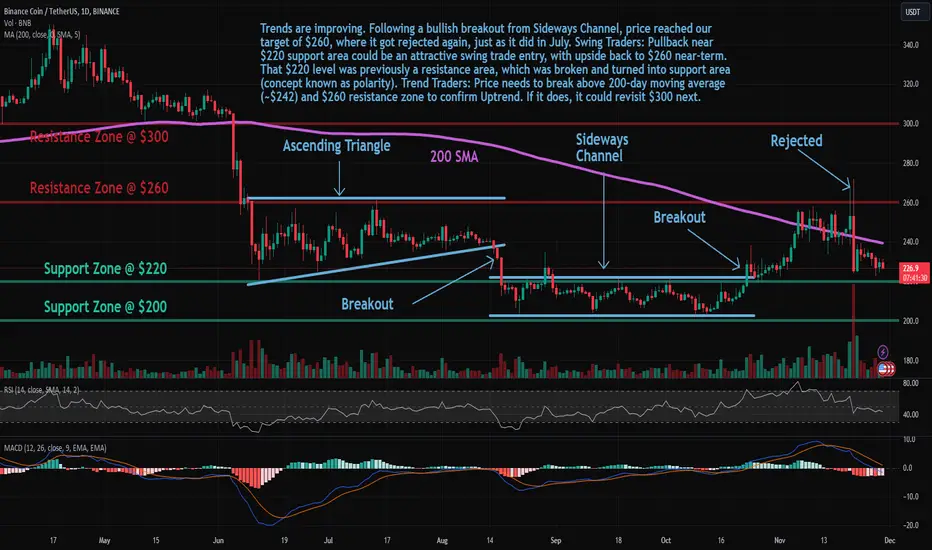
Trade setup : Trends are improving. Following a bullish breakout from Sideways Channel, price reached our target of $260, where it got rejected again, just as it did in July.
Swing Traders: Pullback near $220 support area could be an attractive swing trade entry, with upside back to $260 near-term. That $220 level was previously a resistance area, which was broken and turned into support area (concept known as polarity).
Trend Traders: Price needs to break above 200-day moving average (~$242) and $260 resistance zone to confirm Uptrend. If it does, it could revisit $300 next.
Trend : Downtrend on Short- and Medium-Term basis and Uptrend on Long-Term basis.
Momentum is Bearish but inflecting. MACD Line is below MACD Signal Line and RSI is below 45 but momentum may have bottomed since MACD Histogram bars are rising, which suggests that momentum could be nearing another upswing.
Support and Resistance : Nearest Support Zone is $220 (previous resistance), then $200. The nearest Resistance Zone is $260, then $300.

BUSD the next UST? Binance investigated! I think many of the Binance IPO whales will move away from BNB and BUSD after the news that the Securities and Exchange Commission (SEC) is investigating Binance for the issuance of its cryptocurrency token Binance Coin.
A report from Reuters agency says that Binance unknowingly processed billions in illicit transactions, including illegal drug sales, hacks, and investment fraud totaling $2.35 billion!
I think this could lead to sell-off in the crypto market if it proves to be true.
Looking forward to read your opinion about it.

BNB/USDT 4H Interval ChartHello everyone, let's take a look at the BNB to USDT chart on a 4-hour time frame. As you can see, the price is struggling to return above the local uptrend line.
When we unfold the trend based fib extension grid, we can see that the decline was maintained through the support zone from $227 to $225, and further we can see a decline to the support area at $220.
Looking the other way, you can see that the price has been rejected by the resistance at $229.81, and then there is a resistance zone from $232 to $234.
Looking at the CHOP indicator, we see that there is a lot of energy for the upcoming move, on the RSI we are moving in a sideways trend, while the STOCH indicator indicates that the price may go up a little more.

BNB/USDT 1DAY UPDATE BY CRYPTOSANDERS !!Hello friends, welcome to this BNB/USDT update from Crypto Sanders.
Chart Analysis:- Unfortunately, BNB’s price fell by 3% this week after buyers were unable to regain control. The momentum remains bearish as the price continues to make lower lows.
The level at $230 turned into a resistance this past week, and it is unlikely to see a reversal any time soon. At best, this cryptocurrency could aim to reclaim $230 as support.
If nothing changes, then BNB could drop back to levels not seen since early October, when the price was found at $200. This is also the strongest support on the chart right now
I have tried to bring the best possible results in this chart.
If you like it, hit the like button and share your charts in the comments section.
Thank you.

HelenP. I Binance Coin can exit from triangle and continue growHi folks today I'm prepared for you Binance Coin analytics. Some days ago price declined to the 224 support level, which coincided with the support zone, but soon it rebounded from this level and made impulse up to the resistance level. Then the price tried to break the 252 level and fix, but failed and a few time later fell below to 233 points. After this movement, BNB around and rose to the 252 level again, but this time price broke it and rose until to trend line. Later price bounced from the trend line, entered to triangle, and started to decline. Inside the triangle, BNB declined until to 224 support level, thereby breaking the 252 resistance level. After the price fell to the 224 level, it rebounded and tried to back up, but failed and declined to support zone. But a not long time ago, the price bounced from this zone and rose to the trend line. And now I expect that Binance Coin can decline to support level again and then rebound up to the 237 level, thereby exiting from the triangle. If you like my analytics you may support me with your like/comment ❤️

BNB/USDT Review CHartI invite you to review the chart of BNB in pair with USDT, also on a one-hour time frame. First, we can use the blue lines to mark the downward trend channel in which the price has been moving since the last correction.
In order to check the current support areas, when the correction begins to deepen, we will unfold the Trend Based Fib Extension grid and we can determine the first support for the price at $225, and then it is worth defining an important support zone from $221 to $218.
Looking the other way, we can similarly mark places where the price should encounter resistance on the way up. And here you can see the resistance zone from $230 to $231, which effectively stopped the price increase, while if we manage to break out of it, we have a second zone from $234 to $237.
The CHOP indicator shows energy for the next move, the RSI indicator is recovering with room for a larger correction, while the STOCH indicator is moving at the lower border, which may result in a temporary sideways trend.

BNB: Approaching SupportBinance (BNB) technical analysis:
Trade setup : Trends are improving. Following a bullish breakout from Sideways Channel, price reached our target of $260, where it got rejected again, just as it did in July.
Swing Traders: Pullback near $220 support area could be an attractive swing trade entry, with upside back to $260 near-term. That $220 level was previously a resistance area, which was broken and turned into support area (concept known as polarity).
Trend Traders: Price needs to break above 200-day moving average (~$242) and $260 resistance zone to confirm Uptrend. If it does, it could revisit $300 next. (set a price alert).
Trend : Downtrend on Short-Term basis and Uptrend on Medium- and Long-Term basis.
Momentum is Mixed as MACD Line is below MACD Signal Line (Bearish) but RSI ~ 50 (Neutral).
Support and Resistance : Nearest Support Zone is $220 (previous resistance), then $200. The nearest Resistance Zone is $260, then $300.
BNB massive drop to 140$ !!!Hello Traders
Our technical view has been shown in the chart.
If you like it then Support us by Like, Following, and Sharing.
Thanks For Reading
Team Fortuna
-RC
(Disclaimer: Published ideas and other Contents on this page are for educational purposes and do not include a financial recommendation. Trading is Risky, so before any action do your research.)

BNB Trend ChangedNext Target for BNB seems to be $238 until it smashes this resistance. Follow for further updates

Troubled Binance takes a toll on BNBUSDThe recent turmoil engulfing Binance, the world's largest crypto exchange, has cast a shadow over its proprietary cryptocurrency, Binance Coin (BNBUSD). The upheaval was triggered by the unexpected resignation of Changpeng Zhao amid his confession to criminal wrongdoing (facilitating money laundering) and the announcement of a hefty fine for the exchange, amounting to $4.3 billion. These developments resulted in a nearly 20% drop in the value of BNBUSD (in a matter of less than a week). With RSI, Stochastic, and MACD all turning increasingly bearish on the daily time frame, the situation does not look like it will improve anytime soon. Therefore, to further bolster a bearish case, we would like to see the mentioned technicals continue to decline and BNBUSD break below Support 1; without any significant support below this level, we think there is a good chance for BNBUSD to drift toward $200 (after a breakout). Consequently, we will monitor the situation in the following days and update our thoughts on the asset once new developments arise.
Illustration 1.01
Illustration 1.01 portrays the daily chart of MACD that is crossing below the midpoint, strengthening a bearish case going forward.
Technical analysis gauge
Daily time frame = Bearish
Weekly time frame = Bearish
*The gauge does not necessarily indicate where the market will head. Instead, it reflects the constellation of RSI, MACD, Stochastic, DM+-, ADX, and moving averages.
Please feel free to express your ideas and thoughts in the comment section.
DISCLAIMER: This analysis is not intended to encourage any buying or selling of any particular securities. Furthermore, it should not be a basis for an individual investor to take any trade action. Therefore, your own due diligence is highly advised before entering a trade.

BNB is in the purchase zone!!!The price has again descended to the purchase zone 224.1-186.2
The price is below the volume price 242.5 The
price is in the global accumulation zone 267.7-199.2
With a high probability, this is a re-test of the purchase zone and the Local zone.
Follow the news around Binance!!!
