After upward impulse, Binance Coin can start to declineHello traders, I want share with you my opinion about Binance Coin. Observing the chart, we can see that the price a not long time ago declined to support line of a downward channel and then tried to rise, but failed and fell back. After this BNB rebounded up and made a fake breakout of the 217 resistance level, and then continued to fall to the 211 support level, which is located in the buyer zone. Binance Coin broke this level, exited from the downward channel too, and then fell to the support line of the wedge, where it at once bounced up and made a strong upward impulse to the resistance line, breaking the 211 support level again. Then the price made a correction below this level, but soon it started to rise and in a short time BNB rose to the current support level, which coincided with the resistance line of the wedge. Also recently price exited from the wedge, broke the 217 level, and even made a retest. Now BNb continues to move up and I think that the price can start to fall to the support level and then try to break it. If the price breaks this level, BNB can make a retest, or at once continue to decline, therefore I set my target at the 214 level. Please share this idea with your friends and click Boost 🚀
BNBUSDT

2023 Showdown: Can Binance Coin Hold the $200 LineHello traders and investors! If you appreciate our charts, give us a quick 💜💜.
A remarkable similarity between the current Weekly chart of BinanceCoin ( BINANCE:BNBUSD ) and the 2018-2019 market has become evident. It's as if we're witnessing a large fractal pattern unfolding before our eyes. However, as we stand on the brink of 2023, there's a critical juncture approaching - the $200 support level for $BNBUSD.
When we examine this fractal in the context of 2018-2019, it suggests a scenario where the price could potentially break down, possibly leading to a significant 50% decline to approximately the $100 level.
This pivotal moment at the $200 support level warrants our keen attention, as it could have substantial implications for the future direction of BinanceCoin. The echoes of the past are compelling, and it's essential for traders and investors to stay vigilant and monitor this unfolding pattern closely.

BNBUSDT ConsolidationWe see consolidation on BNBUSD H4 chart. Now we are on resistance area 250 level. Support level is 230 ... There is big potential to retest our support zone...

My position on BNBUSD BNBUSD is at a major level. Watch for price action around this area. If this level holds, the price will bounce but if it doesn't, we can expect further downside movement.

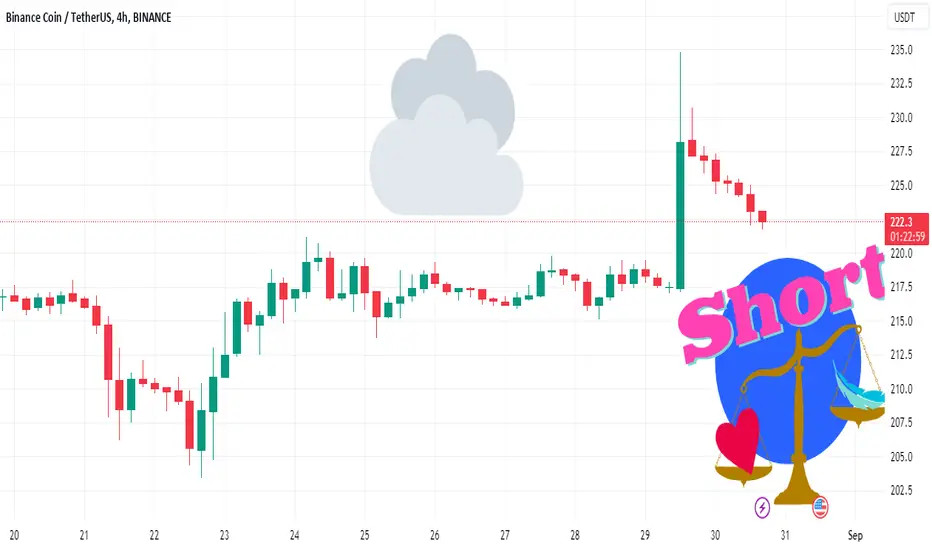
BNB Faces ☁️; Bearish Trend On a 1-Week HorizonBinance Coin, Litecoin, and Cardano face cloudier trading conditions in the next 24 hours, signaling a slightly bearish market with downside risk. ⛅️
On the other hand, the sun is back ☀️ , shining over the global crypto market following a key court ruling in the US. ATTMO indicates a slightly bullish market with upside potential for the coming hours and one-week horizon for Bitcoin, Ethereum, and most alts.
Over a longer time horizon, the forecasts are mixed, with a continued bearish trend for Binance Coin but a slightly bullish trend for Litecoin. 🌦️
Follow us for more crypto weather reports!
BNB: Approaching ResistanceBinance (BNB) technical analysis:
Trade setup : Following a bearish breakout from Ascending Triangle pattern, price resumed its downtrend and broke below $220 key level. That’s a level that held up in June and also in Dec 2022, so it’s significant that price has broken below that $220 level and made a new low. Price could revisit $200 support.
Trend : Downtrend across all time horizons (Short- Medium- and Long-Term).
Momentum is Mixed as MACD Line is above MACD Signal Line (Bullish) but RSI < 45 (Bearish).
Support and Resistance : Nearest Support Zone is $200. The nearest Resistance Zone is $220, then $260, and $300.

BNBUSDT - Price can make one more move up and then start to fallHi guys, this is my overview for BNBUSDT, feel free to check it and write your feedback in comments👊
After price bounced down from $226 points, it declined below $220 resistance level, which coincide with resistance area.
The price tried to rise but failed and declined to $205 support level, which is located inside support area.
Also, BNB entered to rising channel, where it made an upward impulse higher than $220 level, but soon declined back, thereby exiting from channel.
Then price started to trades in flat, after which it fell to support level, and a not long time ago bounced and started to rise.
Now I think that BNB can rise a little more and then bounce down to $205 support level.
If this post is useful to you, you can support me with like/boost and advice in comments❤️

BNB/USDT 1DInterwal Review ChartHello, I invite you to review the BNB chart taking into account the one-day time frame. As we can see, the price is still in the downtrend channel marked with blue lines.
When we unfold the Trend Based Fib Extension grid, we see that the price remains in a strong support zone from $212 to $205, but when we fall lower we have a second zone from $199 to $189, and further we can see the price drop to the support level of 176 $.
Looking the other way, we can similarly determine the resistance areas that the price must face. And here it is worth marking the main strong resistance zone from $229 to $244, only when the price goes above it and tests positively will we see an increase to the area of strong resistance at $270.
The CHOP index indicates that energy is slowly gaining strength. On the RSI we are moving in the lower part of the range, which should bring an increase in the price in the coming days, while on the STOCH indicator we also have a lot of room for the price to start growing, which may have a positive impact on the valuation of BNB.

HelenP. I Binance Coin can bounce up and reach resistance zoneHi folks today I'm prepared for you Binance Coin analytics. A few time ago price declined from 222 points and entered consolidation, where it declined until to 212 resistance level, which coincided with the resistance zone. However, after this movement, the price rebounded and started to rise to the top part of the consolidation. When it reached the top part, BNB at once bounced down to the resistance area, where it some time traded and later rebounded down to 204 points, thereby exiting from consolidation and breaking the 212 resistance level. A not long time ago Binance Coin bounced and made an impulse up to the resistance zone, but recently price declined back and at the moment it trades very close to the resistance level. I expect that the price can finally break the resistance level, make a retest, or at once continue to move up. Therefore I set up my target at the 217 level. If you like my analytics you may support me with your like/comment ❤️

BNBUSDT: Prepare for a Severe Drop, Potential to Fall Below $150Hi Fellow Traders,
BNBUSDT has broken out of the symmetrical triangle pattern and is possibly heading for a crash. The price is plummeting below the lower trendline and has crossed below the EMA 200 line, signaling a strong bearish trend. To make matters worse, a Bearish Inverted Hammer has appeared after bouncing off the base pattern. This deadly combination of technical factors suggests a sharp decline to the first target area. Then, we might see a brief rebound to the blue zone area before another dive to the second target area.
Negative Sentiments
1. lawsuits filed by the U.S. Securities and Exchange Commission (SEC) against Binance and Coinbase
2. The SEC accuses Binance of selling unregistered securities and Coinbase of offering a lending program that violates securities laws.
3. These lawsuits are part of a broader regulatory crackdown on the crypto industry and they could have significant implications for the future of cryptocurrencies. The possible outcomes of the lawsuits, such as settlements, fines, or bans, and how they could affect the crypto market and innovation.
It is essential to note that the analysis will no longer hold validity once the target/support area is reached.
Please support the channel by engaging with the content, using the rocket button, and sharing your opinions in the comments below!
Disclaimer:
"Please note that this analysis is solely for educational purposes and should not be considered as a recommendation to take a long or short position on
BINANCE:BNBUSDT ."

BNB 38% shortAltcoin which drags the market must adjust to Support area with spikes to Wicks area.
Accordingly, we will see similar movements in other assets.

Binance Coin can bounce up of support line and exit of triangleHello traders, I want share with you my opinion about Binance Coin. Looking at the chart, we can see how the price a few time ago declined to the 237 resistance level, which coincided with the seller zone and at once rebounded up and continued to rise inside the upward channel. After the price reached the resistance line of the channel, it started to decline and in a short time, BNB declined to the 237 level again, broke it, and made a strong downward impulse to support line of the triangle, thereby exiting from the upward channel and breaking 237 and 213 levels. But after this movement, the price at once bounced up and rose to the resistance line of the triangle, breaking the 213 level again, which coincided with the buyer zone. When BNb reached the resistance line, it soon rolled down to the support level, and even recently tried to back up, but failed and bounced back to the 213 level. Now Binance Coin trades very close to this level and I think that the price can decline to the support line and then start to rise to the resistance line. Also, BNB can exit from the triangle and continue to rise, for this case, I set up my target at the 224 level. Please share this idea with your friends and click Boost 🚀

BNBUSDT - Price can break resistance level and then make retestHi guys, this is my overview for BNBUSDT, feel free to check it and write your feedback in comments👊
A few time ago price started to trades inside rising channel, where it fell to $215 level and then continued to rise.
Later price made strong upward impulse to resistance line of pennant, thereby exiting from channel and breaking resistance $225 level.
But then BNB bounced down and declined below this level and some time later declined to support line, breaking $215 level too.
Also recently, price bounced up and tried to rise back, but failed and now trades in support area near resistance line of pennant.
Possibly, Binance Coin can exit of pennant, break resistance level, and make retest, after which it starts to rise to $222 level.
If this post is useful to you, you can support me with like/boost and advice in comments❤️

Further downward pressure possibleBNB is looking to break further down, currently on the LTF it it looking like a bear flag continuation, before the big leg down possibly!

HelenP. I Binance Coin can make correction and then bounce upHi folks today I'm prepared for you Binance Coin analytics. Some time ago price bounced from the 214 support level and started to rise inside an upward channel, in which it reached the 224 resistance level. Then, BNB exited from the channel, and made a strong upward impulse to 235 points, thereby breaking the resistance level, which coincide with the 224 resistance zone. But soon, the price rebounded down back and even declined below this level. Price tried to rise, but failed and continued to fall to 214 support level, which coincided with the support zone. As well later BNB declined below this level, where it some time tarded in the support zone and later rebounded back. At the moment, Binance Coin trades near the support level and I expect that the price can make a small correction to this level and then continue to move up. Therefore I set up my target at 220. If you like my analytics you may support me with your like/comment ❤️

BNB/USDT 4HInterval Review ChartHello everyone, I invite you to review the BNB chart on a four-hour interval. First, we will use the yellow line to mark the uptrend from which the price went down, then we have a visible downtrend, from which we observe the sideways exit and currently we can mark the local channel of the sideways trend with the blue lines.
Now let's move on to marking the places of support. We will use the Fib Retracement tool to mark the support, and here we can see that the price is at the upper border of the support zone from $215 to $210, however, when we fall below this zone, we still have support at $203, and then we can see a strong drop to the support area at $184.
Looking the other way, we can also mark the places where the price should meet resistance. And here, a slight price movement will enter the resistance zone from $216 to $220, then we have the second zone from $223 to $225, then resistance at $229, and then resistance at $234.
The CHOP index indicates that there is a lot of energy to be used in the upcoming move, on the RSI we are in the middle of the range, which makes it difficult to determine the direction, but the STOCH indicator indicates a rebound, which may push the price towards the resistance zone.

BNB price will collapse back to the $50 level in...Binance is on the verge of a complete and utter collapse. Much like the Luna collapse and the demise of FTX, Binance will be following in the footsteps of the aforementioned crypto scams. BinanceUSD will go to near ZERO as well. I firmly believe that Binance will go down as the biggest fraud in crypto for decades.
Avoid it like the plague!
I will be shorting this worthless ponzi scheme into the ground!

#BNB/USDT IDEABNB currently in a strong support zone, the RSI is crossing over MA14
#US DOLLAR ANALYSIS
The US dollar got rejected from the horizontal resistance and is currently retesting above the descending triangle and the MA 200. MACD crossover is turning bearish and RSI is moving toward the oversold region.
A failed retest and breakdown of the MA 200 would be the bearish confirmation, while a solid breakout of the horizontal resistance would be the bullish confirmation. We've to note that it usually works inversely proportional to the market.
Im looking for a strong pump
Entry: 215.66 - 216.32
SL: 213.5
TP1: 228.06
TP2: 240.88
TP3: 260
Not a financial advice, please manage your leverage and risk
Thanks

BNB Chart Review 4H IntervalI invite you to review the BNB chart on a four-hour interval. As we can see, the price has broken the downtrend line and is now struggling to stay above it, while currently we will use the blue lines to mark the uptrend channel in which the price is approaching the lower limit.
After unfolding the Fib Retracement grid, we can mark the support zone from $219 to $215, when this zone is broken, there is support at $210, and then we have support at $203.
Looking the other way, we can similarly determine the places of resistance that the price has to face. And here we see that the price is now back below the resistance at $225, then we have resistance at the golden fibon point at $230, from which the price rebounded, only when it breaks up we will move towards the resistance at $238.
The CHOP index indicates that the energy has been consumed in the last increase and during the current recovery there is an accumulation, on the RSI we have a visible recovery after overheating but there is still room for the price to go lower, the same is indicated by the STOCH indicator which shows the place for us to fall to the support zone.

it's time to going up for BNBUSDTbefore buying, please check for being sure about your opinion about this CRYPTOCURRENCY!!!
(in every target you want closed the position but our target is the third one)
be rich...
and
doing and living in the best quality *-*
(Guy's the entry place is importance things in enter in a position and be careful do not going up your leverage over 7x ,all things it's about risk management)
*************************************************
if you want to enter in this position:
Enter Price: 242.3
Target1: 261.9
Target2: 280.8
Target3(Final Target): 326
Stop loss: 219.2

BNBUSDT - Price can break support line and continue fall to $210Hi guys, this is my overview for Binance Coin, feel free to check it and write your feedback in comments👊
A few moments ago price declined to $220 resistance level, which coincided with resistance area.
Also, BNB entered to falling channel, where it broke $220 level and declined to support line of channel.
Next, price tried to rise, but after it reached resistance line of channel, BNB bounced down to support line.
Then price started to rise and in a short time, it rose to $220 resistance level, thereby exiting from falling channel.
But then, Binance Coin bounced from resistance level and fell to support line, where it continues to trade very close.
In my mind, BNB can rise to resistance level and then bounce down to $210 level, breaking support line.
If this post is useful to you, you can support me with like/boost and advice in comments❤️

BNB 2days/candle Binance Ponzi 50% correction🔸Hello traders, let's review the daily price chart for BNB today. Prior strong downtrend
conditions then compression into rising wedge in downtrend signals further losses.
🔸BNB CZ took down FTX previously, however as a domino effect now Binance is
under heavy scrutiny by global regulators and SEC in US. Things are not looking good
for Binance and the Ponzi BNB token, previously artificially inflated by CZ/Binance
manipulations is under heavy sell side pressure. expecting 50% correction.
🔸Recommended strategy for BNB/Binance bears: Short the Ponzi token at market,
after breakdown of rising wedge we are hanging by a thread near 200/220 USD, once
this final S/R is broken, free fall mode until 130/140 USD, expecting a waterfall dump
and deflation of the artificially propped ponzi BNB. final TP bears is 130/140 USD.
🎁Please hit the like button and
🎁Leave a comment to support our team!
RISK DISCLAIMER:
Trading Futures , Forex, CFDs and Stocks involves a risk of loss.
Please consider carefully if such trading is appropriate for you.
Past performance is not indicative of future results.
Always limit your leverage and use tight stop loss.

