long BNBCRYPTOCAP:BNB broke through the descending trendline. Rise to resistance level at $276 is expected to happen.
BNBUSDT

Binance Coin BNB/USDWill the price hold 200EMA for third time and make a higher low structure?
If not. I don't think we will break the 185USD level because of fud, unless something would go badly wrong with Binance and collapse the price.
Maybe we might get a nice bear trap there.

Binance Coin Can Be Finishing A Larger Bullish TriangleBinance coin is trading sideways for more than 100 weeks, similar as back in 2018-2020.
We see it as a long corrective consolidation within uptrend, ideally as a larger bullish triangle pattern in wave (4) that can take the price higher for wave (5) in the near future.
Despite recent negative news that U.S. regulators sued Binance and its CEO Changpeng Zhao for breaking the US securities rules, we can actually see it now trading in final subwave E of (4) that can find the support around the lower triangle line and base channel resistance line. Binance is actually already bouncing back with comments »We will defend ourselves against the SEC suit vigorously. The SEC lawsuit is baseless. We remain open to a productive compromise." So, don't get bear trapped and be aware of a bullish resumption into 5th wave in the second part of 2023.

Time for $BNB to bounce back!BNB is moving below its significant support of $264 on this 45m candles chart.
The range that it should move should be at $264 - $274 considering the current market situation
If SEC doesn't surprise us with the everyday announcements and the war against the crypto markets I believe that #BNB is going to make a short bounce. If it reaches the aboce mentioned levels, we need to check the charts again to see the next moves.
I would like to read your opinions in the comments.
Are you short or long on #BNB?

BNBUSDT AnalystHello everyone! I want share my idea about BNB.
We saw really good and massive down movement of BNB. its looking very bearish but although on high timeframe it looks pretty good for buy because we are close to 1W trendline and support.
I am looking bullish bitcoin too, if bitcoin price will go up I think it will help to BNB for start uptrend from here. its linked in the idea.
Here is my 2 scene of price movement which is possible happen, but for me from here scene which is uptrend is more possible to happen because its really good new low for buy BNB.
Be patient! Buy Low Sell High!

Right back Where it Started From !! #BNBSEC suing exchanges right & left . SEC sued binance & Ceo of binance for operating illegal business in US ! Price of BNB Dropped 16% following on this news !!
Technically if we see #BNBUSDT chart its forming #BearFlag on Weekly time frame and now the price of BNB is at $260 and its breaking the trendline of the channel ! if weekly closed below the channel we can see a Sell off to $214 . $214 level of BNB is the most imp level to be hold ! if BNB failed to hold $214 There is higher probability that BNB will dump below $40 following the Bear Flag !!
Remember BNB haven't retested its Pre Pump levels ( 37$ ) while rest of altcoins are down 90% from the highs !!
@Crypt001337

Top 7. Most expensive coins today on the market for sale1. Bitcoin - 26k+
2. YFI - 6k+
3. Ethereum - 1.8k+
4. YFII - 700$+
5. MKR - 600$+
6. BNB - 200$+
7. BCH - 100$+
During whole the bearmarket are the above mentioned coins the most expensive ones on the market for sale. If Ethereum could come from 90$ dollars to 4k last bullrun, these coins value most have a reason behind the value today also...

BNB/USDT 1DInterval Resistance and SupportHello everyone, I invite you to review BNB in pair to USDT, on a one-day interval. First, we will use the yellow line to mark the uptrend lines, as we can see the price is currently staying just below this line.
Moving on, we can move on to marking support areas when the correction begins to deepen. And here, the first support that currently holds the price is $257.2, but if the support is broken, we have another support at $230.7, and then a third very strong support at $197.
Looking the other way, we see that on the way up, the price has to overcome a very strong resistance zone from $ 294 to $ 324, only when it positively tests it, we will move towards the resistance at $ 353.8, and then towards the very strong resistance at the price $396.3.
When we turn on the EMA Cross 200, we see that for a long time the price struggled to stay above this level, but the bottom exit resulted in a strong price rebound and a return to the downward trend.
Please look at the CHOP index, which indicates that the energy has been used, the MACD strongly confirms the return to the downtrend, while the RSI can also see a strong rebound where we crossed the lower limit of the range, which may indicate that the current correction is coming to an end.

#BNB IS READY TO BOUNCE, DON'T MISS THIS OPPORTUNITY😱Binance Coin (BNB) Technical Analysis:
BNB is trading at 278$ which is a strong level of support, we are expecting a good bounce up to the upper level of this symmetrical triangle
and if it breakout this pattern then we can see some good bounce according to the pattern.
we have 353$ and upper resistance of this rising channel 510$ or all-time high
It can offer long-term investors an excellent entry point.
Conclusion:
Overall, technical analysis indicates that Binance Coin (BNB) could expand by 50% or more in the near future, indicating that there is tremendous potential for development in the asset. But like with any investment, you must conduct your own research and base your choices on your personal risk appetite and financial objectives.
For more Quality Charts Analysis, follow us.
I'm grateful.

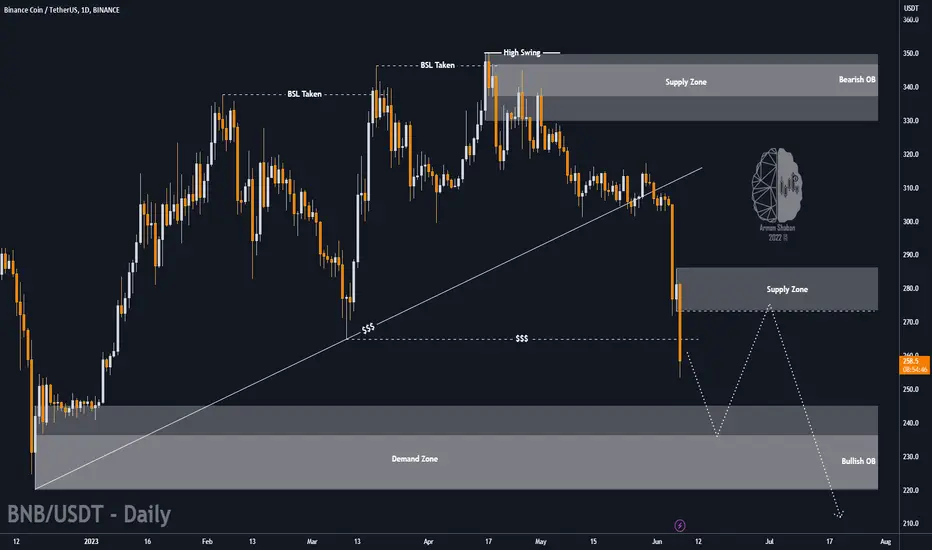
✏️ BNB/USDT : Possible Scenario , Yeah?By checking the #BNB chart, we see that the price has entered the liquidity pool below the level of $265 and the initial reaction is probably positive, but I expect the price to drop to the range of $245 to $220 soon! The important supply level is from $273 to $286! Observe the specified ranges on the chart!
Don't Forghet To Push The Boost (Like) Button and Follow Me for More !
Best Regards , Arman Shaban

BNBUSDTBNB's main trend is upward, but in my opinion, in the short term, we will have a correction to the range of 270 to 260. Right now, an important trend line has been broken and after a pullback, I expect the price to drop. If this happens, the next supports can be 285 and 270. You can see the rest of the story in the chart.
⚠️"Daily crypto market analyses I provide are personal opinions & not financial advice. Trading carries risks, so do your own research & seek advisor's help."

BNB, BTC, DOGE 🌥️🐻⬇️; XRP, ETH 🌴🌞? Clouds with a hint of sun lie ahead for the global crypto market, including Bitcoin, Binance, and Dogecoin, in the next 24 hours. This signals a slightly bearish market with downside risk following the latest regulatory crackdown.
🌴 The mood is, however, tropical – very bullish with some upside potential – for Ether and XRP today. Over a one-week horizon, a slightly bullish market with upside potential is expected for both Bitcoin and Ethereum. 🚀
Follow us and stay tuned for more crypto weather insights and reports! 🌩️⛅🌈

BTC Faces Headwinds 🌬️ Can BNB Rise Above the Storm? 🌩️Bitcoin faces strong headwinds 🌩️ – signaling a downward trend – in the next 24 hours following the US regulator’s latest crackdown on the US cryptocurrency market. Binance Coin, which is the cryptocurrency in the regulator’s sights, faces sunny conditions signaling upside potential. ☀️
Over a one-week horizon, a slightly bullish market with upside potential is expected for both major cryptocurrencies – Bitcoin 🚀 and Ethereum 🌟. Smaller altcoins, such as Binance Coin and XRP 🔥, should also benefit from this bullish mood and have upside potential. 💼📈
Follow us and stay tuned for more crypto weather insights and reports! 🌩️⛅🌈

BNBUSDT.1DHello dear friends,
*Mars Signals Team wishes you high profits*
This is a daily time frame analysis for BNBUSDT.1D
We are in daytime. After a 20% drop due to news and complaints from Binance, which faced pressure from sellers.
Now the price is fluctuating at our first support zone, and if it can maintain this level, we can consider the possibility of increasing the price to the resistance zone. But if the price cannot support and moves below our second support line and stabilizes, we can consider the possibility of falling to the third support line.
Warning: This is just a suggestion and we do not guarantee profits. We advise you to analyze the chart before opening any positions.
Take care

BNB: Rising Wedge BreakoutBinance (BNB) technical analysis:
Trade setup : Bearish breakout from Rising Wedge pattern and below 200-day moving average (~$300) could signal bearish trend reversal to downtrend. It is however quickly approaching $260 support area and is oversold (RSI < 30), thus price could bounce up near-term, albeit briefly.
Patterns : Rising Wedge It usually forms after an uptrend and suggests a potential bearish reversal in the original uptrend. When price breaks the lower trend line the price is expected to trend lower. Emerging patterns (before a breakout occurs) can be traded by swing traders between the convergence lines; however, most traders should wait for a completed pattern with a breakout.
Trend : Downtrend on Short- and Medium-Term basis and Uptrend on Long-Term basis.
Momentum is Bearish (MACD Line is below MACD Signal Line, and RSI is below 45).
Support and Resistance : Nearest Support Zone is $300, which it broke, then $260. The nearest Resistance Zone is $340, then $400.
