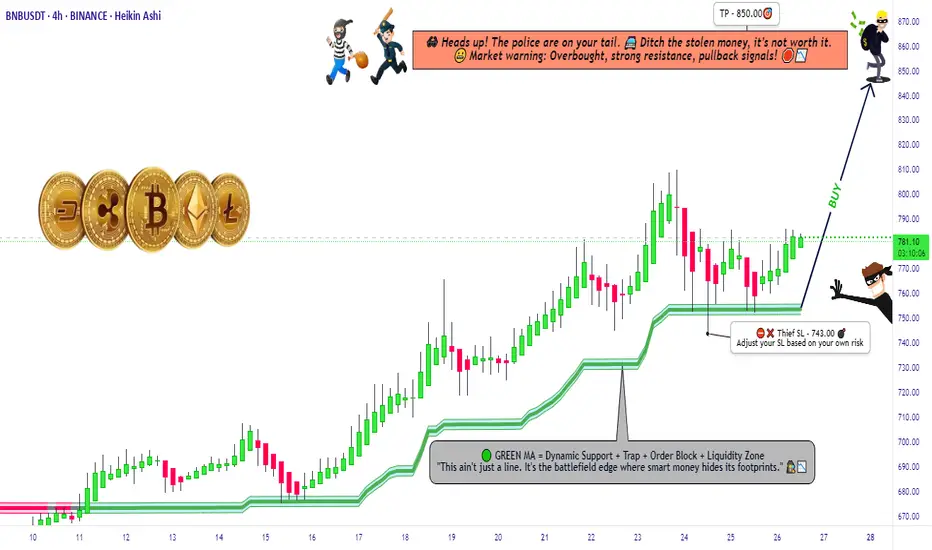
"BNB Primed for a Pump – Thief Trading Mode Activated!"🚨 BNB/USDT HEIST PLAN – SWIPE THE BULLISH LOOT BEFORE COPS ARRIVE! 🚨
🌟 Attention, Money Makers & Market Robbers! 🌟
(Hola! Oi! Bonjour! Hallo! Marhaba!)
The BNB/USDT vault is CRACKED OPEN—time to execute the ultimate heist! 🏦💰 Based on 🔥Thief Trading Style Analysis🔥, here’s your lucrative robbery blueprint for the Binance Coin vs. Tether market.
🔐 MASTER PLAN: LONG ENTRY HEIST (HIGH-RISK, HIGH-REWARD)
🎯 TARGET: 850.00 (or escape before the cops show up!)
🚨 POLICE TRAP ZONE: Overbought + Strong Resistance – Bears & cops are lurking!
💎 TAKE PROFIT EARLY & TREAT YOURSELF! (You’ve earned it, outlaw!)
⚔️ ENTRY STRATEGY: SWIPE FAST OR WAIT FOR THE PULLBACK!
🤑 VAULT IS OPEN! Enter any price if you’re bold (instant long).
🕵️♂️ SMART THIEVES: Use buy limit orders near 15M/30M swing lows/highs for a safer heist.
🛑 STOP-LOSS (ESCAPE ROUTE)
Thief SL: 743.00 (4H candle wick – adjust based on your risk tolerance!)
⚠️ WARNING: If the cops (bears) break in, DON’T HESITATE—RUN!
🎯 TARGETS & ESCAPE PATHS
Scalpers: Trail your SL & escape with quick loot! (Only long-side allowed!)
Swing Bandits: Hold strong but watch for police traps!
📡 MARKET INTEL (WHY THIS HEIST WILL WORK)
Bullish momentum in play! (But stay sharp—consolidation & reversals possible.)
Fundamentals, COT Reports, On-Chain Data, & Sentiment all hint at more upside!
🚨 TRADING ALERTS – DON’T GET CAUGHT!
📰 NEWS = VOLATILITY! Avoid new trades during major releases.
🔒 LOCK PROFITS! Use trailing stops to protect your stolen gains.
💥 BOOST THIS HEIST – STRENGTHEN THE SQUAD! 💥
🔥 Hit the LIKE & FOLLOW to support the robbery team!
🚀 More heists coming soon—STAY TUNED, OUTLAWS! 🚀
🎯 Trade Smart. Steal Big. Escape Faster. 🏴☠️
Bnbusdtidea
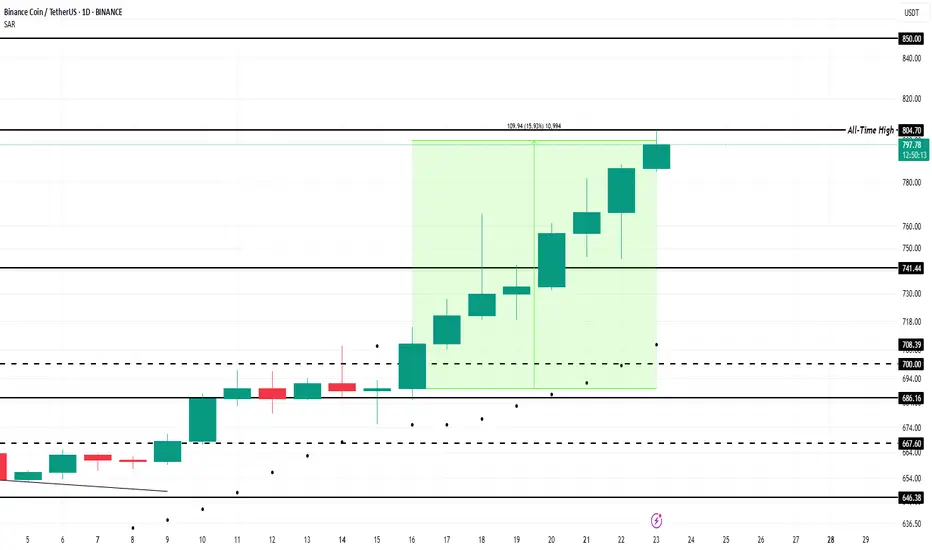
BNB Price Forms New All-Time High Above $800; Ends 7-Month WaitBINANCE:BNBUSDT price reached $804 today after a 16% increase over the past week, marking a new ATH . The altcoin has successfully ended a long period of consolidation and now stands at $799.
Its recent price movements indicate strong upward momentum, suggesting the potential for further gains. For nearly seven weeks, BINANCE:BNBUSDT has seen consistent accumulation . This trend is reflected in the exchange net position change, which shows growing investor interest in the altcoin
The bullish market sentiment is helping BINANCE:BNBUSDT break through key resistance levels. If this momentum continues, BNB could reach the $850 mark , a psychological milestone for the altcoin. This level could attract more investors and provide further price support, pushing BNB higher in the coming days.
However, should BNB holders decide to secure profits , the altcoin could face a price pullback. If selling pressure intensifies, BINANCE:BNBUSDT may slip below its current support level of $741 , which would invalidate the bullish outlook. A drop to this level would suggest a shift in sentiment, likely leading to a market correction.
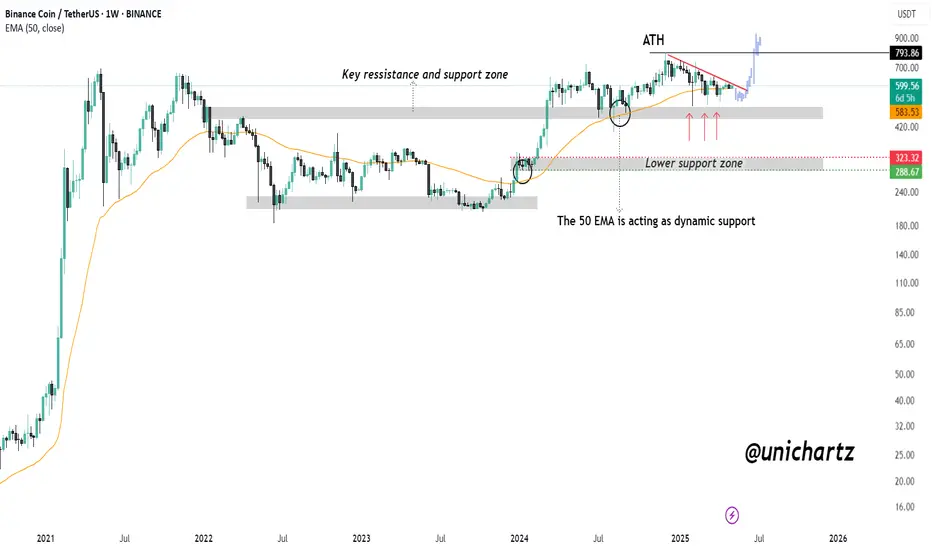
BNB to Make History Before 2026 BeginsCRYPTOCAP:BNB is setting up for something big. Price is holding strong above the rising support line, with the 50 EMA acting as dynamic support.
It's consolidating just below the all-time high — a classic sign of strength. Structure looks solid, momentum is building, and the chart favors bulls.
Mark my words — BNB will not only retest its ATH, but break it and go beyond before the year ends.
DYOR, NFA

BNBUSDT - Big Move Loading….BINANCE:BNBUSDT recently made a clean breakout from a strong resistance level, and since then, it’s been chilling in a tight consolidation range textbook flag formation if you ask us! This kind of local flag pattern often signals a continuation of the previous move, and in BNB’s case, that move was up.
The consolidation phase seems mature now, and price action is starting to show signs of life again. With growing hype around BNB and Binance related developments, momentum could be building for a strong leg up. If things go as expected, the next destination might just be its previous all-time high. 👀
Traders should watch for volume confirmation on the breakout from this flag. A decisive move above the pattern could trigger a sharp rally. But hey as always, don’t forget your stop-loss. Protect your capital and ride the move smartly. Let’s see if BNB is ready to fly again!
BINANCE:BNBUSDT Currently trading at $653
Buy level : Above $655
Stop loss : Below $620
Target : $795
Max leverage 5x
Always keep stop loss
Follow Our Tradingview Account for More Technical Analysis Updates, | Like, Share and Comment Your thoughts

BNB Bull Flag Activated — Watching for $794 CRYPTOCAP:BNB is showing strong bullish momentum after rebounding off the marked support zone. This level, which previously acted as resistance, is now holding firmly as support following the breakout.
As long as BNB sustains above this zone, the bullish structure remains intact — and the path toward a new All-Time High (ATH) around $794 is wide open. The 50 EMA continues to act as dynamic support, further strengthening the setup.
DYOR, NFA
BNBUSDT sell/shortBy utilizing levels, historical patterns, , we can formulate a hypothesis that the market might follow a similar trajectory if bearish sentiment prevails.

BNB/USD "Binance Coin vs U.S Dollar" Crypto Market Heist Plan🌟Hi! Hola! Ola! Bonjour! Hallo! Marhaba!🌟
⚔Dear Money Makers & Thieves, 🤑 💰✈️
Based on 🔥Thief Trading style technical and fundamental analysis🔥, here is our master plan to heist the BNB/USD "Binance Coin vs U.S Dollar" Crypto market. Please adhere to the strategy I've outlined in the chart, which emphasizes long entry. Our aim is the high-risk Red Zone. Risky level, overbought market, consolidation, trend reversal, trap at the level where traders and bearish robbers are stronger. 🏆💸Book Profits wealthy and safe trade.💪🏆🎉
Entry 📈 : "The heist is on! Wait for the breakout (640) then make your move - Bullish profits await!"
however I advise to Place buy limit orders within a 15 or 30 minute timeframe most recent or swing, low or high level.
📌I strongly advise you to set an alert on your chart so you can see when the breakout entry occurs.
Stop Loss 🛑:
Thief SL placed at the recent/swing low or high level Using the 4H timeframe (570) swing trade basis.
SL is based on your risk of the trade, lot size and how many multiple orders you have to take.
🏴☠️Target 🎯: 750 (or) Escape Before the Target
🧲Scalpers, take note 👀 : only scalp on the Long side. If you have loot a lot of money, you can go straight away; if not, you can join swing traders and carry out the robbery plan. Use trailing SL to safeguard your money 💰.
BNB/USD "Binance Coin vs U.S Dollar" Crypto Market is currently experiencing a bullish trend,., driven by several key factors.
📰🗞️Get & Read the Fundamental, Macro Economics, COT Report, On-Chain Analysis, Sentimental Outlook, Future Trend Move:
Before start the heist plan read it.👉👉👉
📌Keep in mind that these factors can change rapidly, and it's essential to stay up-to-date with market developments and adjust your analysis accordingly.
⚠️Trading Alert : News Releases and Position Management 📰 🗞️ 🚫🚏
As a reminder, news releases can have a significant impact on market prices and volatility. To minimize potential losses and protect your running positions,
we recommend the following:
Avoid taking new trades during news releases
Use trailing stop-loss orders to protect your running positions and lock in profits
💖Supporting our robbery plan 💥Hit the Boost Button💥 will enable us to effortlessly make and steal money 💰💵. Boost the strength of our robbery team. Every day in this market make money with ease by using the Thief Trading Style.🏆💪🤝❤️🎉🚀
I'll see you soon with another heist plan, so stay tuned 🤑🐱👤🤗🤩

BNB at a Crossroads: Can It Hold Above $600?BNB has been making headlines with rising trading volumes and growing ecosystem interest, particularly around meme coins like TST. But while attention is increasing, BNB’s price has slipped over 3% this week, showing that hype alone isn’t enough to sustain momentum.
Technical Indicators Signal Uncertainty
BNB’s Directional Movement Index (DMI) paints a picture of indecision:
📊 ADX at 14 – Trend strength remains weak after fluctuating between 11.1 and 16 in recent hours.
📉 +DI (Buyers) at 22.5 – Briefly surged but lost steam after peaking at 30.3 earlier.
📈 -DI (Sellers) at 23.5 – Gaining momentum, up from 14.2 yesterday.
Meanwhile, the EMA lines are tightening, signaling consolidation rather than a decisive uptrend or downtrend. The Ichimoku Cloud also leans bearish, suggesting BNB is at a critical moment.
What’s Next for BNB?
📌 Bullish Scenario – If BNB holds its ground, it could regain momentum and retest key resistance levels.
📌 Bearish Scenario – If selling pressure continues, BNB risks falling below $600 in the short term.
Despite its ecosystem growth and increased trading volume, the market’s hesitation shows that investors are waiting for a clear direction. Will BNB bounce back or break down?

BNB (SHORT+LONG TERM) Outlook After a good reaction from a Fib-Golden Zone from Daily Chart.
+MSS is done on Internal structure on 1hr, it hopfelly will go +MSS on 4HRs.
Then, based on Fib, will reach 1,000$ with the support of Fundamentals of Alt coin Season, and maybe exceeding 1,000 to 1,400 - 1,500 $.
Best of luck and you feedback is important.

BNB’s Explosive Comeback – Next Stop, ATH?CRYPTOCAP:BNB is currently exhibiting strong bullish momentum, making its way toward a key resistance zone near its all-time high (ATH).
The price is recovering from a critical support level and has reclaimed the ascending trendline, signaling renewed buyer confidence.

BNBUSDT 1WBNB Update ~ 1W
#BNB Don't miss this trade,. Buy gradually on this support Block zone
#BNB If you still have Conviction on this coin. This support block would be a very good buying place for now,. It's only a matter of time for this coin to make a new high.

BNBUSDT 1WBNB ~ 1W
#BNB If you still have Conviction on this coin. This support block would be a very good buying place for now,. It's only a matter of time for this coin to make a new high.

BNB / USDT : approaching key resistance, Let's seeBNB/USDT is approaching a key resistance level. The price has been consolidating recently, setting the stage for a potential breakout. If the price successfully breaks above this resistance, it could trigger a significant bullish move.
Key Points:
* Trendline Resistance: BNB/USDT is nearing a critical resistance level that has previously halted upward momentum.
* Volume Surge: A significant increase in trading volume during the breakout would confirm strong buying interest.
* Momentum Indicators: Positive trends in momentum indicators like RSI and MACD suggest bullish potential.
Confirming the Breakout:
* Clear Candle Close: A decisive 4-hour or daily candle close above the trendline is crucial.
* Volume Spike: A surge in trading volume during the breakout indicates strong buying pressure.
* Retest of Resistance: A retest of the broken resistance level as support strengthens the bullish case.
Risk Management:
* Stop-Loss Orders: Implement stop-loss orders to limit potential losses.
* Position Sizing: Adjust position size to align with your risk tolerance and overall trading strategy.
Disclaimer: This analysis is for educational purposes only and should not be considered financial advice. Always conduct thorough research before making investment decisions.


BNB trendBNB is one the best crypto ever...
It can touch 900$ and the blue box can be a good area for buying BNB...

Is BNB Due for a Correction or Continued Climb?BNB technical analysis update
BNB's price failed to break its major resistance zone on the weekly chart. It still looks bullish in the weekly timeframe, and we can confirm the bullish movement once the weekly candle closes above the resistance zone.
BNB's price could move sideways or slightly bearish before making a new high. 👀
Reagrds
Hexa

BNBUSDTBNB analysis
Weekly and 12-hour timeframe
I expect the price to move towards higher targets after the correction to the 12-hour supply area. If I lose the 12-hour demand area, I expect the price to return from the weekly demand area.

BNBUSDT Hit New ATHBNBUSDT Technical analysis update
The price of BNB hit a new ATH a few days ago. The price is now bouncing back after retesting the previous support at $670. We can expect a bullish continuation.
Buy zone : Below $695
Stop loss : $655
Regards
Hexa

BNB 3 months accumulation about to breakout BNB / USDT
BNB showed stability against BTC moves and printed Long accumulation in ascending triangle pattern since last march
A breakout is expected soon !
Incase of successful breakout we can see strong bullish wave
Keep an eye

BNBUSD 1DBNB ~ Updated
#BNB The retest of the support line of this pattern has been successful.
Rocket Takes Off Soon

BNB retracing back to 50%??this could be possible
the on monthly and weekly we can see the price action is sell on high and buy on low, and price recently hit the high and forming triangle on the daily time frame
we can see rsi falling and with price it could be bearish divergence
450-425 is the 50% from the swing low
let see how the structure forms .......


BNBUSD 1DBNB ~ Updated
#BNB Finally managed to break the resistance line of this pattern, A retest is expected from here, to continue the rise.
