Bnbusdtlong


BNBUSDT i.using the fibs from January's expansion, price is consolidating at equilibrium 365zone (fibs 50%)...
ii. price got rejected twice around 290-279zone(fibs 62%) indication a possible push back up but the equilibrium zone is a major hurdle as well as 443zone (fib 38%), 413zone, 485zone
iii. A break below 350zone (S turn R) exposes 244zone and further breakage exposes price to 190 order block (4hr), Sweet Spot
iv. a break above 486 zones/4hr trendline would expose the 553 (fibs 78%) leg up
blue lines indicate buying opportunities, Redlines indicate hurdles on the way up or selling opportunity
Not a financial advice, just my thoughts


BNBUSD BUY/LONG INCOMING OPPORTUNITY 400 to Potentially 1150TICKER CODE: BNBUSD
(UPDATE AS OF 18 May 2021)
Company Name: Binance
Industry: Crypto Currency / Blockchain
Technical Analysis
1. Falling Wedge Forming (Expect the market to squeeze down during this pullback
phase to reach Fibonacci Retracement at 0.618 / 0.786
2. Repeated Trend Pattern
3. HIGHER LOWS TRENDLINE sitting on the 0.618 Fibonacci Level
4. Area of confluence at Fib 0.618 level
Should the market break and close below the trendline we might be looking at a change of
trend direction
Entry: NOT READY (350.00-400.00)
1st Partial Take Profit: 860.00
2nd Partial Take Profit: 1150 (I would consider cashing out around 80-90% of initial investment here)

BNB is back BNB is likely to pass EMA20 at $585 which then has to pass $615 before we can say correction is over. If this happens next Targets are $691 and then $796.
if it fails to pass EMA then price will drop to $480.

BNB to DIP more in coming daysCrypto market is not going through a good phase at the moment and looks like this is far from over.
Even BNB has dropped to 500 level yesterday and going by the chart, looks like BNB has entered a correction wave, of which it has completed 1 stage of 3, at point A.
There would be a short recovery at point B at around 600. When it reverses from Point B, then we will have more confidence that it will be heading towards Point C in a 5 step movement.
Crypto is still moving in Bearish mode so trade wisely and keep your greed horses under control.
f you like my analysis then do drop a LIKE and a COMMENT. Also do SHARE it with your friends.
Also don't forget to smash that FOLLOW button to get daily analysis of multiple crypto currencies and sometime ASX stocks.
Note - These are my personal notes and in no way a financial advice. Do your own research and Trade wisely

$BNB - $800 on the cards Pretty self explanatory
Break from bull pennant
Now consolidation
Could argue bearish H & S forming so looking for bearish pattern failure heading into bullish continuation

BNB towards $1,000Binance Coin (BNB) looks ready for the next leg up. A rally towards $1,000 is expected in no time.
AMDEL

Great buy opportunity in BNB🚀Hello guys
As we can se price is moving in Ascending triangle from few days and now it could trying to Break it out.
- Wait for the Candle closure above the Green Resistance box or enter at the Trendline of the triangle.
- Put your Stop Loss below the breakout candle or green support area.
- Take Profit: Trail it with a Trailing SL.
If you find this helpful and want more FREE forecasts in TradingView
. . . . . Please show your support back,
. . . . . . . . Hit the 👍 LIKE button,
. . . . . . . . . . . Drop some feedback below in the comment!
. . . . . . . . . . . . . . And do follow me on Twitter for EXCLUSIVE Market updates: @mywealthstory
Your Support is very much 🙏 appreciated!
Happy Trading

BNB breaking up bears tried to pull price below EMA20 which were not able to sustain it with this bulls will test $680 resistance one more time and if manage to sustain price above it then we may expect rise to $760 and then $808.

BNB BULLISH AFBNB broke out of bull flag (Triangle formation) history will repeat.
Easy Targets: 700, 800, 1000


BNB analysis May 8th, Bulls may break $680If the price falls below $579 and sustains then it can fall to $451. Conversely if the BNB rebounds off the 20-day EMA then uptrend resumes. there is a resistance at $680 which it has to break in order to reach $808.


BNB/USDT : Possibility for breakout and MACD is being bullish BINANCE:BNBUSDT
Hello everyone 😃
BNB has formed a symmetrical triangle and now it's reaching the verge of triangle.
MA50 is above movement now and it's acting as a resistance for BNB, So there will be a rejection on this triangle...
MACD has been moving on bearish side for 3 days now; MA100 has reached $580 level.
So we might see a pullback if BNB reached that zone !
$610 - $580 is acting as a stiff support zone for BNB on MACRO view and there will be a minor support zone on MICRO view on current zone ( $590 - $597 ).
Also MA100 has reached this level and MA200 is planning to test this level in next days. So it seems that bulls will manage to make a reversal point for BNB on this zone !
🔰 There is a chance for BNB to break this triangle from current level and bounce after a retest.
🔴 Have to mention that BTC has reached the resistance level and it could be bad for ALTs if BT rejects to break higher level again ! Trade with caution.
Any rejection below MA200 can makes BNB extreme bearish !
Hope you enjoyed our analysis about BNB's possible growth🙌
You can support us with your likes.
Also you can share your opinion with us in comments 😉🙋🏼♂️
Attention: this isn't financial advice we are just trying to help people on their own vision.
Have a good day!
@Helical_Trades

BNB ascending triangle breakoutBNB broke the ascending triangle and did the retest.
Now, we have good support above ATH.
Target: U$800 (+26,5%)


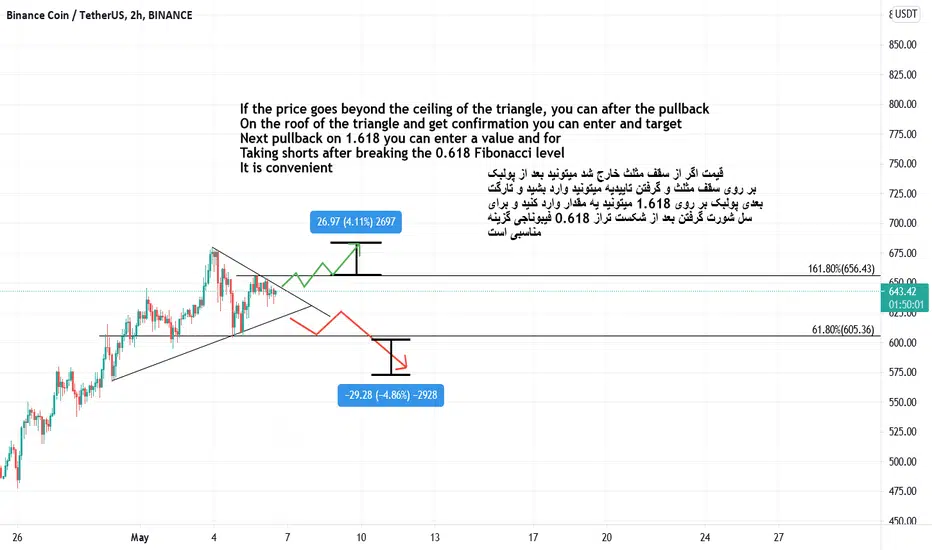
BNB/USDT triangleBNBUSDT
If the price goes beyond the ceiling of the triangle, you can after the pullback
On the roof of the triangle and get confirmation you can enter and target
Next pullback on 1.618 you can enter a value and for
Taking shorts after breaking the 0.618 Fibonacci level
It is convenient
bnbusdt/bnb neutralBINANCE:BNBUSDT
All scenarios of rising and falling prices of this currency with Fibonacci

BNB-USD Possible scenariosPossible scenarios I am looking at:
1. BO and retest of the highest daily close(case 1).
2. Consolidation and then BO(case 2).
3. Drop to the lower boundary of the rising wedge and then Pump(case 3).
P.S: This is NOT investment advice. This chart is meant for learning purposes only and is a part of my personal journal. Invest your capital at your own risk.
