BNBUSDTPERP
BNBUSDT 1D: Possible LONGBNBUSDT 1H: Possible LONG
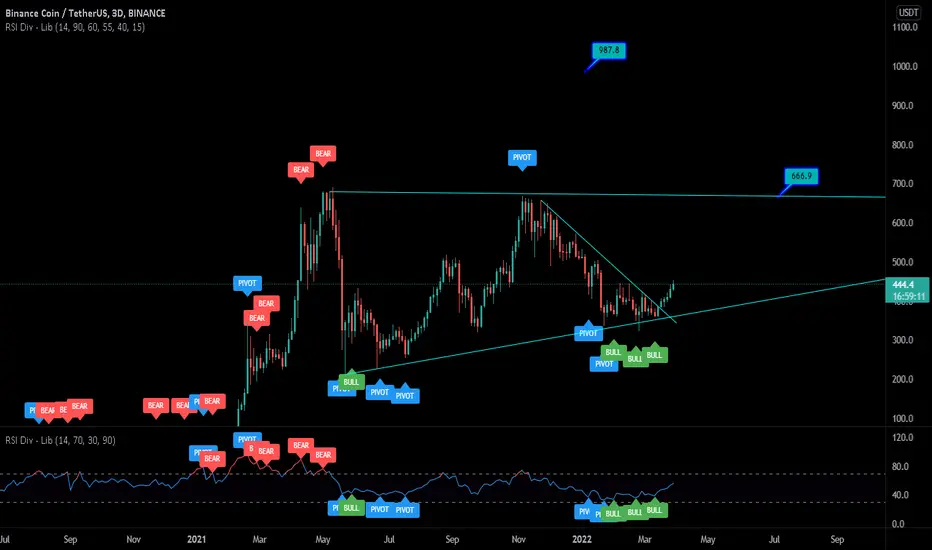
D1: it is possible to break through the level of 430 and then rise to the level of 500 - the first target, 670 - the second target.

BNB USDT PERP RISING WEDGEAn idea in 4H time frame.
Entry at the breakout.
CL 413 USDT
TP1 397.5 USDT
TP2 371.7 USDT

BNB/USDT DAILY TF UPDATEHi guys, This is CryptoMojo, One of the most active trading view authors and fastest-growing communities.
Do consider following me for the latest updates and Long /Short calls on almost every exchange.
I post short mid and long-term trade setups too.
Let’s get to the chart!
I have tried my best to bring the best possible outcome in this chart, Do not consider it as an
BNB is breaking out from the falling wedge in the daily time frame and also looks like a bullish flag-like structure.
Entry range:- CMP
Target1:- $442
Target2:- $508
Target3:- $572
Target4:- $650
Target5:- $840
SL:- If any daily candle closes below $330 then I'll exit.
This chart is likely to help you in making better trade decisions, if it did do consider upvoting this chart.
Would also love to know your charts and views in the comment section.
Thank you

cakeusdt long positionPancake Swap has come to this day due to its stupid policies because this amount of tokens with this high profit of steak tanks has really increased the $ 40 currency to $ 6, but it seems that it is reforming its policy and reducing the profit of steak tanks. Has created the futures trading section inside an exchange office and it also burns tokens on a monthly basis. This can be a good entry point.

#BNB/USDT 2HOUR UPDATE BY CRYPTOSANDERSWelcome to this quick BNB/USDT 2hour analysis.
I have tried my best to bring the best possible outcome in this chart.
Hello members welcome to our BNB/USDT quick update
As we can see in this chart that BNB created an inverse HEAD AND SHOULDER pattern inside the triangle pattern and it broke the upper trend line and moved to retest the upper trend line which will be the confirmation that we can take some position at that level.
In the current scenario, we should wait for confirmation.
If BNB breaks down the upper trend line and moves again inside the triangle then this chart will be invalidated.
Entry;-$399
Target:-80% TO 100%
Stop loss:-$390
With leverage 3x to 5x
Share your views in the comment section.
Remember:-This is not a piece of financial advice. All investment made by me is under my own risk and I am held responsible for my own profit and losses. So, do your own research before investing in this trade.
Happy trading.
Sorry for my English it is not my native language.
Do hit the like button if you like it and share your charts in the comments section.
Thank you...

BNB IS READY TO GO FOR NEW ATM LONGHi guys, This is CryptoMojo, One of the most active trading view authors and fastest-growing communities.
Do consider following me for the latest updates and Long /Short calls on almost every exchange.
I post short mid and long-term trade setups too.
Let’s get to the chart!
I have tried my best to bring the best possible outcome in this chart, Do not consider it as an
BNB is breaking out from the falling wedge in the daily time frame and also looks like a bullish flag-like structure.
Entry range:- $360-$370
Target1:- $442
Target2:- $508
Target3:- $572
Target4:- $650
Target5:- $840
SL:- If any daily candle closes below $330 then I'll exit.
This chart is likely to help you in making better trade decisions, if it did do consider upvoting this chart.
Would also love to know your charts and views in the comment section.
Thank you

BNB is about to pick up with full strengthHello traders!
BNB was bearish since Nov 2021 but now the market is collecting some strength to pick up.
The formation of BNB is completed and now it's at the bottom of a rise.
We can see an inverted 'J' pattern after a breakout. This is a pullback pattern. It forms below support so that market can pull itself.
Why does BNB form a channel after an Inverted 'J'.?
You must understand one thing that every pattern has some kind of strength and it helps the market to react and every pattern has limited energy. After a certain movement, it loses its energy.
Most of the patterns have 1:2 energy means they can't help the coin to move more than that and after that market forms another pattern for the next move. And if there are two pullback patterns then we can see 1:3-1:5 move in a single impulse.
Correction is not a pullback pattern but the pattern after a correction is a pullback pattern. So we have 2 strong pullback patterns and now we can expect a strong rise from BNB.
Now let's talk about the Doji candle.
I was always taught and learned that if there is a Doji wick at support or trendline then we will see a rise from there and everyone teaches it like that and that's wrong, it does not work in that way, when I was searching the truth I figured out that there is 25% chance that market will rise and 75% chance that market will continue the drop.
So why are we buying it now?
Only because we have multiple pullback patterns and also Doji candle which is just one more bonus point.
If you like my analysis then please click the like button and follow to stay connected

BNB/USDT DAILY UPDATE Hi guys, This is CryptoMojo, One of the most active trading view authors and fastest-growing communities.
Do consider following me for the latest updates and Long /Short calls on almost every exchange.
I post short mid and long-term trade setups too.
Let’s get to the chart!
I have tried my best to bring the best possible outcome in this chart, Do not consider it as an
BNB is breaking out from the falling wedge in the daily time frame and also looks like a bullish flag-like structure.
Entry range:- $360-$370
Target1:- $442
Target2:- $508
Target3:- $572
Target4:- $650
Target5:- $840
SL:- If any daily candle closes below $330 then I'll exit.
This chart is likely to help you in making better trade decisions, if it did do consider upvoting this chart.
Would also love to know your charts and views in the comment section.
Thank you

BNBUSDT-SHORTBased on technical factors there is a short position in :
📊 BNBUSDT Binance Coin
🔴 Short Now 381.1
🧯 Stop loss 400.0
🏹 Target 1 371.0
🏹 Target 2 356.5
🏹 Target 3 321.0
💸Capital : 1%
We hope it is profitable for you ❤️
Please support our activity with your likes👍 and comments📝

BNB IS READY TO GO FOE NEW ATMHi guys, This is CryptoMojo, One of the most active trading view authors and fastest-growing communities.
Do consider following me for the latest updates and Long /Short calls on almost every exchange.
I post short mid and long-term trade setups too.
Let’s get to the chart!
I have tried my best to bring the best possible outcome in this chart, Do not consider it as an
BNB is breaking out from the falling wedge in the daily time frame and also looks like a bullish flag-like structure.
Entry range:- $370-$390
Target1:- $442
Target2:- $508
Target3:- $572
Target4:- $650
Target5:- $840
SL:- If any daily candle closes below $350 then I'll exit.
This chart is likely to help you in making better trade decisions, if it did do consider upvoting this chart.
Would also love to know your charts and views in the comment section.
Thank you

BNBUSD Recovery idea BNBUSD is currently falling under the 50MA which is quite bearish for the price, we may see price go down to 1.272
BNB in the longer term however is very bullish and this dip should be used as an opportunity

BNBUSDT 1 DAY ANALYSIS Hi guys, This is CryptoMojo, One of the most active trading view authors and fastest-growing communities.
Do consider following me for the latest updates and Long /Short calls on almost every exchange.
I post short mid and long-term trade setups too.
Let’s get to the chart!
I have tried my best to bring the best possible outcome in this chart, Do not consider it as an
#BNB breaks out this descending channel we can expect to retest the upper resistance of this descending channel which is around $390.
Entry: $390 - $395
Targets- $440 - $500 - $600- $700
Only for a spot (not recommended to buy in leverage)
Stop Loss: $380
This chart is likely to help you in making better trade decisions, if it did do consider upvoting this chart.
Would also love to know your charts and views in the comment section.
Thank you

BNBUSDT - Ready for Trend BreakoutBNBUSDT (1D Chart) Technical analysis
BNBUSDT (1D Chart) Currently trading at $407
Buy level: Above $112
Stop loss: Below $332
Target 1: $438
Target 2: $500
Target 3: $565
Target 4: $660
Max Leverage 2x / Spot Market
Always keep Stop loss
Follow Our Tradingview Account for More Technical Analysis Updates, | Like, Share and Comment Your thoughts

BNB/USDT ANALYSIS 4H TODAYBNB valid breakout bearish trendline and expecting retest on support trendline
If can't sustain on support trendline possibily fake breakout

BNBUSDT 4H: Possible LONGBNBUSDT 4H: Possible LONG
On the H4 chart, we observe the following local scenario - breaking through the level of 388, which may be followed by an increase to the level of 445.

BNB/USDT 2 HOURS ANALYSISWelcome to this quick Update, everyone.
If you are reading my updates for the first time do follow me to get more complex charts in a very simplified way.
I also post altcoin setups on Spot, Margin, and Futures.
I have tried my best to bring the best possible outcome in this chart.
BNB/USDT is making this bullish expanding Triangle pattern.
Entry: $368 - $ 373
Targets- $380 - $390 - $400 - $410 - $420
LEVERAGE-5X - 10X
Stop Loss: $355
Stay tuned
What's your thought on this?
Do hit the like button if you like this update and share your views in the comment section.
Thank you
#PEACE

BNBUSDT: US DOLLAR BULLISH OUTLOOK, COULD BNB MOVE LOWER AGAIN?Hello Cryptocurrency Enthusiast! Help the Channel Growth by smashing the FOLLOW and LIKES Button, then Share your opinion on the Comment Section below :)
BNBUSDT is creating a ascending broadening wedge , We will wait for the breakout as the confirmation of the potential bearish continuation to the target area.The roadmap will be invalid after exceeding the resistance/target level
*Now We put all the explaination on the chart* Enjoy!
*DISCLAIMER:
This isn't a recommendation to buy or sell cryptocurrency, only an Outlook from technical perspective.
*FOLLOW FOR MORE CONTENTS AND UPDATES*

BNB will retrace back soonHello traders!
From 16 Feb Market is extremely bearish and the overall scenario is still bearish but I am expecting some retracement now. This dip will be the final dip after that I am expecting some rise.
After the breakout of 390 figure, I am expecting a 7% rise in BNB. This retracement will end at 420. Most probably we will see another dump after the retracement. But after the retracement, it's important to take action according to the reaction at 420.
Don't forget to hit the like button and follow to stay connected

BNB/USDT 6 HOURS ANALYSISWelcome to this quick Update, everyone.
If you are reading my updates for the first time do follow me to get more complex charts in a very simplified way.
I also post altcoin setups on Spot, Margin, and Futures.
I have tried my best to bring the best possible outcome in this chart.
BNB /USDT breaks out this bullish expanding triangle pattern and retests it.
Entry: CMP or inside the box
Targets: 40%
Stop Loss: 370$
What's your thought on this?
Do hit the like button if you like this update and share your views in the comment section.
Thank you
#PEACE

BNBUSDTIn Daily time frame, there's a major trendline, which is broke upsideside, but still not retest it, So I'll use this setup for 4hr timeframe.
On 4hr timeframe there's H&S and Cup&Handle pattern. Firstly wait for breakout at 440 level. Then we'll enter in trade, Otherwise if pullback coming, then I'll use DCA, and will put some limit order at 395. Take your own risk accordingly with that SL TP everything.

BNB/USDT 4HOUR UPDATE BY CRYPTOSANDERSWelcome to this quick BNB/USDT analysis.
I have tried my best to bring the best possible outcome to this chart.
BNB/USDT is looking bullish and falling wage pattern and buys the dip green zone
entry:-$395
$410
target;-$423
$439
$456
$472
$500
stoploss:-$385
Remember:-This is not a piece of financial advice. All investment made by me is under my own risk and I am held responsible for my own profit and losses. So, do your own research before investing in this trade.
Happy trading.
Sorry for my English it is not my native language.
Do hit the like button if you like it and share your charts in the comments section.
Thank you...

BNB SHORTBNB and all alts are in a small downtime and also today is Sunday while tomorrow is Monday can be bloody too , I have entered BNB short around 402 today and will continue to ladder till 415 while a sl can be stepped at 435-440 my first take profit will be around 375 which was last low and can be ladder to more low if situation got worse. I believe there are much more fundamentals this time then analysis, always I recommend to trade according to your own idea. I am here not giving any financial advice its just my trade that I am showing to you , your loss will be your only while your profit will be yours only
