BNTX BioN Tech Options Ahead of EarningsAnalyzing the options chain and the chart patterns of BNTX BioN Tech prior to the earnings report this week,
I would consider purchasing the $115usd strike price Calls with
an expiration date of 2025-9-19,
for a premium of approximately $17.40.
If these options prove to be profitable prior to the earnings release, I would sell at least half of them.
BNTX
An event to analyze is comingWhen we have two ceilings and a lower floor, it is equal to the beginning of a descending channel that can be drawn and in the direction of the same channel in the support and resistance areas.

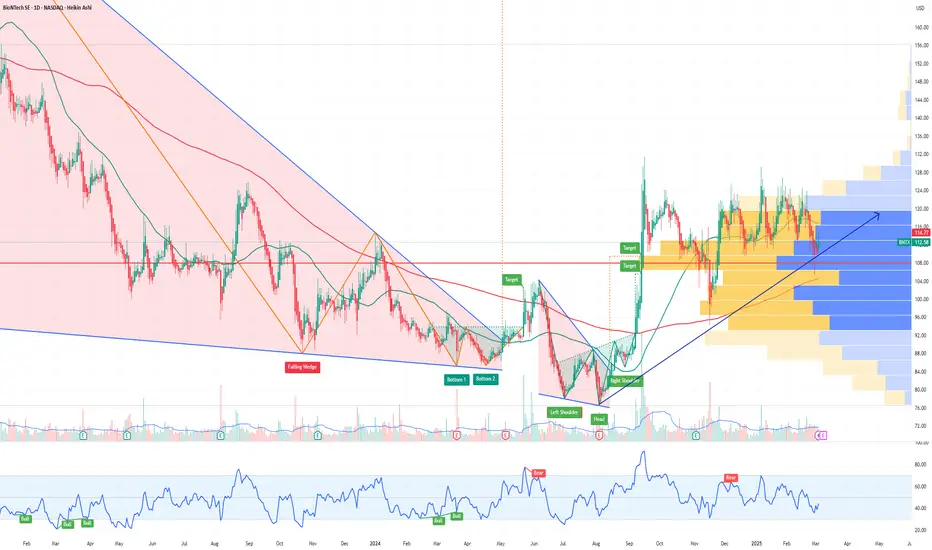
BionTech Fastly Approaching Major Resistance, Will we Break?Hi Guys, this is a Technical Analysis on BionTech (BNTX) on the 3 Day Timeframe.
We are currently approaching a MAJOR RESISTANCE Trendline.
This Trend started from the TOP in 08/2021.
Everytime we've interacted with it in the past, we've been REJECTED.
Will we get Rejected again?
Well, we've had 3 touch points already. In trendline theory, it states that atleast 3 touches are required before a trendline is weak enough to break through. So, it is possible that a break can occur.
With risk of new variants, hospitalizations of COVID increasing and a push of government to get people to get boosters, this could be a chance for Trend change to UPSIDE for BNTX.
BUT just looking at it in a pure TA lens, i wouldn't just start buying now.
I would wait for a break above the Trendline and CONFIRMATION above it.
Also with the break, note that VOLUME should be spiking and increasing.
We should not see a DECLINE in Volume as we break through.
That can be signs of a FAKEOUT.
We are also reaching some Resistance from a Support line turned Resistance line.
Now lets look at our indicators for more evidence.
RSI -> We've had the Lowest RSI reading on May 09,2023 EVER in BNTX history. This could be a catalyst for more buying pressure and a trend change. We also broke above RSI Red Resistance line.
MACD-> A momentum indicator, has crossed BULLISH, below the 0 level. If we continue this bullish momentum and the Blue/Orange lines move above the 0 level, this can be inject the well needed momentum for BNTX to increase in price.
STOCH RSI -> Is also in a BUllish cross and it shows that theres plenty of room for momentum to continue.
__________________________________________________________________________________
Thank you for taking the time to read my analysis. Hope it helped keep you informed. Please do support my ideas by boosting, following me and commenting. Thanks again.
Stay tuned for more updates on BNTX in the near future.
If you have any questions, do reach out. Thank you again.
DISCLAIMER: This is not financial advice, i am not a financial advisor. The thoughts expressed in the posts are my opinion and for educational purposes. Do not use my ideas for the basis of your trading strategy, make sure to work out your own strategy and when trading always spend majority of your time on risk management strategy.

BNTX biotech / currency play LONGBNTX a Germany company in the biotechnology and vaccine sectors out of Europe
and Germany is looking good on the 2H chart here with a volume profile and an
intermediate term VWAP overlaid. Price bounced off the bottom of the high volume
area of the volume profile and looks to be ready for a reversion to the mean and even
a sling-short move. The target here is the double top M pattern of mid July at 114.
The VPT and MACD are confirmatory of a momentum flip making for a long trade
entry. I will review the options chain for a suitable options trade with a narrow bid/ask
spread, suitable volume and open interest. If I cannot find one I'll take a trade of
10-20 shares of stock with a stop-loss of 105 to back up this trade while NVAX and MRNA
are also making moves.

BNTX: NICE BOTTOMING BASE ON THIS VACCINE PLAYBNTX (BioNTech) Healthcare sector
German company. Produce the BioNTech biotechnology. Partnership with Pfizer.
Nice long bottoming base since March.
Triple bottom .
It looks like a rectangle pattern .
All moving averages turning up .
A move above the blue zone (>195) could take it to 248 and maybe more.
I'm long with a stop at 165.
Trade safe!

MRNA & BNTX are free callsDoji (W) on both stocks
Fundamentals are terrific:
Forward cash and equivalents make those stocks nearly free ( pipeline, production capacity, distribution networks priced at 0) :
- most contracts for 22 are already signed and/or partly cashed in (US still negotiating for MRNA),
- contracts signing for 23 has started as well as governments have to be ready ( access to the doses) in case of new Covid waves
- MRNA is developing a new concept (2 MOU signed) that i d call PAAS for biotech ( government would be entering into a 10 years agreement in exchange for benefiting of their own capacity and modularity of vaccines development and production). The point being like for SAAS and PAAS in IT pricing model would be recurring.
So fantastic defensive stocks in the current environment ( favoring cash, dividend and real assets ) and then we might get lucky as well !

$BNTX Amazing Range Trade till BrakeI see an Interesting range, when it brakes above I will wait for a confirmation and Jump in.
Why now buy at the bottom and don't risk too much?
Above Resistance (with Confirmation) - BNTX Great Place to buy for a LONG!
- TILL $300
- ANALYST SAY $212.
SO GET PAID on the WAY

BNTX is facing an armed angry bear !Angry bear has mad a weapon integrating three powerful and heavy elements and waiting for the stock to hammer it down !
Long term down trend line , 200 days moving average and lost golden ratio Retracement level are the elements of the bear's weapon.
Can BNTX make a heroic attack and defeat the angry bear? Not without a powerful comparable weapon I think. It needs a brilliant earning report or next wave of Covid or more positive sentiment in all market to survive facing such a frightening enemy.
Anyways, I am excited to watch this up coming battle ! Who wins? Lest follow and watch closely.

BNTX will pop-up on next earnings dayBNTX will pop-up on next earnings day.
Technicals suggest the stock has been building a bottom the last couple of months. Now is well above the 50 day EMA and it is begining to challenge the 200 day EMA.
The P/E ratio and Forward P/E ratio are in the low single digits.
I expanded my position when BNTX crossed above the 50 day EMA.

$BNTX Buy Above $ 170 or Sell Below 159Buy Above $ 170
TGT- 180
TGT-2- 186
SL 159
Sell Below 159
TGT- 153
TGT-2 149
SL 165

Free Fallinnnnn $bntx has NO volume support until green box 24% lower... #bntx
——————————————————————————————
Top 10 trading tips:
1. DO NOT FOMO into a trade. Let it come to you. Don’t force it.
2. Find a strategy that works for you and be consistent. Operate like a machine and less like the wind.
3. Let your winners run and cut your losers short.
4. You will not win every trade, but if you are disciplined with great RM you don't need to be right all the time to win!
5. Before you enter a trade, know your target AND your exit strategy.
6. When you are up, you can use a trailing stop or trim off some profit at a logical resistance point with a stop loss at breakeven.
7. Set your trade parameters up front so you keep your self accountable and remove emotions from the equation. (stop loss, take profit levels, etc)
8. Don't fight the trend. The trend is your friend.
9. Don’t enter a trade based on one indicator.
10. Horizontals > Diagonals
Please note:
- This is not financial advice.
- I do not take every trade I post.
- Never trade off of someone else's chart until you DYOR!

BNTX HIGH RISK TO REWARD SETUP YOU CAN'T MISSNews - Better than expected Q4 EPS and sales results, the company expects to authorize a shares repurchase program up to 1.5B over the next two years.
Levels -$195 is the next major resistance level.
$138 is the next major support level.
The stock is gapping up to $183 (pre-market).
The idea is to go long at the open when it will try to test the $183 support level and fail, then go long above the 5M bull flag pattern if it will happen.

BNTX Earnings BreakBNTX has broken out nicely upon earnings
it also aligns nicely with the pattern price is portraying which is an ascending scallop, commonly considered a bullish pattern

BNTX LONG SETUPWe just finished Elliot wave 1-5 and ABC pattern, already bounced off of a strong demand zone and 71.8% fib zone we can enter right now but our R/R ratio is 1.7 since we missed first bounce, what we are looking for is a retrace to our entry point ant 71.8% fib zone and enter there. Also market made a gap at 182 zone which has to be filled. Also a gap at 325 zone, which also needs to be filled.
AROON: On a daily chart AROON already shows bullish momentum (Orange line above blue one)
Bollinger band: we already bounced off of a bottom Bollinger band which indicates bullish direction movement.
Entry:119 (We can enter right now but for better R/R I would suggest to wait for a retest at the entry zone, though it might not do that and we might miss a trade)
Invalidation: 79 ( Just below Demand zone )
Target 1: 292 (50% FIB ZONE)
Target 2: 325 (Second gap zone)
Ratio if we wait for retest: 4.38
Ratio if we enter right now: 1.75

PFE still lower to go. Pfizer looks to test $50, and possibly the gap around 46~ if things get really ugly. Omicron is looking really promising as granting significant immunity after infection, which should reduce demand for further vaccinations. These vaccines companies have YEARS of covid priced into their stocks... Short side is getting a bit long in the tooth for new entries, however I am still holding 2/3rds of my puts across the board for these plays.
We posted our short thesis in another thread www.tradingview.com

Biotech in bearish trend50sma has been an important moving average for this ETF.
We see 3 consecutive tests of the 50sma as resistance and a bounce lower.
As we see lower highs and lower lows, the bearish trend is confirmed.
I expect we fail again and test the blue line ($144.5).

BNTX still could be profitable!Enter after breaking the trendline.
Even if the end of the epidemic has a big impact on the price, it is still possible enter a long position and be a winner!

Descending wedgeBNTX looks to be in a descending wedge and coming to its peak.
I have highlighted the red line horizontal resistance levels to watch in the event of a breakout.
Orange lines are the nPOC levels of interest.
Green line should be major support area at 120.
Descending wedge PT would be top of wedge.

Biontech in an interesting spotBiontech seems to be at a critical point and repeating a couple of previous runs.
Pattern will be more defined by next week whether that run would happen or not.

Biontech Analysis 22.12.2021Hello Traders,
welcome to this free and educational analysis.
I am going to explain where I think this asset is going to go over the next few days and weeks and where I would look for trading opportunities.
If you have any questions or suggestions which asset I should analyse tomorrow, please leave a comment below.
I will personally reply to every single comment!
If you enjoyed this analysis, I would definitely appreciate it, if you smash that like button and maybe consider following my channel.
Thank you for watching and I will see you tomorrow!

BNTX LONG +5, +30 +150 % channelI will buy Biontech after breaking through the turquoise bold line. In doing so, I will set a short stop lose at 0.4% below this line and will raise it over time. Next, I plan to buy after the next thin turquoise line is broken, if the indicators favor buying.
This is not a financial recommendation.
Take care.


BNTX massive breakBreak is happening today, Could take it today or wait for an extra candle, I might wait
But chart looks pretty good
