BA: Watch for the bounce backAs we had more and more bad news and fast-growing covid cases there was a general downtrend beginning from March. Now we are getting to good levels of support to buy.
That’s my trading setup
1. Buy: 204.83
Stop loss: 203.23 (-0.74%)
First Target: 220.69 (+7.68%)
Second Target: 230.49 (+14.49%)
2. Buy: 192.53
Stop loss: 191.07 (-0.70%)
First Target: 204.83 (+7.09%)
Second Target: 220.69 (+15.43%)
I think it is more likely that we see a bounce back at 204$ range. We have the opportunity of a double bottom, have support of the 400 SMA (orange) where we often saw great support (green marked). Daily RSI is oversold (bullish), MACD is pretty neutral.
At the second buy we reach the bottom of the parallel downtrend line to bounce up and double bottom with the strong support of 192.49$.
Boeing

$BAIt’s always good to look at the higher timeframes, Boeing still in a uptrend on the daily/weekly charts.
Might be a good time to put this on your watchlist in case of a break of trend or reversal.
- Factor Four

Spirit Airlines - Whiplashed Hopium poggers jumped the gun. *valuation matters. Small caps with growing revenues TODAY matter most in rising rate environment.
$GNLN
#thegem
#MSOgang
#cannabisreform JOBS & Justice

When you thin that Boeing is gonna fly.... Sell ScenarioHello!
Nice uptrend, but we have a head and shoulders on the chart.
The price breakout the neckline, we expect a retracement to the next support!
Enjoy!

Boeing 21% in 9 days but we did not take profitWe are back at our entry price after 3 months. its time vs return. We would have had 21% in 9 days but oh well

(Request by user ktaba) BA: Price is consolidatingPrice broke down down back in mid July and the up trendline supported well. It then retraced to neckline and followed by a small sell off before stabilizing at current price.
It seems like price is going to be in consolidation for awhile. Depending on the price action of the consolidation, that will give us a hint on its next move.
As price is currently in the middle of a long pennant pattern, I won't be buying or selling yet.
However, the other airlines are showing signs of slowing down in the selling pressure. BA seems to be the stronger stock. Therefore, my bias is towards buying should the next few days shows weakness in selling pressure as well.
Disclaimer: I'm not giving any trading and investing advice. I'm just sharing my chart observations.
If you have any symbols that you'd like me to analyze, feel free to drop me a comment.

$BA - Thoughts on Boeing for August and onwards...For this analysis, I'm using Gann fans and Fibonacci retracements to help predict upcoming price action for BIG DADDY BOEING!
By comparing fans (and squares) from two different time frames (and after identifying confluences), we can use those confluences to define support and resistance levels within the current trend.
AT LEAST THAT'S WHAT I'M TRYNA DO HERE.
I'll be watching for a successful Starliner launch on Aug 3rd as a signal of Boeing's return to bullishness (after an early week flirt with 220).
Who knows. I sure don't. But I like my chart so at least there's that.
What do you think??

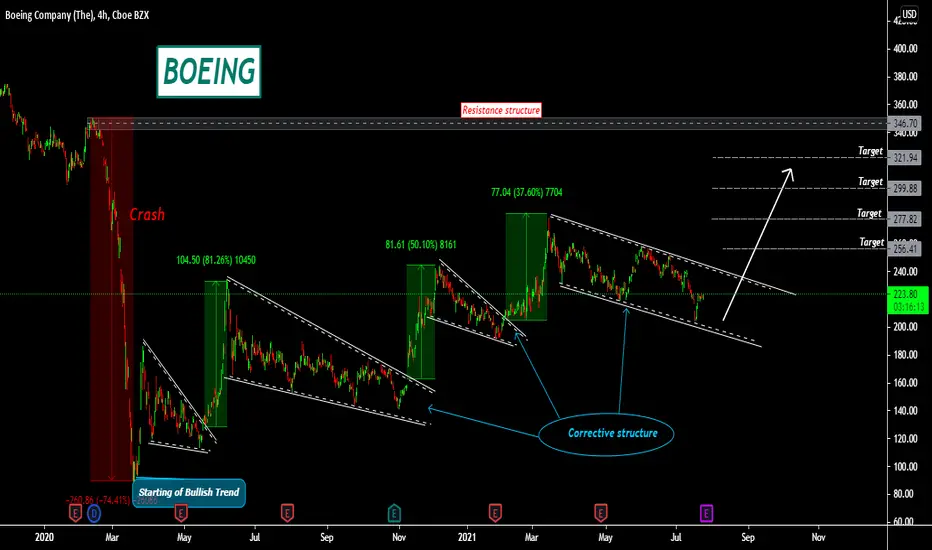
BOEING - THE SETUP TO 300'SBoeing shocked everyone today with a surprise beat on earnings. Here is the setup as we can now say that ABC correction wave has ended and we're now on the way to completing the major 5 wave but in the midst of the minor 1 wave.
236.21 is a major Volume distribution zone and if above, I think we can see 244-245. Depending on where this correction occurs, I plan to enter again on the minor wave 2 down which should retrace around 50-62% (on average) of wave 1 length. From here we can begin our journey into the upper green box (green box will change depending upon the length of wave 1 and pullback % of wave 2) - This is merely a projection right now.
#Boeing #BA

BOEING preparing for next bullish impulse.....!!!Boeing(BA)
After every impulse price makes a correction and after the break price starts the next impulse, I expect the same this time..
Push LIKE & SUPPORT the Idea...
*The content on this analysis is subject to change at any time without notice, and is provided for the sole purpose of assisting traders to make independent investment decisions.
Boeing prone to crashUnfortunately, Boeing does not have a good chart at all, and if the important support range of $ 200 is lost, we can easily see the price range below $ 100.
Investing in Boeing is low risk when it can stabilize above $ 300 for a few months.

It is time to short boeing.All right folks, boeing on the 1day has officially broke the VWAP and has continued to fall post-market. Now is a good time to take advantage of the negative news as well as the market correction. Delta rising, boeing problems rising (mechanical, etc).
Why short boeing
MACD bearish volume with no curve
VWAP broken without big bounce at VWAP
RSI has new LL
Targets:
192.36
175.42
Falling to BBand at 158 would be pushing it but for a longer term holder could be plausible.
SL @ 219
Good luck
Please note: I do short term holding, will not hold this position longer than a day or two. Check back for updates.

Long Run on Boeing BALooks like BA has reached potential support.
Looking for signs of bottom to go long on the 15 min chart and for the 100ema to cross under the 200 on the 4 hour into daily chart to present possible price reversal.
Looking for entry around $200 - 190.
Take profit around $300
Technical Analysis:
Positives:
1. In line with post Covid trendlines.
2. RSI below 30
3. OBV shows slowing of selling
4. MACD around neutral
Negatives:
N/A
Fundamental Analysis:
Positives:
1. New drone project expected to raise billions
2. Large United Airline order (200 -737 max)
3. travel increasing as Covid restrictions lift
4. China approval of the MAX will likely happen in the second half of the year.
Negatives:
1. Airbus taking market share
2. Chip shortage slowing production and creating backlog
3. declining sales trend for planes
4. China trade relations are a mess
* Not trade or investment advice, trade at your own risk.

BOEING COMPANY (BA) for long positionSignals
Position: long Entry price: 198
Target price: 230 Stop loss: 200
Indicators
RSI is very low, better to wait till the price touches the support line around 198.
Bullinger bands and Keltner channel are opened, meaning a strong trend. So the price will probably reach the support. Same clues from the MACD .
Conclusions
Boeing is going to be fine despite the near-term turbulences. Recent weaknesses from the stock is an entry opportunity for long positions and also for long term positions.
Clearly from the lines the trend is positive.

BA - DAILYBA
ENTRY 200 - 205
1st Target = 223
2nd Target = 266
3rd target = 308
______________________________________________________________________________________________________________________
This content is for informational, educational and entertainment purposes only. This is not in any way, shape or form financial or trading advice.
Good luck, happy trading and stay chill,
2degreez

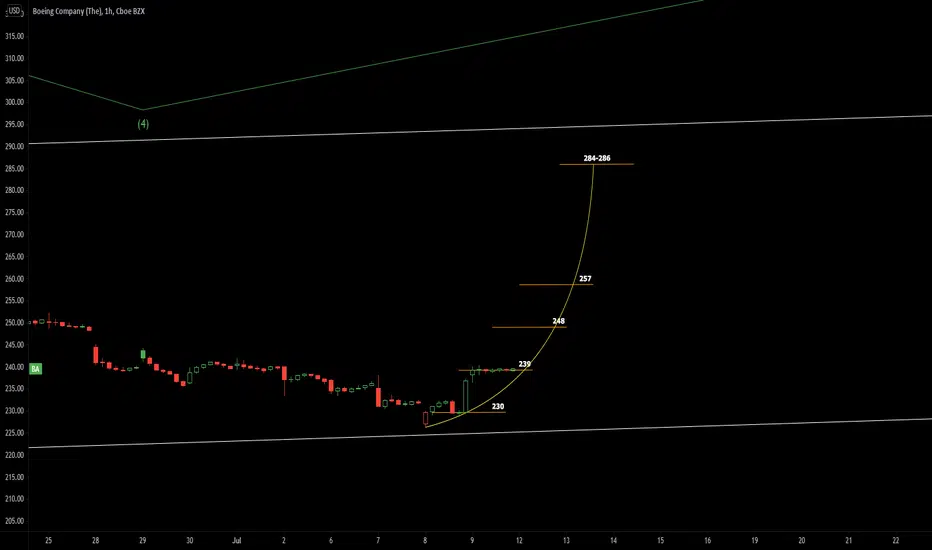
BA - Hourly Parabolic Steps Loved the bounce and these hourly steps look like the starting stage of parabolic steps. We had a nice base put in and then BA pushed higher and consolidated on Step 1. We caught this setup early and took the 01/21/21 270C's on Thursday last week after seeing $7.5 Million hit the 01/21/22 290/295C's on our option flow scanner. Looking for advancement to step 2 and possibly step 3 this week. Pattern would be invalidated on a retracement below previous step.
Looks good here and makes sense after the bounce from bottom of the long term channel.
$BA $BA #Options #Investing #Stocktowatch
boeing for longterm invest fibo 61% is short tem target but fibo 161% show boing will see 700$ until end of 2022
we strongly advice buy boeing ,ford,deoutche bank DB (for hold min 1 year)
good luck


Boeing Head & Shoulder support line has brokenI'm long Boeing so hate to see this but the support line of the head and shoulders formation has just broken.
The 200 SMA is just below and could act as support, although historically it hasn't done.
The projection down is quite severe.
Company reports earnings on July 28 which could change things, or accelerate. My stop will have been long hit by then I expect.
H&S isn't a guarantee anything will happen but its not a good sign either. If I can get a bounce off the 200 I will look to at least reduce my position size.

ba ewt outlook (long term)wave 4 target = 60 (into next year) - may see one last push up. safe to short once spy tops out.
wave 5 target = 1559

BA!!! Price target is $250-$251. 242.5 calls exp 7-23
Macd crossover. Parabolic Sar. And sitting above the 200 ma boom

BA Filling Out Huge Triangle1. Boeing is filling out a huge triangle, with the base formed by the 75% price drop from March 2020. It has consistently tested the bottom leg of the triangle and responded with strength, each time reaching the top leg of the triangle. The triangle is narrowing around current price, and a break to the topside would yield significant upside after this long consolidation. Repeated strength at the bottom leg is significant to the bull case, and currently indicates upside strength.
2. There was a fake breakout of the triangle in March of 2021, forming a small peak at 260.00. A few months later, price touched the top of the triangle at 258.00. The next target on the triangle is around 262.00, so the resistance range is 258.00-262.00.
3. Price just tested the bottom leg of the triangle, and the 200 EMA (blue) has fallen out of the triangle. For the bull case, the 200 EMA needs to cross back into the triangle for confirmation of a continued uptrend. Following this, price should test the top of the triangle and continue to fill it out. Earnings at the end of the month could weigh heavy on price, and a positive report can break the triangle to the upside.

Go long LMTTrading in a channel with some healthy consolidation. 50 day SMA passed through 200 day SMA (Golden Cross)
Trading at a discount with only a 15 P/E ratio.
Fair Value Estimate from Morningstar: $436
Implied Upside from Last Close: 15%
Lockheed just landed a big sale to Switzerland of their F15 jets beating out Boeing

BA - Symmetrical Triangle" in an "Ascending Triangle?"Boeing received good news, "Boeing Max Edges Toward China Return as Test Flights Near."
- 20MA & 50MA above the 200MA.
- Bullish Engulfing pattern on Thursday (7/8/21) w/ strong bullish volume.
- Bounce off of Symmetrical support. Could revisit 200MA (yellow line) to test a bounce if bullish momentum is short lived.
However, I am uneasy about the market in general (inflation, COVID variations, etc.). BA could potentially drop back to $221 before climbing to $253.65, unless more good news is released.
Short Term: BULLISH (2 weeks)
Hedging with 8/20 Puts wouldn't be terrible.
