Boeing Capable Of Major Cliff Drop. Back to $90 Easy...Boeing could play out of this descending triangle to the downside, in doing so, I would expect a target of $90. We can figure such if the Macro climate keeps going in a recession as I expect.
Boeing


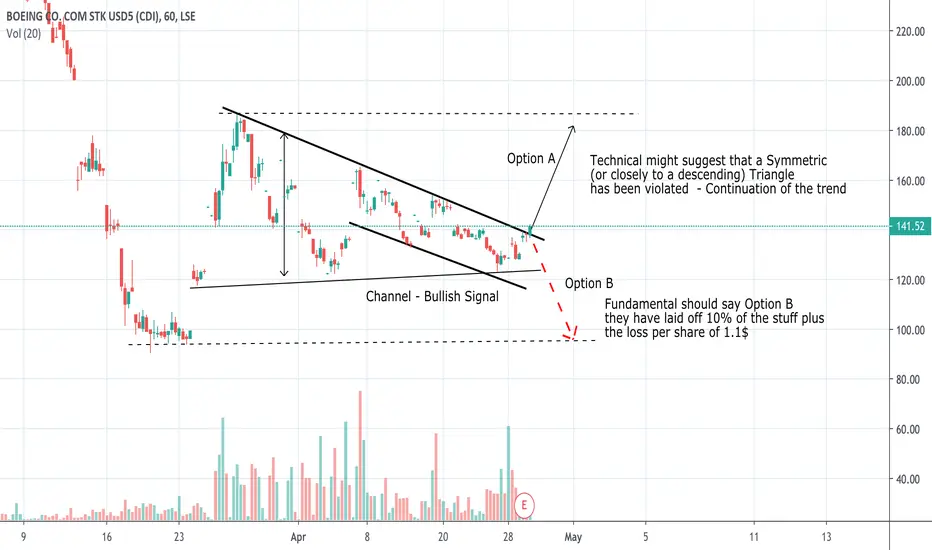
BOEING Stock Analysis - "Stand Aside"Option A - Based on technical approach I would stand aside because I am not convinced about those descending prices and volume at the breaking point, but, I am tented to go long due to the Channel Pattern, volume (increased at the previous opportunity of price to rise) and the Symmetrical pattern that with the channel pattern makes the continuation signal stronger - Go long up to the level 180
Option B - 95 Dollar - Based on Fundamental Info (Reduction of shares and employees)


$BA PT $250I'm bullish on $BA due to the economy slowly starting to open up. I also believe congress will write up another relief bill, giving citizens more money in the near future. I personally think we can see $250 by August or sooner. Good luck and stay safe.

Boeing - ShortBoeing just broke out of a bearish pennant. Both Boeing suppliers and customers are struggling keeping their doors open with no timeline insight.
There is still plenty of room before the March lows are retested.

Daily Review: CAT, BA and QQQAs U.S. markets continue to rally against all odds at the expense of overly eager bears and quite frankly rational investing. Is it finally safe to assume the low is in? Despite the Dow Jones Industrial Average and S&P 500 closing in the red, a lot of positive could be taken away from this week. The point I'll make today is not to get overly bullish. I'll show you why by analyzing CAT, BA, and QQQ.
Where's the Support?
The first chart is Caterpillar Inc. (CAT) on the weekly. Price was strongly rejected at $126.60. Additionally, it is possible that a descending trendline has been established. The focus right now is on support and respecting the downtrend. CAT is a risky buy at these levels, especially with Q1 Fiscal 2020 earnings being reported on Tuesday, April 28. Furthermore, over the last three quarters CAT has failed to meet estimated revenue, and going into Tuesday it's a safe to say that trend will continue.
There is one interesting characteristic I will note on CAT. The consolidation between September 2019 and March 2020 is characteristic of a Wyckoff distribution (see below). Could CAT be a leading indicator or just one of many sectors that have been ravaged by the COVID-19 pandemic? Bias: Bearish .
Buy the Dip?
Boeing Company (BA) rallied just over 100% after capitulating at $89 per share. Congratulations if you bought the dip and pat yourself on the back if you sold the top of that dead cat bounce ! Yes, I suspect a dead cat bounce and risk of further downside.
The BA chart may be as bearish as it gets as it has slashed through its long term trendline that had been support since 2009. To make things worse, going into the monthly close next week, price is getting rejected at $164.80. This area of resistance is important, as it was previous resistance for a span of two years between February 2015 and December 2016. I would become slightly less bearish if BA can reestablish itself above $164. In the meantime, book profits and continue to sell into rallies. Bias: Bearish .
Fighting the Trend
One of the first lessons I learned trading was that the trend is your friend. The reason why I say this is because in my view next week is set up perfectly for more gains across the board. Reason? Look no further than the Nasdaq Composite.
Above, is the daily view of the PowerShares QQQ Trust, an ETF representing the Nasdaq 100. The QQQ has recently reestablished support within RSI bull market territory. I would be holding off on shorting until weakness is clearly established. Why short into a market full of stocks that have maintained bullish momentum despite the global crisis? Reminder, Tesla, Zoom, Netflix and Amazon are all part of the index. The trend remains intact...for now. Bias: Bullish .
Looking Forward
The market is at a crossroads. What is the trend being established? Are we in a bear market or bull market? As a trader, I try not to get hung up with where we are and focus on where the market is heading. Feeding a bias is a good way to get left behind. Keep an open mind but stick to the principles you established to analyze the market.
This weekend, I have a crypto outlook and semi-conductors outlook. Have a great evening.

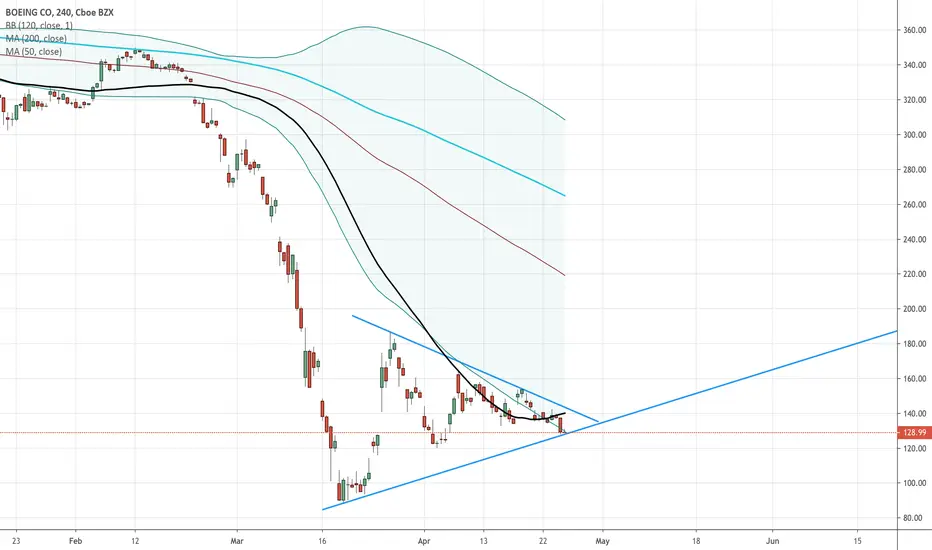
Critical Moment for BAEarnings are coming on 4/29 - a lot of bad news should be expected on this call, but keep in mind... a lot of bad news is already built into the current price. Symmetrical triangle pattern means the stock is bound to break one way or the other. At these levels, the long-term upside is much greater than the short-term downside. Long-term investors should buy.

RISKY AAL "LONG"We have a pretty strong resistance at $10.. we have broken it once which resulted in a 40% BOUNCE! I bought some calls in hope of a strong bounce.
Earnings date is 4/24 (on Friday) which will make this a risky long, stop loss for traders would be 9.05..
Good Luck! I am not a professional.

Boeing Boeing 187; Can Stimulus Save This Chart?✨ We provide charts every day ✨
Like and Follow to help us grow family! 🎉
---
Looking to open a short on Boeing (BA). The COVID-19 stimulus should be helping the company, but the chart looks like it has more downside potential.
---
STRATEGY USED:_Silver Scalper
Trend Confirmation = Range MA
Entry Signal = Bull/Bear Power
Exit Signal = Bull/Bear Power OR Range MA
---
1. Range MA is showing a downtrend (Red bar color) for BA on the 4 hour chart.
2. Price has broken below the bottom trend line (White Line).
3. We are waiting for a Bear signal from Bull/Bear Power to confirm a short entry, ideally this will be produced by a retest or a false breakout of the trend line we broke down from.
5. If we do get a breakout to the upside will be looking to see how price reacts at R1 - R2 resistance.
6. If we go lower we will look for reactions at S1 and S2 support.

BOEING Co. $200 in JuneBOEING Co. as quarantine will end anyway, after May BA will rise gradually to $200. It's great time to add BA to your portfolio. It will take years to reach high of 2020 $350. For longer term forecast we need to wait May.

$BA nice short today off ascending support from daily chart.Nice clean ascending support that was tradable today intraday!
Enjoy.
xeenos trading - sending positive energy to all those watching!


BOEING STOCKShares fell 6.75% to close at 143.61 on the stock market today. Rival Airbus (EADSY), facing coronavirus headwinds of its own, lost 2.6%.
Top 737 Max supplier Spirit AeroSystems (SPR) gave up 7.8%. General Electric (GE), which makes engines for the 737 and the Boeing fighter jets, dropped 4.8% in Monday.
China's CDB Financial is the second lessor to cancel Boeing 737 Max orders in as many days. On Friday, General Electric's (GE) GECAS scrapped orders for 69 jets. The coronavirus pandemic has brought air travel almost to a halt.
In March, Boeing saw 150 Boeing 737 Max orders cancelled. The jet's grounded around the world after two deadly crashes.
The planemaker hopes to get the plane back in the air by mid-year.

Who Making Millions of Dollars on a BOEING 737 CRASH?!Who made Millions shorting people lives?!
Can technical analysis prevent such tragedies happen to the people?

BOEING "SHORT" (neutral risk)I see a perfect opportunity to short Boeing, at around $144-150. There is a descending triangle forming, I'm expecting a fall to the 120s.. potentially even lower. Stop loss is set at the resistance line which is $150 (a break which invalidates the descending triangle.)
There is a possibility airline bailouts occurring could ruin this trade. I believe airlines won't open up any time soon and will continue to suffer no matter the bailout. I am expecting the trade to work well.. worth the risk in my opinion (expecting this after hour PUMP to be shorted).

Symetrical triangleI have spotted a symmetrical triangle on (BOEING 1D) I believe we will see a break above or below, I am waiting to see if we get a further squeeze of the triangle before entering the breakout. If you like my idea please feel free to like, comment, & share.

BOEING CO (BA) MonthlyDates in the future with the greatest probability for a price high or price low.
The Djinn Predictive Indicators are simple mathematical equations. Once an equation is given to Siri the algorithm provides the future price swing date. Djinn Indicators work on all charts, for any asset category and in all time frames. Occasionally a Djinn Predictive Indicator will miss its prediction date by one candlestick. If multiple Djinn prediction dates are missed and are plowed through by same color Henikin Ashi candles the asset is being "reset". The "reset" is complete when Henikin Ashi candles are back in sync with Djinn price high or low prediction dates.
One way the Djinn Indicator is used to enter and exit trades:
For best results trade in the direction of the trend.
The Linear Regression channel is used to determine trend direction. The Linear Regression is set at 2 -2 30.
When a green Henikin Ashi candle intersects with the linear regression upper deviation line (green line) and both indicators intersect with a Djinn prediction date a sell is triggered.
When a red Henikin Ashi candle intersects with the linear regression lower deviation line (red line) and both indicators intersect with a Djinn prediction date a buy is triggered.
This trading strategy works on daily, weekly and Monthly Djinn Predictive charts.
This is not trading advice. Trade at your own risk.

Boeing Weekly View, Interesting Reversal SetupI like this reversal hammer candle on BA on the weekly. When you combine that with the stock is up on just about nothing but hope and the .gov backstopping it, I like the odds of a drop next week from here.
Almost half their revenue comes from commercial airplanes, no one is buying
The Feds are only about 30% of revenue
The MAX may never fly again. Getting it certified is not a guarantee
They tapped out their entire credit line, the debt is unbelievable
I'm bearish on the company long term because the fundamentals do not make any sense to me in the current environment.

HOW I'M PLAYING BOEING $BABoeing hit the fib retracement right on the money. I'm looking to play Boeing in the range (the blue lines) between 133-160ish roughly, a break above 160 will send us off to 180+, a break below will send us to 122.
