LONG BAExpecting bounce from extremely oversold weekly and daily levels. If stop breached, be prepared to catch new daily reversal on lower levels with a tight stop.
Boeing

Boeing Short (Wyckoff Distribution Structure)The fundamentals do not seem to be in Boeing's favor, and price action on the Weekly looks like a textbook example of a Wyckoff distribution pattern. I'm expecting this to be a pretty reliable short this year, save for the risk of manipulation due to the amount of significant players with NYSE:BA exposure.

Head and ShouldersWatching a head and shoulders formation here on the weekly. What’s interesting is the lack of support below the pivot low at 285. If that pivot is tested and doesn’t hold, this thing is a falling knife.
Keep an eye on this for a potential short opportunity.

BUY BA/USD Long 737MAX First Flight (Boeing)Buy BA stock
Entry 304.86
Entry 2 298.48
Sl 283
Tp.1 318.84
Tp.2 336.80
Tp.3 348.38
Tp.4 358.74
Tp.5 368
tp.6 378

SOLD MY Boeing position at 325,26 too much downside pressure !! I decided after keeping the stocks a while hoovering the 340 wish limits and making money selling at the money calls
I don't think this game is worth it anymore as the downside risk is much greater in the short term especially if the airline scheduled the flight back in June
Dont expect the 737 MAX to be scrapped this is too much of a blow politically against one of the US symbol such as Boeing , the 737 Max will fly again
But short term I can see the 320 support breaking down so better come back when visibility is clearer , on my watchlist

Delta flight, Boeing planeRecalled back to LAX after leaving for China. Dumped fuel on a playground effecting kids and teachers. Other schools also supposedly hit but nobody effected at those locations. Reports are it smells like jet fuel around the playground and there's vid of a plane dumping fuel nearby.
One of the flight stats sites is how I found it's a Boeing 777 based on the flight number (89).
Watch these tmrw. Possible big shorts. You know at least Delta will probably have to settle, and if ANOTHER Boeing flight was having issues.... They could be paying up too on any law suits that may come about if any do.

Boeing: $180 Target On a Prolonged 737 Max CrisisIn case Boeing fails to clear the mess around its 737 Max model in 2020, we may see a move below $200 to complete the symmetrical triangle pattern.

BOEING 1W DESCENDING TRIANGLE BREAKOUT SHORT TRADE Descending Triangles are repeatable trading chart patterns.
Descending chart patterns will have a directional bias depending on the previous incoming trend.
Each chart pattern will have defining trendlines of the support/resistance levels creating the pattern.
What ever time frame you are trading this chart pattern, wait for a candle close outside of the trendline in the direction of the breakout candle. (Our time frame preference is the Daily chart).
Add volume indicator - Volume is the amount of $ that went into a particular candle or in Forex the # of trades that took place.
Add ATR indicator - Volatility is the amount of price movement that occurred. Use the ATR to measure the price movement.
When you see descending Volume bars and descending ATR line (which indicates volatility) this shows
a dis-interest in traders to invest in this pair creating consolidation which creates the chart pattern.
Trade Management after there is a breakout candle close.
1 - Position size (compare volume bar to volume ma line).
a - Breakout candle must be 100% of average volume for a full position size.
b - If 75% of average volume then ½ position size. (To find 75% of Volume
look at the charts volume settings – divide smaller # into larger # = 75%+)
2 - Enter two trades.
3 - SL for both trades will be 1.5 x ATR.
4 - 1st trade TP will be 1 x ATR.
5 - No TP on 2nd trade – letting profit run and adjusting SL to follow price.
6 - When 1st TP hit – move 2nd trade SL to breakeven.
7 - Adjust the 2nd trade SL to follow price.
*8 – After Breakout candle – if price closes back into chart pattern close trade
*9 - When breakout candle is more than 1 ATR from breakout candle open.
a - Enter 1st trade at candle close with ½ position size.
b - Enter 2nd trade with a pending limit order that is 1 ATR of breakout candle open.
c – Price should pullback to that pending limit order for 2nd trade.
d – If Price returns back into chart pattern close trade before SL is hit.

Boeing - outlook for Q1Hi Traders
When watching Boeing stock on the Daily time frame we see, that since June 2018 this stock is in distribution stage - moves mostly sideways after a longer uptrend. On January 7, 2020 we got another Bullish Signal from the Hitman. This signal appears right under the EMA 8, 21 and 34 which could act as resistance. I would be careful to buy into this right now. But it could well be worth the risk as possible target range could be around 378 $.
As long as price doesn't drops below 320 $ I would consider the stock in the distribution stage and short term traders can still make money. Everything under 320 $ has to be watched very closely with a potential decline coming up.

I'm generally bullish on $BA I'm generally bullish on $BA for a number of rasons. Recent updates on the 737MAX downed in Iran seems to identify the cause on exogenous variables (a missile).
The company is nonetheless improving 737Max pilots' training and, technically speaking, the chart shows higher lows, meaning the trend line is positive.
***As usual, not a trading advice, merely my view for informational and educational purposes only***

Boeing forming Multiple Head and ShouldersWeekly Chart :
The time will tell, but meanwhile the chart tells us that the odds pointing to huge Reversal Pattern.
Multiple Head and Shoulders contains several shoulders, in our case 3 from each side.
Note the huge volume spike in the Head.
Note the inner Neckline and the Outer Neckline.
Short trades will be taken when the price will break down the outer line by a range that equal to 3% from the price at the moment.
If the breakout will carry Peakup in volume, it is more safe to wait for retest on the lines and then take the trade.
The first Target is 250.
Good Luck!

$BA is in an important zone$BA has overshot almost every conceivable range in the past few years.
Lately, due to time constraints, I have been trying to scope out longer time frame opportunities. So, I'm trying to train myself to start large, zoom in, make assessments, and then be patient for the right opportunity.
Starting from a 1M chart, here is what I see:
The previous expanding wedge was absolutely smashed to pieces, with $BA soaring from $156 in Dec of '16 all the way to above $400 in the past 4 months.
Let me preface the rest of this post with this: I expect $BA to have more of a retrace from these levels, back to the $260 zone in the next 12-18 months.
Right now, the monthly RSI is pretty oversold, but that doesn't mean the price has to go up. In fact, a zoom into the weekly tells us the near-term is likely up:
Depending on how this weekly candle closes tomorrow, it may be bullish (near term). But I wouldn't expect it to get too far above the 200ema on the 1D any time soon.
Note that weekly RSI is also a bit oversold and may be in need of some relief.
However, it's important to note the line of support we are teetering on right now. If this line is broken, you can expect some red waterfalls to more stable price levels where buyers will step in.
A zoom into the daily time frame shows us very clear indecision in the market - with $BA being range-bound between roughly $320 and $380 since making its massive ascent from the $160 range to above $300 in Dec 2017.
I also think it's important to note the symmetry in this structure. On both the weekly and the daily, the first and second half of the range are very similar in structure.
Essentially, in the coming months, I will be waiting to see a daily close below this price range in order to go short. If this trade is executed, the price levels I'm targeting are $291 and $265:
Will update this idea as time goes on.

Boeing (BA) touched strong 2 years supportLooks like BA stock price, after the bad news that 737 Max has stopped from selling, has touched it's 2 years strong support on 321 per share.
Good time to buy the stock at its two years' lowest price.
If the price will go more than 355, possible breakdown, otherwise fixing profit around 355 per share.

BA Buy Setup 1:2 Risk Reward RatioThere's potential higher low structure forming. Planning to jump at the opening of the market on 30th December. My second entry is going to be buy-stop at 340.80.
BA LONG TRADE SETUP
1. Entry: Opening of 30the December Monday (Market order)
2. Entry: 340.80 (Buy Stop order)
SL: 312.16
1. Profit target: 345.70
2. Profit target: 364.50
Disclaimer: This is not financial or investment advice
Trade safe
Atilla Yurtseven

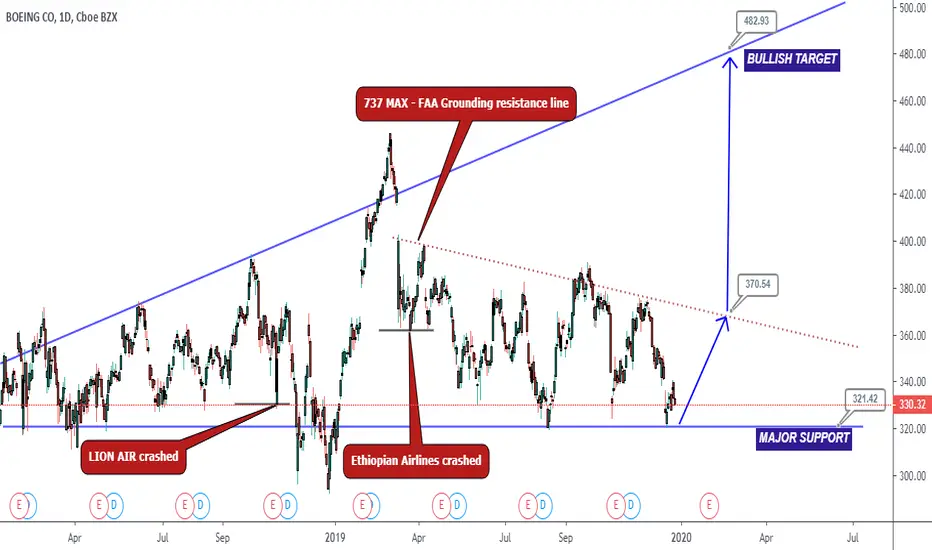
Boeing Stock : 737 Max Technical analysisInvestigators suspected that a newly implemented automated flight control feature, The Maneuvering Characteristics Augmentation System (MCAS) from Boeing 737 Max are the cause accident at Indonesian Lion Air (October 29, 2018) and Ethiopian Airlines (March 10, 2019).
Aviation authorities around the world grounded the Boeing 737 MAX, and Due to ongoing regulatory uncertainties, Boeing said it would temporarily halt MAX production in January 2020.
737 MAX perform resistance line at boeing stock with target at 370
Bullish may push more higher to 482, because 737 Max its not the only plane that Boeing have.
December 20, Boeing CST-100 Starliner (Crew Space Transportation) success with test flight, NASA allows Boeing to price and sell passage to low Earth orbit
December 20, US awards Boeing $1.4 billion to support foreign AH-64 Apache helicopter fleets
December 26, Boeing secures $560M+ in Apache orders,
December 26, Boeing awarded $400M contract for B-1, B-52 engineering services
and many more boeing new contract at end of this year.
As of June 2019, the Boeing 737 MAX has received 4,934 firm orders and delivered 387 aircraft, if 737 Max able to fly again, Boeing stock will fly to the moon.
BA - Departure of CEO + Narrowing range = :)Boeing (NYSE:BA) has fired embattled CEO Dennis Muilenburg, who oversaw the company during the 737 MAX crisis. He has been at the helm since July 2015.
4% up on news of CEO departure. Exactly the catalyst needed for a break up north past the narrowing resistance level. Look for break above level 355-360 in coming days.
RSI bouncing back from oversold conditions, bollinger bands breaks on BA have historically prodcuced 5-10% rips up.
The board decided that a change in leadership was necessary to restore confidence in the company moving forward as it works to repair relationships with regulators, customers, and all other stakeholders," according to a press release.
Look to set stop around @ 310, take profit @ 365-370.
As always... DYOR.

BA - Swing to $350 while still holding longChart and recent movement make me convinced we are headed back to the downward resistance. Always been a BA fan and continue to hold it long while swinging the volatility.
BA is a strong company and will be back to ATH before people know it. Discount even at these levels and would still consider picking up shares on any dips. Very optimistic lines drawn of how I think it'll play out till MAX approval but the market is what it is. RSI looks to have bottomed and slowly climbing back up followed by MACD. First PT $345.
GLTA

BOEING DIAMOND TOPBoeing forming a diamond top, it's a rather rare pattern but can be profitable if it plays out.


Boeing long term support changed to resistanceAs you can see long term support 330 changed into resiatance

BOEING reversed from resistance, potential drop!
BOEING reversed off its resistance at 334.39 where it could potentially drop further to 319.64.
Trading CFDs on margin carries high risk.
Losses can exceed the initial investment so please ensure you fully
understand the risks.


HEIBeen trading Heico for a few week here before earnings. Being that their biggest customer is Boeing and they are announcing potential halting of production. My personal opinion on Heico is looking Bearish
