Natural Gas, DXY, GOLD , SILVER Price ForecastWelcome to the everyday how to make money online trading with Natural Gas Technical Analysis show, where I give you guys support & resistance levels to potentially play off of. As well as both sides perspective of a bear and a bull to give us a better understanding of where our trades are currently and not have a bias
- Natural Gas Natgas Stock in confirmed daily uptrend
- Strongest resistance for natural gas resistance is 2.86
00:00 Natural Gas stock Bulls NatGas Support & Resistance Guide
06:28 AMEX:UNG technical Analysis
09:28 Gold XAUUSD analysis
11:39 US dollar DXY
14:45 Silver XAGUSD analysis
BOIL

Natural Gas DXY GOLD SILVER Price ForecastWelcome to the everyday how to make money online trading with Natural Gas Technical Analysis show, where I give you guys support & resistance levels to potentially play off of. As well as both sides perspective of a bear and a bull to give us a better understanding of where our trades are currently and not have a bias

Natural Gas Price Forecast | Bull Flag 2.0 formingWelcome to the everyday how to make money online trading with Natural Gas Technical Analysis show, where I give you guys support & resistance levels to potentially play off of. As well as both sides perspective of a bear and a bull to give us a better understanding of where our trades are currently and not have a bias
- Natural Gas Natgas Stock in confirmed daily uptrend
- Next level for natural gas resistance is 2.86

natural gas gold silver DXY forecastsupport and resistance guide natural gas gold silver DXY forecast

Natural Gas - Bullish Close Natural Gas just closed above the daily 200 MA for the first time since Nov 2022.
This could signify a big shift in the Nat Gas market and may trigger funds to start accumulating in the long side as they boil full portfolio positions.

Natural Gas Gold silver DXY Price Forecast support & resistance guide of Natural Gas Gold silver DXY

DAILY UPTREND CONFRIM natural gas gold silver DXY price forecastsupport and resistance guide natural gas DXY gold silver forecast
DAILY UPTREND CONFRIM

Natural Gas Gold Silver DXY Price forecastsupport & Resistance guide Natural Gas Gold Silver DXY Price forecast

natural gas dxy gold and silver forecastsupport and resistance natural gas dxy gold and silver forecast

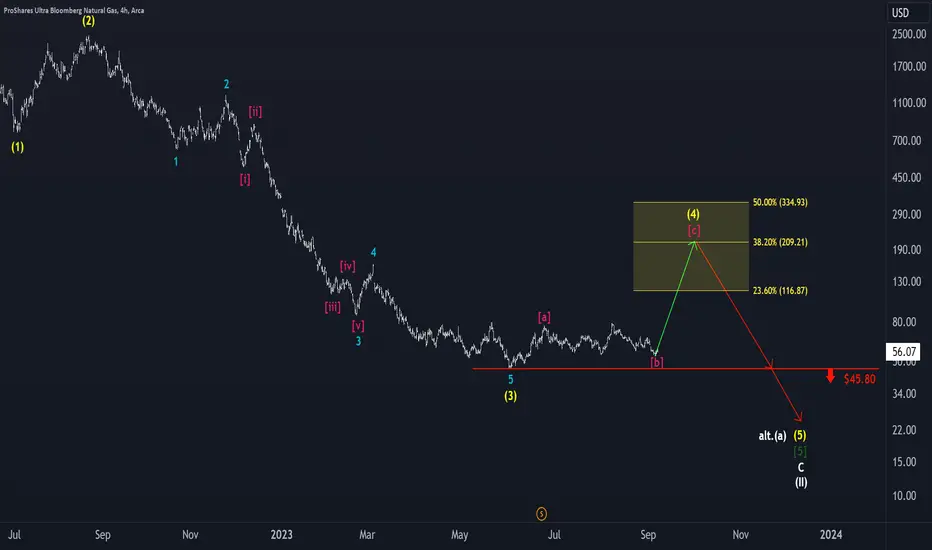
BOIL: One more climb to go 🏔️BOIL's price has successfully wrapped up the magenta wave (b). Looking ahead, we foresee an ascent in the fourth leg of the yellow five-part wave, targeting the yellow Target Zone between $116.87 and $334.93. Following this ascent, a substantial decline is expected, bringing the price down to around $23, signaling the conclusion of the white wave (II). This yellow Target Zone presents an opportune moment for initiating short positions to capitalize on the anticipated bearish movement.
Natural Gas Gold Silver US dollar ForecastSupport and resistance guide of Natural Gas Gold Silver US dollar Forecast

Natural Gas DXY Gold Silver Forecastsupport and resistance guide Natural Gas DXY Gold Silver Forecast
and price action analysis

natural gas DXY gold silver forecast Natural Gas Natgas Stock in daily neutral trend
- Natural Gas Natgas needs a daily trend change to uptrend
- Next level for natural gas needs break hold 2.54

Natural Gas Gold Silver DXY forecast- Natural Gas Natgas Stock in daily neutral trend
- Natural Gas Natgas needs a daily trend change to uptrend
- Next level for natural gas needs break above 2.86

Natural Gas DXY Gold SIlver FORECASTNatural Gas DXY Gold SIlver FORECAST
Price action Trend analysis


Natural Gas Gold Silver DXY ForecastNatural Gas Gold Silver DXY Forecast.
Big bounce but give most of it back


NatGas - No Moon Until DoomIn mid June, I had made a call that Natural Gas was about to rally, because price action and timing supported a move upwards.
Natural Gas - The Girl Who Hopes You Remember Her
But that call became abandoned as I enlightened and improved further, and began to note that rallies were sold off and lows kept being taken.
The trade degenerated into looking at a sweep over $3 and then a sweep over $2.9, and turned into abandonment.
Before we go far, I want to tell you that you need to keep your eyes on the situation with China.
The first thing you notice is that the propaganda machine and politicians are rarely going after "the Chinese Communist Party" but are always going after "China."
This is very strange. China is the world's only 5,000 year country and holds the largest population.
If you think about it even a little bit, the CCP would be so easy to topple, wouldn't it?
Considering the Party has killed a magnitude more of its own people in its century of murder than Hitler did among all races during his years of insanity.
And the CCP and former Chairman Jiang Zemin have the 24-year persecution and organ harvesting genocide against the Falun Dafa spiritual practice hanging over their head like the blade of a guillotine.
You have to keep this in mind and go study it. A really crucial part of the puzzle is that Xi Jinping, for all the criticism and targeting he gets/deserves, has never persecuted Falun Gong.
Instead, Xi's Anti-Corruption Campaign has been killing and ruining the Jiang Faction minions who have conducted and operated the persecution.
Xi has even protected Falun Gong in Hong Kong after fortifying his rule there with the National Security Law following the 2019 Heaven Will Eliminate the CCP protests.
All of this matters very much to the fossil fuels industry because there's a relationship between China and Russia, both in terms of production and demand, that changes greatly if something like the Ukraine War ends or drama over Taiwan suddenly enters nuclear brinkmanship.
Looking at current monthly bars, Natural Gas shows some kind of "Bear Flag."
What you're seeing, really, is an extended consolidation. This is actually potentially really bullish, to the upside, but we need price action to confirm it's time to go.
Unfortunately, July did not show us this.
The sweep of the $2 point and the lows in April was not enough to springboard the move, and that's really telling.
While many may tell you that natural gas is obviously going to a zero-handle, a look at the yearly bars shows such a thesis really does not make sense.
To the contrary, the 2020 pivot should, actually, hold. A classic super long term breakout and retrace.
Moreover, $10 was printed for literally one day in 2022, and that's very strange.
The problem with the moon turning full right now, is shown on 3 month candles, where this current little red blip only has one month left.
This is not a bullish continuation. It's important, in a bullish scenario, to see volume come in and price action to correspondingly reflect that producers want to sell at higher prices and will orca the waves for us normal people.
Moreover, in terms of the overall markets, as I post in this week's SPX call, we may be watching the equities/indexes bear market rally top for real.
SPX - The Sound of a Shattering Iceberg
As for what might be the news driver that harbingers the correction, it may very well be one of the 10 largest banks in America dumping for whatever reason emerges (watch out for commercial real estate):
Charles Schwab - The Harbinger Of The Next Crisis?
I also posted last week that it seems to me oil is about to head for a literal 3-handle.
Oil - A New Long Leg Down Soon Begins
And because we have problems with "Taiwan," which is to say the International Rules Based Order's desire to take over China via Taiwan while the Chinese Communist Party falls, I also believe that Taiwan Semiconductor (TSM) is set up as a probable long hedge through to the end of the year and into 2024:
TSM - Taiwan, Your Semiconductor Long Hedge
Now, in terms of natural gas ranging like it has, sharply dumping, and then beginning a new and major bull impulse, this is not without grounds, for this would be a fractal of the 2020 COVID dump-to-recovery play that saw a doubling into year end:
If this were to play out, we'd see something like $1.60 natural gas into $4.8 by the end of the year or Q1 2024.
After that, we may really see prices that exceed $10 and begin to flirt with all time highs at $15.
The fundamental factors that would cause a 10 bagger on a commodity that literally equates to most of the world's electricity production are fairly significant.
Especially considering "climate change" (lol "climate boiling") is attempting to be used as the pretext/excuse to export the Jiang-CCP Zero COVID social credit system worldwide in a way that far exceeds what was done during the pandemic.
And so for the call, I would say the "short signal" with the markets hanging out in thin air at present, while we're about to begin a new quarterly shift, is a break of the $2.4 level.
You'd want to short that break with a target meaningfully under $1.8 and then cover it without getting greedy.
At that point, it's time to look for longs, and if you're a long term position trader, this may be one of the best opportunities you'll come across.
But it may not really unfold until next year. And this assumes that my analysis is correct.
Right now, daily price action is just showing failure swings, but nobody has stepped in yet to give it the push down the stairs it really needs.

BOIL rises into reversal territory SHORTBOIL as a triple leveraged ETF of natural gas futures- has high volatility
which can translated to high profits for traders who can accurately harness
that energy .On the 2H chart in the time since the reverse split, the price has mostly
ranged up and down between the first upper and lower VWAP lines of the
VWAP anchored to the high in May. Occasionally it has ranged outside those bounds
and then reverts to the mean VWAP. Price is presently at or near the first upper
derivation line where it typically pivots down. The zero lag MACD is suggestive
of an impending pivot down before any signs of it and thus showing bearish divergence.
The mass index is not yet suggesting a reversal. The shorter HMA 56 rising significantly
above the HMA210 is suggestive of overextension into the overbought overvalued
zones of the chart.
Overall, I will put BOIL on watch.
Once a reversal is confirmed I will either short BOIL or long KOLD. Leveraged funds being
what they are and mathematics fixed and hard, shorting a levearged ETF is a faster fall
than its rise so the short position will be my first choice.

Natural Gas is wild!Natural Gas breakout or fakeout?
Our members banked by selling Ung yesterday near the highs.
We do think Nat Gas goes higher after more consolidation.

part 2 of 7 natural gas & mega cap tech and QQQ SPYnatural gas weekly uptrend still intact key battle zone now

BOIL (3X Natural Gas ) Overnight Trade RecapAs a triple leveraged ETF BOIL is highly volatility and typically has a good range
even if the overall price changes only a small amount from one day to the next.
While these overnight day trades are typically conducted on the 3 or 5 minute time
frame, here a 15- minute chart is shown. Because BOIL is tracking natural gas
futures and the futures markets are around the clock , BOIL often has movement
after-hours and in the pre-market while futures markets are active.
In this example, the chart is dressed with double Bollinger band setup with
deviations of 1.618 and 2 618 which are Fibonacci numbers. Relative volatility
and relative volumes are indicated as well to be better attentive to reversals
or trending amplitudes.
In this example at about 12N on yesterday 7/24, price dropped out of the bands
volume and volatility went red to green and the candlesticks formed a morning
star pattern. This is the entry. The stop loss is placed just below the lowest bottoming
wick in the pattern. Today, in the premarket, when the price rose to outside the upper
trade zone and green bars on the volatility and volume indicators fell quickly, the
trade was closed for a realized profit of 4.7%. About 90 minutes later, another
long trade was set up for a more than 4% five hour day trade.
Rinse and repeat DYODD !
