Deep Dive Into Bollinger Bands 🗓This article explores the Bollinger Bands indicator—a powerful volatility tool used by traders worldwide. You'll learn how it works, how to calculate it, and how to use it to detect potential breakouts, trend reversals, and overbought or oversold conditions in the market.
📚 Introduction to Bollinger Bands
In the fast-paced world of trading, understanding market volatility is key to making informed decisions. Bollinger Bands, developed by John Bollinger in the 1980s, offer a visual and statistical method to measure this volatility. Unlike simple moving averages, which only tell you the trend, Bollinger Bands expand and contract based on recent price action, helping traders spot overbought, oversold, or consolidation phases.
These bands dynamically adjust to market conditions, making them one of the most popular indicators for trend-following, mean-reversion, and breakout strategies. Whether you’re trading crypto, stocks, or forex, Bollinger Bands can help you identify high-probability setups by combining trend direction with volatility.
📚 How Bollinger Bands Are Calculated
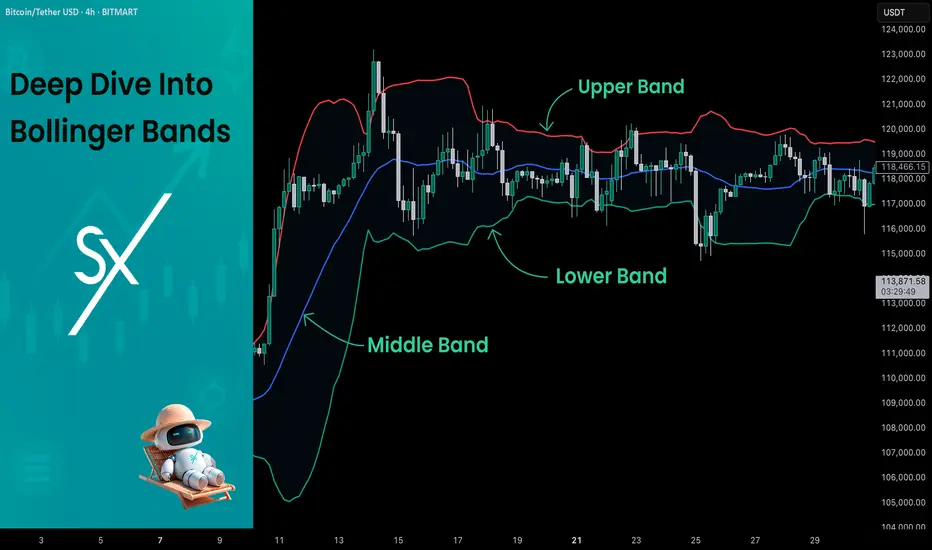
Bollinger Bands consist of three lines:
Middle Band – This is a simple moving average (SMA) of the price, typically over 20 periods.
Upper Band – The middle band plus two standard deviations.
Lower Band – The middle band minus two standard deviations.
Middle Band = SMA(n)
Upper Band = SMA(n) + (k × σₙ)
Lower Band = SMA(n) - (k × σₙ)
Where σₙ is the standard deviation of the price for n periods and k is the multiplier, typically set to 2, which captures ~95% of price action under normal distribution. The middle band shows the average price over the last 20 candles. The upper and lower bands adjust based on how volatile the price has been — expanding in high volatility and contracting in low volatility.
🤖 For those traders who want to implement Bollinger Bands into algorithmic strategy we provide formula it's calculation in Pine Script:
basis = ta.sma(src, length) // Middle Band (SMA)
dev = mult * ta.stdev(src, length) // Standard Deviation × Multiplier
upper = basis + dev // Upper Band
lower = basis - dev // Lower Band
📚 How to Use MACD in Trading Strategies
⚡️Bollinger Band Squeeze (Volatility Contraction and Expansion)
The idea is pretty simple, а squeeze indicates low volatility and often precedes a breakout. The squeeze is the situation when the Upper Band and Lower Band contract, and BB width is at a local minimum. In this case you shall be prepared for the high volatility after the period of low volatility. This strategy doesn’t predict direction — it prepares you for volatility.
Long setup:
Price is in long-term uptrend, you can use 200 EMA as a major trend approximation - price shall be above it.
Bollinger Bands is narrow in comparison to the previous period. Price usually is in sideways.
Open long trade when candle shows a breakout and closes above the Upper Band.
Set a trailing stop-loss at the Middle Band.
Short setup:
Price is in long-term downtrend, you can use 200 EMA as a major trend approximation - price shall be below it.
Bollinger Bands is narrow in comparison to the previous period. Price usually is in sideways.
Open short trade when candle shows a breakdown and closes below the Lower Band.
Set a trailing stop-loss at the Middle Band
📈Long Trading Strategy Example
1. Price candle shall be closed above 200-period EMA. In our example we have BITMART:BTCUSDT.P 4h time frame.
2. Bollinger Bands shall be narrow in comparison with the previous periods.
3. Open long trade when candle closes above the Upper Band.
4. Close trade when price touched the Middle Band.
📉Short trading strategy example
1. Price candle shall be closed below 200-period EMA. In our example we have BITMART:BTCUSDT.P 4h time frame.
2. Bollinger Bands shall be narrow in comparison with the previous periods.
3. Open short trade when candle closes below the Lower Band.
4. Close trade when price touched the Middle Band.
⚡️Mean Reversion (Rebound from the Bands)
This is the most common approach to use Bollinger Bands. The idea is also very simple, we just want to open long if price touches Lower Band and short if price reaches Upper Band. Price tends to revert to the mean (Middle Band), especially in range-bound markets. It's very important to trade in the direction of the major trend to reduce the probability of the large move against you.
Long setup:
Price is in long-term uptrend, you can use 200 EMA as a major trend approximation - price shall be above it.
Open long trade when price touches the Lower Band.
Set the initial stop-loss at the fixed percentage below entry price. Choose this percentage number with your personal risk/money management, you shall be comfortable to lose this amount of money in case of stop-loss hit.
If price reached Middle Band set stop-loss at breakeven.
Close trade when price reached the Upper Band.
Short setup:
Price is in long-term downtrend, you can use 200 EMA as a major trend approximation - price shall be below it.
Open short trade when price touches the Upper Band.
Set the initial stop-loss at the fixed percentage above entry price. Choose this percentage number with your personal risk/money management, you shall be comfortable to lose this amount of money in case of stop-loss hit.
If price reached Middle Band set stop-loss at breakeven.
Close trade when price reached the Lower Band.
🧪 Important: the most common approach to close trades is the Middle Band touch, this is classic mean reversion. We experimented multiple times with different approached and revealed that usually it's better to take profit at the Upper/Lower band for long/short trades and use Middle Band only for setting stop-loss at breakeven. This approach provides better risk to reward ratio.
📈Long Trading Strategy Example
1. Price candle shall be closed above 200-period EMA. In our example we have BITMART:BTCUSDT.P 4h time frame.
2. Open long trade the Lower Band.
3. Put Initial stop-loss 2% below the entry price.
4. When price reached Middle band place stop-loss at the breakeven.
5. Close long trade at the Upper Band.
📉Short trading strategy example
1. Price candle shall be closed below 200-period EMA. In our example we have BITMART:BTCUSDT.P 4h time frame.
2. Open short trade the Upper Band.
3. Put Initial stop-loss 2% above the entry price.
4. When price reached Middle band place stop-loss at the breakeven.
5. Close short trade at the Lower Band.
🧪 Important tip: notice that initial stop-loss is needed only to avoid disaster in case of price moves strongly against you. This percentage shall give enough space to avoid its reaching too often. Mean reversion strategy provides fast trades with the small average gain, so you shall maintain the high win rate (perfectly above 70%). You have to choose stop-loss based on particular asset volatility.
⚡️Combined Approach: Mean Reversion + Trend Following
Skyrexio made multiple researches about Bollinger Bands strategies and we found that we can receive better gains in combination of different approaches. Mean reversion gives you great entry with discount but you don't need to exit that early. Use the trading stop and allow to gain profit while market is moving in your direction.
This approach you can find in our advanced strategy Bollinger Bands Enhanced Strategy which we shared in 2024. Click on the link to read about it and understand how you can combine best features of this popular indicator.
📚 Conclusion
Bollinger Bands are more than just a volatility indicator — they provide a flexible framework for understanding price dynamics and market conditions. By visualizing the relationship between price and standard deviation around a moving average, traders can gain valuable insights into whether an asset is consolidating, trending, or preparing for a breakout.
The real strength of Bollinger Bands lies in their versatility. They can adapt to different trading styles — whether you’re a short-term scalper, a swing trader, or a long-term position holder. From identifying squeeze setups to riding strong trends or capturing mean reversion moves, BBs offer a strategic edge when used correctly.
However, Bollinger Bands should never be used in isolation. Like any technical tool, they work best when combined with momentum indicators like RSI or MACD, volume analysis, and price action signals. Context is key: a signal that works well in a ranging market may fail during high momentum trends.
Ultimately, Bollinger Bands help traders make more informed, disciplined decisions by clarifying where price stands relative to recent history. When paired with sound risk management and broader market awareness, they become a powerful ally in navigating market uncertainty.
Bollinger-bands
XAUUSD: Buy when it falls back to the support rangeGold market fundamentals:
Affected by this week's US economic data, according to the CME FedWatch Tool, the market currently has a 55.5% probability of the Federal Reserve cutting interest rates by 50 basis points in September, down from the previous 70%.
The increase in geopolitical risks in the Middle East has led to an increase in safe-haven demand (it is not convenient to explain in detail here, you can learn about the latest Middle East conflicts on your own)
Gold market technical aspects:
Yesterday I said that once the dense resistance range of 2411-2422 is broken, the potential for growth will increase. Now that the gold price has come above the resistance range, the dense resistance area has also turned into a dense support area. At the same time, this rebound has now formed an upward trend. If it can break through 2430-2440, then the gold price is likely to test the historical high again.
Trading strategy:
In the figure, 2416 is the previous high and the support of the lower track of the Bollinger Band. 2422 is the support of the middle track of the Bollinger Band and the Fibonacci retracement of 0.618. Therefore, I will buy if it falls back to the support range of 2416-2422 today, and I am bullish on 2430-2440.
Support range: 2410-2400
Resistance range: 2430-2440
Daily risk data: Canada's July employment (little impact)

AVAX Kimbo Meme coin could of bottom out from hereLooking at the charts and volumes it done it's 3rd leg wave down in volumes (OBV chart at the bottom) and $0.0003992 US price could of been the next bottom for these waves. If so, Kimbo poised to be big for AVAX meme coin
The OBV volumes showing less selling presure now and good chance in the days ahead great buying pressure
Some of the fundamentals:
Avalanche Foundation Snaps Up KIMBO, COQ, and Three Other Tokens as First Meme Coin Investment
www.coindesk.com
I when to dexscreener to evaluate what moving fast for meme coins - dexscreener.com - Clicked on LIQUIDTY and when sort by descending order, Kimbo is number 2 spot. The number 1 spot doesn't have much value but Kimbo has long term potential for big gains
Their website is IMPRESSIVE!! So much community work on this meme coin A++ www.kimboavax.com
This the big one - they actually "burning" the "token supply" so Kimbo becomes more scarce. What think going to happen with the prices when reduce the token supply? Prices go up and up and faster!
If scroll down the bottom of the page for Kimbo website you see "Kimbo Merchandise" - These meme coins have VALUE! and can buy NFTs for it too
Fundamentals is good, AVAX team buying into this meme coin for exchange liquidity. Most likly be listed on KuCoin and then Binance. This has pretty good volumes too and I like the charts for this great opportunity
On twitter they going to expose this project to the masses on Facebook, Instragram i believe very soon. It has 18,000 twitter followers and can go pass the 50 to 100,000 followers
twitter.com
This poised to be the next Shib Inu, Dodge meme coin where billon and billon of dollars flood through this project
Do you like Kimbo, do you think it has so much potential?

EGLDUSDT LONGTHIS IS NOT A FINANCIAL ADVICE
Conditions:
1.Fibonacci level:✅
2.Bollinger band:✅
3.Momentum:✅
4.Price action:✅
5.Volume:✅
6.1h tf:✅
7.4h tf:✅
8.1d tf:✅

APEUSDT SHORT This is not a financial advice
Conditions:
1. Fibonacci levels:✅
2. Bollinger bands:✅
3.Momentum:✅
4.Price action:✅
5.Volume:✅
6.1hr tf:✅
7.4hr tf:✅
8.1d tf:✅
