EURCAD TRADING RANGEA doji candlestick was formed at a support level during yesterday's trading session, this also was formed at the lower band of the bollinger band, price should move up to the upper band at the end of tomorrow's trading session or today if there's a great bullish momentum. already in profit . TELL ME WHAT YOU THINK THO IN THE COMMENT SECTION.
Bollinger Bands (BB)


McMillan Volatility Band Buy Signal SETUP in LINKBTCMVB buy signal setup, but not yet confirmed entry , on LINKBTC. We'll enter long LINKBTC on a move above ~0.00045.

$EURUSD 4h Double Bollinger BandPrice exited the Stdev 1 Line. Target will be Stdev 1 on the Opposite side = Lower Stdev 1 Band
I´m Trading Longterm 1h 4h Trade and wait for the 4H Candle Close after the London Opens.
PM for more insights

$AUDCAD Double Bollinger Band BearishPrice entered the Downtrend Zone
I´m Trading Longterm 1h 4h Trade and wait for the 4H Candle Close after the London Opens.
PM for more insights

DAX-30 AnalysisHello again.
This time I wanted to share how I think DAX will evolve.
__________________________________________________________________________________________________________________________
I would appreciate a follow, reputation and a comment on what I can do better. Thank you very much.
- Bertram

NASDAQ showing rejection at the upper Bollinger BandNASDAQ showing rejection at the upper Bollinger Band


NOW is the time to be trading!So many reversals & continuation pullbacks are setting up. It will be possible to pay bills off one large trade a week! It wont get any easier than this...


Bitcoin facing the abyss - need a daily close above....OMGNOT ADVICE DYOR. Caveat - small sample size.
Here's the construction. You need BB %B indicator. Then do MACD on that indicator. Mark all instances signal line turns positive (yellow). Mark (white) first instance histogram turns red. If both these cross month end then mark that month end (blue). Box both months in white. Bulls need to push daily close above $7933.4. Come on! If not will first lines of defence hold. NOT ADVICE. DYOR.

ETH QUICK FLIP .. FOLLOW THE TREND LINES!174$- Critical Support holding
185-187$- Sell at resistance
RSI Oversold, ETH 2.0 coming soon, BTC at critical support and may bounce and ETH will follow ;$)

GCB - How Far It Can Go From Now?GCB
Trend: Bullish
Rst: 2.65/ 2.77
Spp: 2.47
Strong hammer candle today pushing from support level indicates more upside for the stock to unfold alongside with upper Bollinger Band. Find your support & resistance level in the chart.

NOTION - What's Next After Drastic Surge?NOTION
Trend: Bullish
Rst: 1.00/ 1.06
Spp: 0.96/ 0.93
Broke above resistance at 0.96, momentum shows no sign of slowing down. Widening BB will continue to drive the stock further. Maintain my view, trading opportunity valid, you can consider to grab if there's any chance retrace to 50% of today bull candle - around 0.935

Gold Sell IdeaD1 - Price is below the middle of the bearish channel, we have an important support zone formed by the bottom of the bearish channel and a strong supportive area. Price still has room lower towards this zone.
H4 - 20 candles ride in Bollinger Band, bullish divergence.
We may now look for possible corrections to happen and then we may look for sell opportunities with bearish evidences.

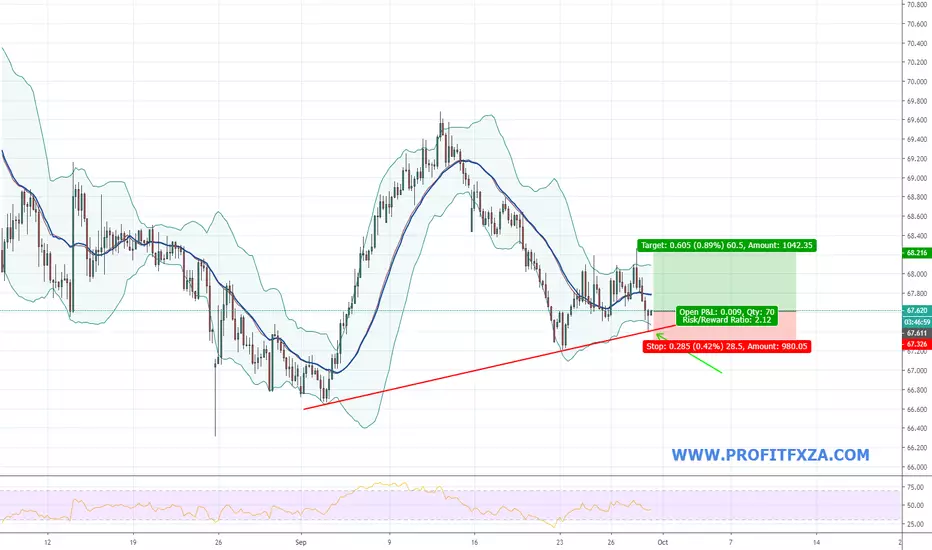
Pin bar on rising support1. The two support levels meet in the same area as a buyers zone
2. Pin bar formed
3. Bollinger band pinned by pin bar on the support
4. Ultra low risk at 60 pips
This type of play entails that stops are placed where the trade is deemed invalidated (below the pin bar) and targets should be the next resistance level but at least 2x that of the risk.
Don't invest what you can't afford to lose. This is not investment advice. Subjective view/report of a financial product only.
You can learn price action trading at no cost. Join my mailing list to receive more information zc.vg
Join me in Forex Bootcamp for live updates using the link below.
DISCLAIMER
All information published within this website is purely for educational purposes and offers no guarantees. Profit Fx, Forex Bootcamp and any of its associates cannot be held responsible for any trades that you have executed in any way whatsoever. Please familiarize yourself with the relevant risks involved when trading forex, CFD’s and other products. Any trading is done solely at your own risk. Profit Fx, Forex Bootcamp and any of its associates are in no way employed by any broker or any other legal entity. All information published within this website does not constitute advice, but rather objective information about a financial product and analysis or report of a financial product.
Confluencing factors1. The two support levels meet in the same area as a buyers zone
2. Pin bar formed
3. Bollinger band pinned by pin bar on the support
4. Ultra low risk at 25 pips
This type of play entails that stops are placed where the trade is deemed invalidated (below the pin bar) and targets should be the next resistance level but at least 2x that of the risk.
Don't invest what you can't afford to lose. This is not investment advice. Subjective view/report of a financial product only.
You can learn price action trading at no cost. Join my mailing list to receive more information zc.vg
Join me in Forex Bootcamp for live updates using the link below.
DISCLAIMER
All information published within this website is purely for educational purposes and offers no guarantees. Profit Fx, Forex Bootcamp and any of its associates cannot be held responsible for any trades that you have executed in any way whatsoever. Please familiarize yourself with the relevant risks involved when trading forex, CFD’s and other products. Any trading is done solely at your own risk. Profit Fx, Forex Bootcamp and any of its associates are in no way employed by any broker or any other legal entity. All information published within this website does not constitute advice, but rather objective information about a financial product and analysis or report of a financial product.

The Magic Poop Guy may have been right about 2k BitcoinDo you guys remember that prediction The Magic Poop Guy made back in the first part about this year about Bitcoin Bottoming out at 2k? He might have been right.
What you're looking at here is bollinger-bands in multiple time-frames. I set it up originally for 1H so I could gauge 1H,4H,1D,1W all at the same time. Out of curiosity, I put this setup into the 4H instead of 1H, thinking I would get some nonsense, but actually found something fairly useful.
The best I can describe this as is a giant sideways market and as you can see, the highs of this summer pretty much stopped at the top of this sideways market and we're now headed to the bottom, which as you can see is around 2k. I don't know how quickly we'll get there, but the bottom of the band itself is not moving very quickly, so it'll be around the same when we get there.
Unfortunately for the alts, this may mean the end for a few of them. If this scenario plays out like I'm seeing it, EOS may be done for instance. ETC is finished. LTC survives at 7 dollars, XRP survives at about 0.13. There is no 120 dollar XRP though.
I'd love to know your opinion on this, though. Standing by.

above 21 EMA and aiming for $11.2 to $11.4K in the next 24hrsOver 21 EMA after bouncing of 128DMA. Going for $11k but really need $11.4k followed by a higher high above $12.3 to flip the trend. Notice there's little sell pressure (VPVR) above $12.3k but surely some profit takers will show up in the $12.3k to $12.5k range as many are still trapped in from higher entries.

Bollinger confirms with price actionHow do you know if a reversal is likely to take place on support?
1. The bottom bollinger is pinned on a support level
2. Price action buy signal
This setup is a bit more complex because of the resistive trend line drawn, once that breaks its adios!
Don't invest what you can't afford to lose. This is not investment advice. Subjective view/report of a financial product only.
You can learn price action trading at no cost. Join my mailing list to receive more information zc.vg
Join me in Forex Bootcamp for live updates using the link below.
DISCLAIMER
All information published within this website is purely for educational purposes and offers no guarantees. Profit Fx, Forex Bootcamp and any of its associates cannot be held responsible for any trades that you have executed in any way whatsoever. Please familiarize yourself with the relevant risks involved when trading forex, CFD’s and other products. Any trading is done solely at your own risk. Profit Fx, Forex Bootcamp and any of its associates are in no way employed by any broker or any other legal entity. All information published within this website does not constitute advice, but rather objective information about a financial product and analysis or report of a financial product.

Looking at the MACD, 4EMA and bollinger bands shows BTCUSD LongFor the upcoming week (several days), I would say there will be a price increase for BTC/USD symbol, by just looking at:
RSI (not in current graph (sorry I don't have a pro account)
MACD for sure! See the cross coming up on the 1D chart
4EMA is getting ready as well
The price is less volatile and low in the bollinger bands
Currently I bought BTCUSD futures at Bybit with 3x leverage for long in the coming days. See the dotted green lines for both stop-loss and take profit limits.
Future plan: looking at the super trend later on..

Other important indicators!
RSI (Relatieve Strenght Index) indicator
Bollinger band (C)
Next to the: 4EMA indicator (4 moving average Exponential)
See also my first publish with MACD indicator (see my profile!).

XRP, the bigger pictureAs we can see here VERY CLEARLY, our price action is at the very end of this descending triangle. Historically, a descending triangle this accurate will result in an upward price movement. Additionally, on the 4h chart we are hitting the bottom of the bollinger band and the price has already bounced off with an ENGULFING GREEN CANDLE. These are three strong signs of an upward push on price action ALL HAPPENING AT ONCE.
To those of you wondering where to take profits after this play, pay close attention to FIB LVL .236 (we will see resistance here)
Ill be posting more analysis on XRPs price movement as this bounce plays out.
Good luck trading everyone,
Dean Gonzalez
