Deep Dive Into Bollinger Bands 🗓This article explores the Bollinger Bands indicator—a powerful volatility tool used by traders worldwide. You'll learn how it works, how to calculate it, and how to use it to detect potential breakouts, trend reversals, and overbought or oversold conditions in the market.
📚 Introduction to Bollinger Bands
In the fast-paced world of trading, understanding market volatility is key to making informed decisions. Bollinger Bands, developed by John Bollinger in the 1980s, offer a visual and statistical method to measure this volatility. Unlike simple moving averages, which only tell you the trend, Bollinger Bands expand and contract based on recent price action, helping traders spot overbought, oversold, or consolidation phases.
These bands dynamically adjust to market conditions, making them one of the most popular indicators for trend-following, mean-reversion, and breakout strategies. Whether you’re trading crypto, stocks, or forex, Bollinger Bands can help you identify high-probability setups by combining trend direction with volatility.
📚 How Bollinger Bands Are Calculated
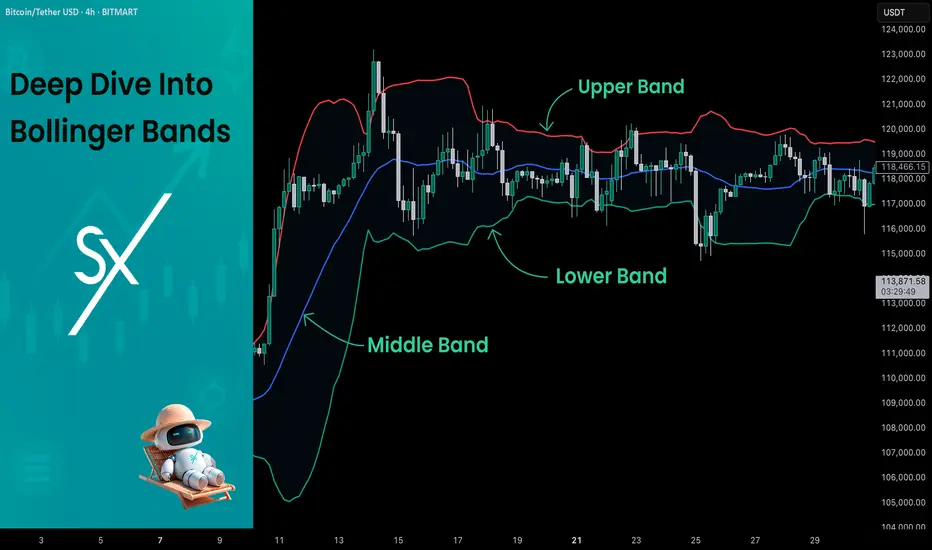
Bollinger Bands consist of three lines:
Middle Band – This is a simple moving average (SMA) of the price, typically over 20 periods.
Upper Band – The middle band plus two standard deviations.
Lower Band – The middle band minus two standard deviations.
Middle Band = SMA(n)
Upper Band = SMA(n) + (k × σₙ)
Lower Band = SMA(n) - (k × σₙ)
Where σₙ is the standard deviation of the price for n periods and k is the multiplier, typically set to 2, which captures ~95% of price action under normal distribution. The middle band shows the average price over the last 20 candles. The upper and lower bands adjust based on how volatile the price has been — expanding in high volatility and contracting in low volatility.
🤖 For those traders who want to implement Bollinger Bands into algorithmic strategy we provide formula it's calculation in Pine Script:
basis = ta.sma(src, length) // Middle Band (SMA)
dev = mult * ta.stdev(src, length) // Standard Deviation × Multiplier
upper = basis + dev // Upper Band
lower = basis - dev // Lower Band
📚 How to Use MACD in Trading Strategies
⚡️Bollinger Band Squeeze (Volatility Contraction and Expansion)
The idea is pretty simple, а squeeze indicates low volatility and often precedes a breakout. The squeeze is the situation when the Upper Band and Lower Band contract, and BB width is at a local minimum. In this case you shall be prepared for the high volatility after the period of low volatility. This strategy doesn’t predict direction — it prepares you for volatility.
Long setup:
Price is in long-term uptrend, you can use 200 EMA as a major trend approximation - price shall be above it.
Bollinger Bands is narrow in comparison to the previous period. Price usually is in sideways.
Open long trade when candle shows a breakout and closes above the Upper Band.
Set a trailing stop-loss at the Middle Band.
Short setup:
Price is in long-term downtrend, you can use 200 EMA as a major trend approximation - price shall be below it.
Bollinger Bands is narrow in comparison to the previous period. Price usually is in sideways.
Open short trade when candle shows a breakdown and closes below the Lower Band.
Set a trailing stop-loss at the Middle Band
📈Long Trading Strategy Example
1. Price candle shall be closed above 200-period EMA. In our example we have BITMART:BTCUSDT.P 4h time frame.
2. Bollinger Bands shall be narrow in comparison with the previous periods.
3. Open long trade when candle closes above the Upper Band.
4. Close trade when price touched the Middle Band.
📉Short trading strategy example
1. Price candle shall be closed below 200-period EMA. In our example we have BITMART:BTCUSDT.P 4h time frame.
2. Bollinger Bands shall be narrow in comparison with the previous periods.
3. Open short trade when candle closes below the Lower Band.
4. Close trade when price touched the Middle Band.
⚡️Mean Reversion (Rebound from the Bands)
This is the most common approach to use Bollinger Bands. The idea is also very simple, we just want to open long if price touches Lower Band and short if price reaches Upper Band. Price tends to revert to the mean (Middle Band), especially in range-bound markets. It's very important to trade in the direction of the major trend to reduce the probability of the large move against you.
Long setup:
Price is in long-term uptrend, you can use 200 EMA as a major trend approximation - price shall be above it.
Open long trade when price touches the Lower Band.
Set the initial stop-loss at the fixed percentage below entry price. Choose this percentage number with your personal risk/money management, you shall be comfortable to lose this amount of money in case of stop-loss hit.
If price reached Middle Band set stop-loss at breakeven.
Close trade when price reached the Upper Band.
Short setup:
Price is in long-term downtrend, you can use 200 EMA as a major trend approximation - price shall be below it.
Open short trade when price touches the Upper Band.
Set the initial stop-loss at the fixed percentage above entry price. Choose this percentage number with your personal risk/money management, you shall be comfortable to lose this amount of money in case of stop-loss hit.
If price reached Middle Band set stop-loss at breakeven.
Close trade when price reached the Lower Band.
🧪 Important: the most common approach to close trades is the Middle Band touch, this is classic mean reversion. We experimented multiple times with different approached and revealed that usually it's better to take profit at the Upper/Lower band for long/short trades and use Middle Band only for setting stop-loss at breakeven. This approach provides better risk to reward ratio.
📈Long Trading Strategy Example
1. Price candle shall be closed above 200-period EMA. In our example we have BITMART:BTCUSDT.P 4h time frame.
2. Open long trade the Lower Band.
3. Put Initial stop-loss 2% below the entry price.
4. When price reached Middle band place stop-loss at the breakeven.
5. Close long trade at the Upper Band.
📉Short trading strategy example
1. Price candle shall be closed below 200-period EMA. In our example we have BITMART:BTCUSDT.P 4h time frame.
2. Open short trade the Upper Band.
3. Put Initial stop-loss 2% above the entry price.
4. When price reached Middle band place stop-loss at the breakeven.
5. Close short trade at the Lower Band.
🧪 Important tip: notice that initial stop-loss is needed only to avoid disaster in case of price moves strongly against you. This percentage shall give enough space to avoid its reaching too often. Mean reversion strategy provides fast trades with the small average gain, so you shall maintain the high win rate (perfectly above 70%). You have to choose stop-loss based on particular asset volatility.
⚡️Combined Approach: Mean Reversion + Trend Following
Skyrexio made multiple researches about Bollinger Bands strategies and we found that we can receive better gains in combination of different approaches. Mean reversion gives you great entry with discount but you don't need to exit that early. Use the trading stop and allow to gain profit while market is moving in your direction.
This approach you can find in our advanced strategy Bollinger Bands Enhanced Strategy which we shared in 2024. Click on the link to read about it and understand how you can combine best features of this popular indicator.
📚 Conclusion
Bollinger Bands are more than just a volatility indicator — they provide a flexible framework for understanding price dynamics and market conditions. By visualizing the relationship between price and standard deviation around a moving average, traders can gain valuable insights into whether an asset is consolidating, trending, or preparing for a breakout.
The real strength of Bollinger Bands lies in their versatility. They can adapt to different trading styles — whether you’re a short-term scalper, a swing trader, or a long-term position holder. From identifying squeeze setups to riding strong trends or capturing mean reversion moves, BBs offer a strategic edge when used correctly.
However, Bollinger Bands should never be used in isolation. Like any technical tool, they work best when combined with momentum indicators like RSI or MACD, volume analysis, and price action signals. Context is key: a signal that works well in a ranging market may fail during high momentum trends.
Ultimately, Bollinger Bands help traders make more informed, disciplined decisions by clarifying where price stands relative to recent history. When paired with sound risk management and broader market awareness, they become a powerful ally in navigating market uncertainty.
Bollingerbandsqueeze
Dollar-Yen Compression Coil: A Breakout is Brewing🧠 Why This Matters Right Now
USD/JPY has been tightly range-bound for the past 7 sessions, hugging the underside of 154.50, a historically significant resistance level. With U.S. inflation coming in hotter than expected and the Bank of Japan stepping back from policy tightening, this tug-of-war has compressed price action into a tight coil. A volatility eruption is right around the corner.
🔍 Breakdown of the Strategy
This is a volatility compression breakout setup based on the logic that low volatility precedes expansion. The ingredients:
Bollinger Bands (20, 2) for detecting squeeze zones
ADX (14) under 15 to confirm low trend strength
Price range compressing within 0.5%
Entry Logic:
📈 Long: Close above upper Bollinger Band + ADX > 20
📉 Short: Close below lower Bollinger Band + ADX > 20
Stops & Targets:
Stop Loss: Just inside the opposite Bollinger Band
Take Profit: 2× ATR(14)
🚀 Why This Works in Today’s Market
The policy divergence between the U.S. and Japan is creating a classic fundamental standoff, but the price can't stay neutral for long. Volatility is compressed to its limits. When the breakout comes, it's likely to run fast and clean in the direction of the imbalance.
🤖 Automate It with PineScriptAI
With PineScriptAI, you can instantly:
Detect when Bollinger Band width narrows
Monitor ADX thresholds
Set up conditional breakout logic with smart alerts and backtests
Create a dual-trigger script that catches either direction — no need to guess the breakout side.
⚡ From Trend to Code — Instantly
This isn’t just a chart pattern — it’s a recurring market phenomenon. With PineScriptAI, you can adapt this same logic to GBP/JPY, EUR/JPY, or even gold compressions with zero manual tweaking.
🧭 Final Insight FX:USDJPY
When price coils, energy builds. Don’t just watch it break — code it, trade it, and scale it across markets with PineScriptAI.

Bollinger Bands: Basics and Breakout Strategy🔵 What are Bollinger Bands?
Bollinger Bands are a popular technical analysis tool developed by John Bollinger in the early 1980s. They help traders analyze price volatility and potential price levels for buying or selling. The indicator consists of three lines plotted over a price chart:
Middle Band: A simple moving average (SMA), typically set to a 20-period average.
Upper Band: The middle band plus two standard deviations.
Lower Band: The middle band minus two standard deviations.
🔵 How Are Bollinger Bands Calculated?
Middle Band (MB): MB = 20-period SMA of the closing price.
Upper Band (UB): UB = MB + (2 × standard deviation of the last 20 periods).
Lower Band (LB): LB = MB - (2 × standard deviation of the last 20 periods).
The bands expand when volatility increases and contract when volatility decreases.
length = 20
basis = ta.sma(src, length)
dev = mult * ta.stdev(src, length)
upper = basis + dev
lower = basis - dev
🔵 How to Use Bollinger Bands in Trading
Bollinger Bands provide insights into market volatility and potential price reversals. Traders often use them to:
Identify overbought (price near the upper band) and oversold (price near the lower band) conditions.
Spot volatility contractions, which often precede significant price moves.
Confirm trend strength and potential reversals.
🔵 Bollinger Bands Breakout Strategy
One effective strategy involves preparing for breakouts when the upper and lower bands contract, indicating low price momentum.
Strategy Steps:
Identify Low Volatility Zones: Look for periods when the bands are close together, signaling a potential breakout.
Prepare for a Breakout: Monitor price action as it approaches either the upper or lower band.
Entry Signal: Enter a trade when the price closes above the upper band (for a long position) or below the lower band (for a short position).
Stop Loss Placement:
For long entries (break above upper band): Set stop loss at the lower band.
For short entries (break below lower band): Set stop loss at the upper band.
Profit Target: Use a risk-reward ratio of at least 1:2 or close the position when price shows signs of reversal.
Example Charts:
🔵 Final Thoughts
This Bollinger Bands breakout strategy is simple yet effective. By recognizing periods of low volatility and preparing for breakouts, traders can capitalize on significant price movements. Always complement this strategy with proper risk management and confirmation indicators for optimal results.
This article is for informational purposes only and should not be considered financial advice. Trading involves risk, and traders are solely responsible for their own decisions and actions.

Big Move Coming - Bitcoin’s Bollinger Bands Are Tight AFBitcoin's daily Bollinger Bands are at one of their tightest levels in history, a pattern that has almost always preceded bullish price action.
Historically, when volatility has compressed to this degree, Bitcoin has followed with strong upward movement.
There have only been TWO times in Bitcoins history that the price dropped at these compression levels:
November 2018: A sharp drop that took ~6 months to recover.
August 2023: A decline with a ~2-month recovery.
Every other time, a this level of tightness is followed by bullish price action. Given it's history, the odds favour a move higher.
What’s your take — up or down? Will history repeat? Or will this be another rare exception?

BOIL- Premarket Long Trade Scalp RecapsBOIL is here on the 15- minute chart with a set of Bollinger Bands, a Bollinger Band Oscillator by
LuxAlgo as well as a dual-time frame RSI indicator by Chris Moody. The settings for the Bollinger
Band set up are period 49 EMA 14 standard deviations 2 /2.618 ( These are multiples of 7 and
Fib #s for mathematical reasons.
Entries are signal is price crossing the base line of the Bollinger Bands ( the EMA 14) or else
the RSI lines crossing over the 50 level and green above red.
Exits are the price action going outside the outer upper BB band and then fading back inside
of both inner and outer bands or RSI green and red crossing such that green fades quicker than
red. Entries and exits are managed with alerts/notifications to minimize screen time.
The first trade began on 2/27 at 8:10 AM ended 2hours later. 50 shares taken gained $ 1.50 each
for a total of $75.00 realized profit in the long scalp. The second trade on 2/28 was
taken in the premarket at 6:45 AM EST with again 50 shares taken then closed at 9:15 AM
for a 150 minute trade. Realized profit was $1.20 per share and $60 overall.
Overall, there were 4.5 hours in the trades yielding $135.00 or $30 hr for the time in the trade.
Risk was minimal as trades were taken at the lows with a stop loss outside the BB and below
them. Time spent on the screen amounted to less than 30 minutes overall making the
realized profit excellent for the time and effort expended. This idea illustrates good use
of a Bollinger Band strategy coupled with alerts and notifications. Notably, I did not spend
any effor adjusting the stop losses during the trade as I am very confident of the setup and
the strategy. Today is another day for the same trade.

BITCOIN | BBW SQUEEZE ALERTThis chart shows the Bitcoin price on a monthly timeframe alongside 2 indicators: Relative Strength Index & Bollinger Bands Squeeze .
-----
Bollinger Bands Squeeze :
For those unfamiliar, the Bollinger Bands Squeeze indicator is simply the standard Bollinger Bands Width (BBW) indicator with the added capability of detecting the "Bollinger Bands Squeeze" as defined by John Bollinger:
The BBW squeeze happens when BBW < all BBWs of the past 125 intervals.
Whenever a BBW squeeze occurs, this means there is low volatility.
A low volatility period is almost always followed by high volatility: a large breakout (with price performing ample movement and exiting the BBW bands) may suddenly occur.
The breakout may be preceded by a fakeout, during which price moves in the opposite direction.
-----
As you can see on the monthly chart, we're currently in a squeeze for the first time since October 2020, when we saw the price breakout and climb by approximately 532% in the 6 months immediately following the squeeze. If history is any indication, it might be time to buckle up!

Bollinger Bands: Investment Guide 📊🚀📉 The Basics: Bollinger Bands consist of three lines – the middle line is the simple moving average (SMA), while the upper and lower bands are set at a certain standard deviation from the SMA. They act as dynamic support and resistance levels.
🌟 Long-Term Perspective: Bollinger Bands are highly versatile and well-suited for long-term investors. They provide valuable insights into Bitcoin's price volatility over time.
💡 The Buy Signal: One effective strategy for long-term investors is to consider buying Bitcoin when it retests the lower Bollinger Band. This can indicate that the asset is undervalued, and it may be a good entry point for a long-term position.
🔍 Risk Management: While Bollinger Bands are powerful tools, always complement them with risk management strategies. Diversify your portfolio, set stop-loss orders, and conduct thorough research.
🔮 The Future of Bitcoin: Bollinger Bands are just one tool in your investment toolkit. They can help you make informed decisions in the dynamic world of cryptocurrencies, but remember that no signal is foolproof.
In conclusion, Bollinger Bands offer a valuable perspective for long-term Bitcoin investors. Using them to identify buy signals during lower boundary retests can be a smart strategy. Combine this with proper risk management for a well-rounded approach to investing.
Stay analytical, stay patient, and remember – in the world of crypto, a long-term vision can be your greatest asset! 🌐💰
❗See related ideas below❗
Follow + Like this post and share your insights in the comments; your engagement fuels the creation of valuable content! 💚💚💚

📉🌊 Potential Falling Wedge Pattern Formation on $WAVES ChartBINANCE:WAVESUSDT $FallingWedge $PatternFormation $TradingView
Greetings, fellow traders! 👋 I'd like to share an intriguing chart pattern I've identified on the BINANCE:WAVESUSDT chart. It appears that a potential falling wedge pattern is forming, suggesting a possible bullish reversal in the near future. Let's delve into the details!
1️⃣ Falling Wedge Formation: The BINANCE:WAVESUSDT chart displays a sequence of lower highs and lower lows, converging within two trend lines. This pattern closely resembles a falling wedge, characterized by a contracting range. Falling wedges often signify a bullish reversal.
2️⃣ Volume Analysis: Volume analysis is crucial for pattern confirmation. Ideally, we would expect to see diminishing volume as the wedge develops, followed by a surge in volume upon breakout. This could indicate increased buying interest that may potentially propel the price higher.
3️⃣ Resistance and Support Levels: It is essential to monitor the upper resistance trend line and lower support trend line. A breakout above the resistance line, accompanied by notable volume, might suggest a bullish breakout. Conversely, a breakdown below the support line could invalidate the pattern.
4️⃣ Price Target and Stop Loss: Should the falling wedge pattern confirm, a common technique to estimate the potential target is to measure the widest part of the wedge and project it from the breakout point. Regarding stop loss placement, it is often advisable to position it below the support line to mitigate potential losses.
Nevertheless, it is important to remember that technical patterns should be used in conjunction with other forms of analysis, such as fundamental research and market sentiment, to make well-informed trading decisions.
To summarize, the BINANCE:WAVESUSDT chart is currently exhibiting a potential falling wedge pattern, indicating a possible bullish reversal on the horizon. Nonetheless, confirmation through a breakout above the upper resistance trend line and a surge in volume is essential. Traders are advised to exercise caution and implement appropriate risk management strategies.
What are your thoughts on this pattern? Share your insights below! Remember to conduct your own analysis and consult with financial professionals before making any investment decisions.
#WAVES #FallingWedge #PatternFormation #BullishReversal #TradingAnalysis #TechnicalAnalysis #Cryptocurrency #TradingView

Top of Bolly Band; Gap to Fill then ThrowoverChart has it all. Notice every prior local top is a point, no plateaus, after squeezing the upper Bolly band, they rollover.
August gap is a magnet. Once filled, much higher seems improbable. Fewer issues advance the price, moves up on lower volume, weaker RSI.
Lot of participants been waiting to sell at this price. The dump after this rally dies could be hellacious... June Swoon.

USDJPY in a Downward ChannelUSDJPY has been trading in an upward channel for the past month, which suggests a bullish trend in the pair. However, over the past week, the price has consolidated into a downward channel, indicating a possible reversal or correction in the trend.
It is important to note that a downward channel is a continuation pattern, which means that it is likely to continue in the direction of the previous trend. In this case, as the previous trend was upward, it is possible that the price may break out of the downward channel in the upward direction.
Traders should keep a close eye on the price action to identify the breakout direction and time. A break above the upper channel line would confirm the bullish continuation pattern, and traders could look for long opportunities. On the other hand, a break below the lower channel line would signal a bearish reversal, and traders could look for short opportunities.
It is important to exercise caution and wait for confirmation before taking any positions, as false breakouts can occur. Additionally, traders should use appropriate risk management strategies to limit their exposure to potential losses.
In summary, while USDJPY has been in an upward channel for the past month, it has consolidated into a downward channel over the past week. The continuation pattern suggests a potential upward breakout, but traders should wait for confirmation and use appropriate risk management strategies.

📊Bollinger Bands In A Trending MarketBollinger Bands are a widely used chart indicator for technical analysis created by John Bollinger in the 1980s. They offer insights into price and volatility and are used in many markets, including stocks, futures, and currencies. Bollinger Bands have multiple uses, such as determining overbought and oversold levels, as a trend following tool, and for monitoring for breakouts.
📍 Strategy
Bollinger Bands measure deviation and can be helpful in diagnosing trends. By generating two sets of bands using different standard deviation parameters, traders can gauge trends and define buy and sell zones. The bands adapt dynamically to price action, widening and narrowing with volatility to create an accurate trending envelope. A touch of the upper or lower band is not a signal in and of itself, and attempting to "sell the top" or "buy the bottom" can lead to losses. Standard deviation is a statistical measure of the amount of variation or dispersion of a set of prices or returns from its average value. The higher the standard deviation, the wider the Bollinger Bands, indicating greater price volatility, and vice versa. Traders may use standard deviation to set stop-loss and take-profit levels or to help determine the risk-to-reward ratio of a trade.
📍 Calculation
First, calculate a simple moving average. Next, calculate the standard deviation over the same number of periods as the simple moving average. For the upper band, add the standard deviation to the moving average. For the lower band, subtract the standard deviation from the moving average.
Typical values used:
Short term: 10 day moving average, bands at 1.5 standard deviations. (1.5 times the standard dev. +/- the SMA)
Medium term: 20 day moving average, bands at 2 standard deviations.
Long term: 50 day moving average, bands at 2.5 standard deviations.
👤 @AlgoBuddy
📅 Daily Ideas about market update, psychology & indicators
❤️ If you appreciate our work, please like, comment and follow ❤️


The Bollinger Bands are Squeezing the Juice out of GrainsSoybean short swing trade:
The Bollinger Bands width has narrowed to 2.56% of price which is a level not seen in over a year. A new 6-month or greater low in bandwidth indicates that a volatility squeeze breakout is likely upon us. Similar volatility squeeze situations exist in wheat and corn but they both broke to the downside significantly last week. Wheat was -6.42% on the week, corn -4.21%, and soybeans lagged at -0.20%.
Soybean price reached the lower parabolic SAR which is a signal to short the volatility squeeze. The stop loss is positioned at the upper SAR for this trade. A stop above the 20-day SMA would be more conservative.
The overarching price pattern is a rising wedge with what appears to be a fake breakdown in late January. If we hold below the 20-day SMA it will roll over in 3 days.
Wheat shows a similar setup already occurred a couple weeks ago but it was a head fake to the upside. There is risk in wheat being at the recent low pivot for the 3rd time. It could moon from here like gold did after making a triple bottom. Note the gigantic head and shoulders.
Wheat:
Gold:
Note the lack of a Bollinger Band squeeze at the pre-moon triple bottom:
Corn also shows a similar setup, but there was no head fake, it just broke down out of the band squeeze.
Corn:
Soybean Crush spread:
It appears positioned for a big move in either direction. Seems likely to bounce back up in concert with a soybean drop. It’s in volatility squeeze territory as well.
Oil:
The mother of all commodities has an inverse head and shoulders continuation pattern suggesting more downside:
tldr; short soybeans

visa and bollinger band Bollinger band suggest the counter is ready to make a breakout
multiple times respected bollinger band earlier as shown in the chart.
the counter in past have seen support from mid or lower band
while resistance at the upper band along with retracements at mid band when in uptrend.
which sugest the counter is a good candidate to play via BB

BTC : 2hr Bollinger Band Width lowest since October 2018Bitstamp BTC 2hr Bollinger Band Width printed a drop to 0.00432 just now... lowest point since October 2018.
Top left chart shows 2hr BTC BBW in October 2018.
Top right chart shows 2hr BTC BBW at present.
Bottom chart shows BTC price action since October 2018 on the 3day.
// Durbtrade

BTC: ~ $ SYSTEMCTL START DEPLOY.CAPITALBTC: ~ $ /PRICE/BOTTOM/STRATEGY.PH
Script started on SATURDAY 18 JUN 2022 08:13:33 PM UTC
DCA="Weekly"
DURATION="Price is sideways"
EXCEPTION="BTFD!"
$$$$$$$$$$$$$$$$$$$$$$$$$$$$$$$$$$$$$$$$$$$$$$$$$$$$$$$$$$$$$$$$$$$$$$$$$$$$$$$$$$$$$
$$$$$$$$$$$$$$$$$$$$$$$
BTC: ~ $ ^C
BTC: ~ $
BTC: ~ $
BTC: ~ $ /ETC/INIT.D/WYCKOFF_ACCUMULATIOND STOP
Continue? (y): Y
DXY.TOP.......................................................................................................
BOLlINGER_BAND.SHRINK..................................................................................
BTC: ~ $
BTC: ~ $ SYSTEMCTL START BTC.PAMP -T 30K+ | ECHO "YELLOW_PATTERN"
~~~~~~~~~~~~~~~~~~~~~~~~~~~~~~~~~~~~~~~~~~~~~~~~~~~~~~~~~~~~~~~~~~~~~~~~~~~~~~~~~~~~
#PS: Do you recognize that YELLOW PATTERN? It is copy of the price action from May-August 2021!
# I have put it there in June when I felt THE BOTTOM MIGHT BE IN = still nearly mimics it so far =)
# Was expecting to see a Lower Low fakeout for the so called "SPRING" to trigger the pump but....
# PURPLE LINE = ATOM -> it has been outperforming BTC and everything last few months! ⚛️🚀

Possible 100% ? AKRO/USDT #AKRO #AKROUSDT Here we see our Akro/usdt 1 day chart . Look at the MACD ! It's pointed up beautifully and does appear like it will cross up through that green area where the green arrow is . If that happens I think this could possibly do a 100% up - probably to 0.010 or 0.011 which would bring you right under the 3 day Ichimoku and the 3 day 99 MA line ( though this is the 1 day chart I'm showing . ) Please keep in mind that the market is EXTREMELY volatile right now . The Fed is having their important FOMC meeting next week - and if it's bad news that's announced it could dump the market . Also the DXY dollar index is still Bullish and that could hurt Crypto markets . Also the market is still in a Bear market in general and can be dumpy out of nowhere. Although that hasn't stopped certain coins from running such as Chz/usdt . Also , another TA guy I like a lot called Payne Residence doesn't like that this chart is so 'wicky' . So it's definitely risky but just looking at the chart alone it does look Bullish with a candle almost closing above that light blue 50MA line and possibly also breaking up from the Bollinger Squeeze ....but be aware of these other market conditions . Thank you.

Volatility Dropping, Bollinger Bands Tighten!Hello Traders,
As you can see on the Weekly Candles of Bitcoin (BTC). There is a VERY strong hint of a breakout mainly due to the fact that the Bollinger Bands are tightening. This can finally mark the move up to 100k!
Safe Trading,
-Pulkanator

Nasdaq futures squeezing into Euro sessionAfter yesterday's selloff in CME_MINI:NQ1! price has slowed into a tight range going into the European trading session. A breakout of this range could be imminent and big. If it breaks the range to the upside price could Retrace to 16238. Breaking the last major lows would be bearish.

Bollinger Bands Explained, All you need to know Hello everyone, as we all know the market action discounts everything :)
_________________________________Make sure to Like and Follow if you like the idea_________________________________
In today’s video we are going to be talking about the Bollinger bands , How are they constricted and how to use to try to identify trades in different financial markets.
Some people think about the Bollinger bonds as a complicated indicator but after you watch this video you will see how easy it is to use.
Lets start with the theory before we see a real life example :
The Bollinger bands were developed by a man called John Bollinger, so no surprised where the name came from.
So the Bollinger breaks down to a Moving average and some volatility bands around that, What we have first is a moving average and on the top and bottom of that moving average we have our bands and they usually are located 2 standard deviations away from the Moving Average.
The idea here is to describe how prices are dispersed around an average value, so basically, these bands are here to show where the price is going and how it's moving for about 95% of the time.
So how do we use this indicator :
1) The first way people use this indicator is when the market price reaches the edges of the Bands, The upper end for example shows that it's possible that the market is overextended and a drop in price will happen, if the price reached the lower end then the market will be oversold and a bounce in price is due.
2) The second way to use this indicator is called Targets, It simply allows us to set up targets for the trade, if we buy near the lower Band then we could set a target above the Moving average or near the higher Band.
Because these bands are based on price volatility they won't stay at the same place from the MA, That means if the volatility drops then the bands will get tighter (Squeeze) , and if the volatility goes up then the bands will go further away from each other (Width).
People use this method to try to understand what's going on with the current trend, so basically if the bands are really far away then it’s a sign that the trend is currently ending, and if they are really close then we could be seeing an explosive move in the trend
IMPORTANT
I always say that you always need to use different indicators when you analyze any chart, this way you will minimize your risk and have a better understanding on how the market is currently doing.
I hope I’ve made the Bollinger Bands easy for you to understand and please ask if you have any questions .
Hit that like if you found this helpful and check out my other video about the Moving Average, Stochastic oscillator, The Dow Jones Theory, How To Trade Breakouts, The RSI and The MACD, links will be bellow

BTC - Possible Continued Sideways MomentumBTC UPDATE:
If we look at the daily chart, we can see that BTC is still above its Bollinger Bands Middle Band Basis.
BTC is consolidating in a Bollinger Bands Squeeze which is indicating sideways ranging.
The RSI is indicating momentum is sideways with a slope downwards at the moment.
BTC is still well within the Bullish Zone of the Ichimoku Cloud indicator on the daily chart.
The Ichimoku Cloud Conversion Line (Tenkan Sen) is indicating that short-term momentum is sideways with the Base Line (Kijun Sen) confirming this by curving upwards while the Conversion Line (Tenkan Sen) is sideways.
The Ichimoku Cloud Lagging Span (Chikou Span) is indicating momentum is sideways with a possibility that the Lagging Span (Chikou Span) may go into the candle from 30 periods ago indicating sideways ranging or uncertainty.
Sideways Trading or Sideways Ranging can vary in duration & possibly last for days or even weeks as we’ve recently seen with ADA & sometimes even lasting months. Sideways Trading or Sideways Ranging is not done at a constant level but within a range of levels, a crucial Level for BTC to close a Daily Candle above on the Daily Chart is the 50EMA.
I hope this is helpful. Good luck 👍

Bollinger Bands - Contraception for your Price ActionSo i thought i’d do another educational post, this time on the Bollinger Bands. I’ll try and keep this as a brief introduction to the basics of Bollinger Bands so you can do your own research to fully understand what the indicator is doing and showing, there is no point putting a fancy indicator on your chart if you have no idea what it is showing you. Bollinger Bands measure, Price & Volatility, potential Support and Resistance, & it can also give you a sense of if an asset is Overbought or Oversold, although its best practice to use another indicator to get confirmation of being Oversold or Overbought because the price can walk the Upper and Lower Bands for extended Periods. The Standard Bollinger Bands is composed of a 20-period Simple Moving Average (SMA) which is its Middle Band, it also has an Upper Band & a Lower Band which envelopes the SMA. The outer bands are a +/- 2 Standard Deviation (StdDev) of the 20-period SMA in whatever timeframe you are in. A Simple Moving Average (SMA) is an unweighted average of the Previous 20-period Values in whatever timeframe you are in, so for the 1min chart, the SMA period will be an unweighted average of the previous 20 mins, for the 1hr chart, the SMA period will be an unweighted average of the previous 20 hours, for the Daily chart, the SMA period will be an unweighted average of the Previous 20 days and so on and so on. You are able to change the SMA to any period you want, some trading sites also allow you to change the SMA into an Exponential Moving Average (EMA). Changing the timeframe from the standard 20-period SMA to a faster SMA like a 10-period, will allow faster entry into possible buy & sell points but could be prone to false signals, because of this, most people keep the SMA at the Default of 20-periods to avoid possible false buy/sell signals. You can change the StdDev settings, but you must know what you are doing as you cannot just add any number for shits and giggles, for example, a 20-period SMA is 2 StdDev, a 10-period SMA is 1.5 StdDev and a 50-period SMA is 2.5 StdDev as default. For those interested, & from my understanding of it, the Population Standard Deviation used in the Bollinger Bands system is a measure of the +/- dispersion/variation of the mean or the sum of a collection of values, the values being the 20 periods, so a +/- deviation value away from its Midpoint Basis in whatever timeframe you are in. I won’t go into the calculations because everyone will stop reading & it’ll also hurt my head because i cannot even count. So the + is the Upper Band and the - is the Lower Band. So looking at the Bollinger Bands, we now know that the Middle Band is the basis & the Upper and Lower Bands are +/- Standard Deviations of that Middle Band Basis in whatever timeframe you are in. With Low Volatility, the closer the Upper and Lower Bands are to its Price & Middle Band Basis. The more volatile the Price action is in either direction, the further away the Price will move from its Middle Band and move closer to its Upper or Lower Bands depending on if it’s Bullish or Bearish. Along with the Price, the Upper and Lower Bands will also expand outwards and move away from its Middle Band. With extreme volatility the Price may even wick out or close a candle out of its Upper or Lower Bands. If there has been a period of Volatility which has come to an end, then you will see the Upper and Lower Bands start to contract inwards. You can use the Middle Band as potential Support and Resistance Levels depending on if the Price is above or below it. You can also use the Upper and Lower Bands as potential Resistance Levels, and also as potential entry levels for longs or shorts respectively. The Lower and Upper bands will point outwards and inwards depending on if the Price is contracting or expanding respectively. With normal volatility, if you use the default 20-period SMA & 2 StdDev settings, then the price action will possibly remain within the bands for roughly about 90% of the time. The Price will eventually move back in to the Upper or Lower Bands if there has been a period that the Price has been outside of the Upper or Lower Bands. What is great about the Bollinger Bands is that you can apply it to any chart and timeframe that has enough previous trading data, and use it to get a feel for the assets volatility over time. A key thing to look out for is the Bollinger Bands Squeeze, this happens when you buy latex contraception that’s too tigh……… sorry…… this happens when volatility has slowed & the Upper and Lower Bands contract, envelope and stay close to the Price & Middle Band so essentially Price action is trading sideways within a channel made up of the Lower and Upper Bands. The Bollinger Bands Squeeze Pattern can potentially end in a big breakout upwards or downwards. Bollinger Bands can also be used to see Bullish W-Bottoms or Bearish M-Top signals in the Price. These signals have 4 steps that need to happen for it to be considered valid but i’ll let you do your own research on that. The Price can also walk along the Upper and Lower Bands for an extended period of time depending on if the Price is Bullish or Bearish. It’s best practice to use complementary indicators like Volume, RSI, ADX, STOCH or MACD to try and get confirmation or any potential breakout. I actually use the Bollinger Bands on my charts in conjunction with the Ichimoku Cloud.
On a side note, having a grasp of the basics of the original Bollinger Bands crated by John Bollinger is the first step to really understanding it and properly using it to enable you to make wise decisions with your money/investments. If you have an understand of the original Bollinger Bands, then that can help you with understanding other price enveloping indicators like what David ‘WycoffMode’ Ward has created. David has created his own genius take on the Bollinger Bands called Bad Ass Bollinger Bands, which is quite fascinating because it shows multiple +/- Standard Deviations for whatever timeframe you are in. You could potentially use these as multiple Support and Resistance Levels for whatever timeframe you are in and also look for any potential cascading effect from lower to higher timeframes using these multiple +/- StdDev levels, he does state however that to get the best out of it, you have to use it with his Phoenix Ascending indictor, which from what I’ve seen, i think it complements his Bad Ass Bollinger Bands by showing Momentum, Upwards and Downwards Pressure & potential Trend Crossover, this agrees with what i have said above, about using other complimentary indicators with your Bollinger Bands like RSI or MACD. From what I have seen of David’s Bad Ass Bollinger Bands, one of the many benefits of having multiple +/- Standard Deviations, 8 in total, 4+ & 4-, is that you end up with a closer to 95-99% of the Price action staying within the Bollinger Bands for more accuracy. 99% because if there is extreme volatility, that may still cause a Candle Wick to poke its head out. This new indicator is potentially a real game changer. This is just my opinion from what i have seen of it, so i could be completely wrong & David could say it doesn’t mean anything that i've typed and he’s gonna hunt me down for typing complete bollox. Below is a pic to show you the differences between the original Bollinger Bands and the Bad Ass Bollinger Bands.
In any case, it’s best practice that when using your charts, you should have a range of indicators to complement each other, an indicator for Momentum, Volatility, Trend, Price, Volume ect. You do not need to add 4 indicators on your chart that show the same thing. If your using RSI then you don’t really need the STOCH, If you’re using MACD then you don’t really need ADX or Parabolic SAR.
If you’re interested in learning more about the Ichimoku Cloud System, please click on the below pic which will take you to an educational post i did about it.
I hope you have found this brief intro helpful & i hope it encourages you to do your own research to find the best trading strategy for you. Cheers 👍

LTC Prime the PumpLitcoin could go up to $54 pretty easy and maybe even $60. The RSI, volume profile and momentum indicators all are looking good. With that said, this is not trading advice.
