PG slow and steady long term winner with earnings coming LONGPG on the weekly chart gained 15% in a year and had a dip in the past two weeks with earnings
at the end of this week. PG persistently and consistently beats earnings estimates and pays a
dividend. Moreover, it consistently has a bit of a surge after earnings. I see this as an
opportunity to get a good stock on a 4% dip of a discount and hold it through earnings for
perhaps a 10% profit in two weeks while also picking up the quarterly dividend. Some traders
including those institutionally based believe that buying near to the middle line of the Bollinger
Bands is a good entry for getting fair value. I am one of them.
Bollingerbandstrategy

Crossover Trade - NMDC📊 Script: NMDC
📊 Sector: Mining & Mineral products
📊 Industry: Mining / Minerals / Metals
Key highlights: 💡⚡
📈 Script is trading near middle band of BB.
📈 Already Crossover in MACD.
📈 Double Moving Averages are giving crossover.
📈 Right now RSI is around 57.
📈 One can go for Swing Trade.
⏱️ C.M.P 📑💰- 224
🟢 Target 🎯🏆 - 243
⚠️ Stoploss ☠️🚫 - 217
⚠️ Important: Always maintain your Risk & Reward Ratio.
✅Like and follow to never miss a new idea!✅
Disclaimer: I am not SEBI Registered Advisor. My posts are purely for training and educational purposes.
Eat🍜 Sleep😴 TradingView📈 Repeat 🔁
Happy learning with trading. Cheers!🥂

Descending Triangle Breakout - MAHLOG📊 Script: MAHLOG
📊 Sector: Logistics
📊 Industry: Miscellaneous
Key highlights: 💡⚡
📈 Script is giving breakout of Descending Triangle in Daily and Weekly Chart.
📈 It is trading at upper band of BB and giving breakout of it.
📈 Already Crossover into MACD.
📈 Double Moving Averages giving Crossover.
📈 Right now RSI is around 66.
📈 One can go for Swing Trade.
Weekly Chart
⏱️ C.M.P 📑💰- 444
🟢 Target 🎯🏆 - 485
⚠️ Stoploss ☠️🚫 - 428
⚠️ Important: Always maintain your Risk & Reward Ratio.
✅Like and follow to never miss a new idea!✅
Disclaimer: I am not SEBI Registered Advisor. My posts are purely for training and educational purposes.
Eat🍜 Sleep😴 TradingView📈 Repeat 🔁
Happy learning with trading. Cheers!🥂

Bearish Divergence on the CADCHF 4h ChartBearish Divergence with CCI (Commodity Channel Index)
A bearish divergence occurs when the price is making higher highs (indicating bullish sentiment), but the CCI, which measures the variation of a security's price from its statistical mean, is making lower highs. This discrepancy can signal weakening momentum in the upward price movement, suggesting a potential reversal or pullback.
In this case, this divergence on the 4h chart indicates that despite the price climbing, the momentum behind this rise is fading, hinting at a possible downturn.
MACD (Moving Average Convergence Divergence) Crossing Down
The MACD is a trend-following momentum indicator that shows the relationship between two moving averages of a security's price. A downward cross, where the MACD line crosses below the signal line, is a bearish signal. It suggests that the short-term momentum is slowing down compared to the long-term momentum, reinforcing the bearish sentiment indicated by the
bearish divergence in the CCI.
Price Touching the Upper Bollinger Band
This suggests the market might be in an overbought condition, especially in the context of the bearish divergence with the CCI and the MACD crossing down. When the price hits the upper band, it's common for traders to expect a retracement or reversal, as the market could be seen as stretched too far to the upside.
Price Ranging Above an Untouched Weekly Pivot Point
Pivot points are used to identify potential support and resistance levels. The fact that the price is ranging above the weekly pivot point and hasn't touched it yet indicates that this level could act as a target for the downward movement. Pivot points are often considered floors or ceilings in market price movements, with the price making significant moves upon reaching these points.
Potential Drop to the Weekly Pivot Point at 0.66417
Considering the bearish signals from both the CCI divergence and the MACD crossover, along with the price's current position above an untouched pivot point, the analysis suggests that there's potential for a downward move towards the weekly pivot point at 0.66417. This level could serve as a short-term objective for bears in the market or a reversal point for traders to watch closely.
Summary
This analysis points to a cautious stance for traders, with a bearish outlook in the short term based on the technical indicators that were highlighted. It would be wise to monitor these indicators closely, along with other market factors, to confirm any potential moves before making trading decisions.
Always remember, while technical analysis can provide insights into market movements, it's crucial to consider a wide range of factors, including market news and economic indicators, before trading.

USD/CAD 4H Chart Analysis: A Bullish Reversal on the HorizonThe USD/CAD pair on the 4-hour chart is showcasing several bullish signals that suggest a potential reversal to the upside is imminent. As traders, it's crucial to decode these signals to position ourselves for the upcoming movement. Here's a breakdown of the technical indicators currently in play:
Regular Bullish Divergence
The pair is exhibiting a classic bullish divergence, with the price marking lower lows while the Commodity Channel Index (CCI) is making higher lows. This divergence indicates weakening downward momentum and a possible reversal to the upside.
MACD and Signal Line Crossover
The Moving Average Convergence Divergence (MACD), specifically the Zero Lag MACD, is on the brink of crossing above its signal line. This potential crossover is a bullish signal, suggesting that upward momentum is gaining strength.
Bounce from Lower Bollinger Band
USD/CAD has recently bounced off the lower Bollinger Band, indicating that the price was oversold and is now rebounding. This bounce further supports the likelihood of an upward price movement.
Target - Monthly Pivot Point
Given these bullish indicators, the price is poised to rise towards the monthly pivot point at 1.35260. This level will serve as a significant resistance point, and a break above could confirm the bullish momentum.
A Note on Zero Lag MACD
The Zero Lag MACD is a modified version of the classic MACD indicator. It's designed to respond more quickly to price movements, reducing the lag that's typically associated with moving averages. By applying an exponential moving average (EMA) smoothing twice, it aims to eliminate lag, providing traders with faster signals. This makes the Zero Lag MACD particularly useful in volatile markets, where timing is critical.
In conclusion, the USD/CAD pair on the 4-hour chart is showing promising signs of a bullish reversal. Traders should closely monitor these technical indicators and consider positions that align with the anticipated upward movement towards the monthly pivot point.

📈Bitcoin is on a crossroads? / Trading setups (Updates soon)📉BINANCE:BTCUSDT
COINBASE:BTCUSD
Hello dear traders.
As long as Bitcoin is above Bollinger midline, it will continue its upward path until returning to $75K.
The bullish scenario will be canceled when Price returns below the Bollinger midline and stabilizes there.

MACD Crossover - HINDCOPPER📊 Script: HINDCOPPER
📊 Sector: Non Ferrous Metals
📊 Industry: Mining / Minerals / Metals
Key highlights: 💡⚡
📈 Script is trading near at middle band of BB.
📈 MACD is giving crossover .
📈 Double Moving Averages will give crossover.
📈 Right now RSI is around 59.
📈 One can go for Swing Trade.
⏱️ C.M.P 📑💰- 281
🟢 Target 🎯🏆 - 306
⚠️ Stoploss ☠️🚫 - 269
⚠️ Important: Always maintain your Risk & Reward Ratio.
✅Like and follow to never miss a new idea!✅
Disclaimer: I am not SEBI Registered Advisor. My posts are purely for training and educational purposes.
Eat🍜 Sleep😴 TradingView📈 Repeat 🔁
Happy learning with trading. Cheers!🥂

ON Semiconductor lags its leading peer Engulfing Candle LONGON shown on a 30 minute chart- has fallen behind but is a top 50 seached on the the Zack
website. It recently trended down from a push to outside the Bollinger Bands showing extreme
buying volaility and price action than a big fade into selling volatility and a slight compression.
The TTM squeeze fired just as price fell outside the lower band. Price rose abruptly into and
over the trendline and then printed a so called" Big Ass Candle" engulfing about five
hours of price action. This is a strong buy. ON will work to catch up with MU NVDA and the
frontrunners. I will profit while it runs that race.

CRWD VWAP bounce earnings coming LONGCRWD reports on March 4th in the meanwhile in it is shown here on a 15 minute chart with
a Bollinger Band overlay. Price has trended from the upper bands down through the middle line
into the lower inner and outer bands where a reversal took place at the level of the mean
anchored VWAP band where the price fall was rejected with good support and wick touches
on the lower time frames. I see this as a set up for a new trend up in the run to earnings.
I will take a long trade of shares and call options. My easy target is the upper BB
bands but expect more than that in the upcoming week.

BOIL- Premarket Long Trade Scalp RecapsBOIL is here on the 15- minute chart with a set of Bollinger Bands, a Bollinger Band Oscillator by
LuxAlgo as well as a dual-time frame RSI indicator by Chris Moody. The settings for the Bollinger
Band set up are period 49 EMA 14 standard deviations 2 /2.618 ( These are multiples of 7 and
Fib #s for mathematical reasons.
Entries are signal is price crossing the base line of the Bollinger Bands ( the EMA 14) or else
the RSI lines crossing over the 50 level and green above red.
Exits are the price action going outside the outer upper BB band and then fading back inside
of both inner and outer bands or RSI green and red crossing such that green fades quicker than
red. Entries and exits are managed with alerts/notifications to minimize screen time.
The first trade began on 2/27 at 8:10 AM ended 2hours later. 50 shares taken gained $ 1.50 each
for a total of $75.00 realized profit in the long scalp. The second trade on 2/28 was
taken in the premarket at 6:45 AM EST with again 50 shares taken then closed at 9:15 AM
for a 150 minute trade. Realized profit was $1.20 per share and $60 overall.
Overall, there were 4.5 hours in the trades yielding $135.00 or $30 hr for the time in the trade.
Risk was minimal as trades were taken at the lows with a stop loss outside the BB and below
them. Time spent on the screen amounted to less than 30 minutes overall making the
realized profit excellent for the time and effort expended. This idea illustrates good use
of a Bollinger Band strategy coupled with alerts and notifications. Notably, I did not spend
any effor adjusting the stop losses during the trade as I am very confident of the setup and
the strategy. Today is another day for the same trade.

Long term indicator to identify Bubble territoryBollinger bands applied on the 1M Log chart create this fjord/valley forms that signal in advance that the peak is arriving and that we are in a big bubble territory.
This won't tell you the exact month when to sell, but it signals when we are entering the bubble territory, so you can know whether or not it's still safe to enter, and start selling going up hill.
Vertical lines are halving dates just for reference. The red circle is an approximate when the peak will probably take place.

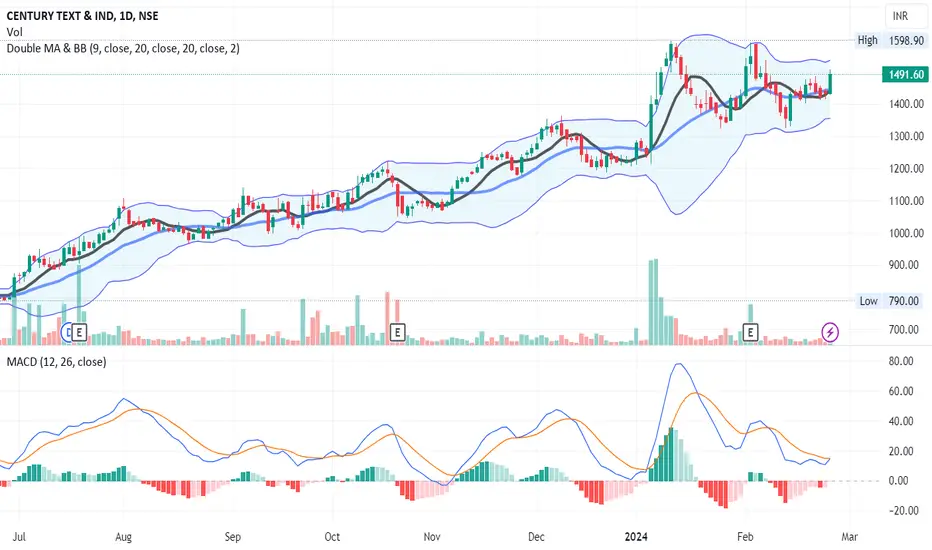
Crossover - CENTURYTEX📊 Script: CENTURYTEX
📊 Sector: Paper
📊 Industry: Paper
Key highlights: 💡⚡
📈 Script is trading near at middle band of BB.
📈 MACD is giving crossover.
📈 Double Moving Averages is giving Crossover.
📈 Right now RSI is around 58.
📈 One can go for Swing Trade.
⏱️ C.M.P 📑💰- 1491
🟢 Target 🎯🏆 - 1598
⚠️ Stoploss ☠️🚫 - 1438
⚠️ Important: Always maintain your Risk & Reward Ratio.
✅Like and follow to never miss a new idea!✅
Disclaimer: I am not SEBI Registered Advisor. My posts are purely for training and educational purposes.
Eat🍜 Sleep😴 TradingView📈 Repeat 🔁
Happy learning with trading. Cheers!🥂
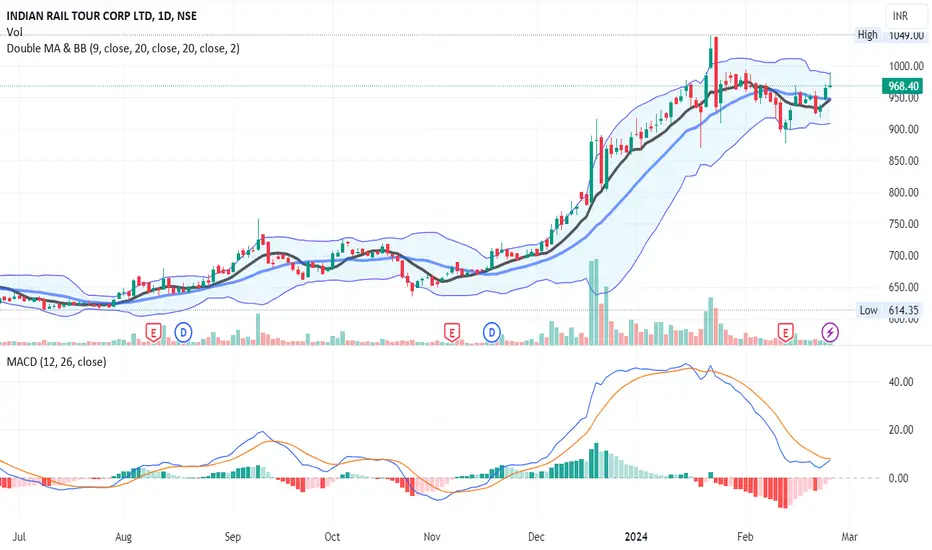
Crossover - IRCTC📊 Script: IRCTC
📊 Sector: Railways
📊 Industry: Travel Agencies
Key highlights: 💡⚡
📈 Script is trading near at upper band of BB.
📈 MACD is giving crossover.
📈 Double Moving Averages is giving Crossover.
📈 Right now RSI is around 56.
📈 One can go for Swing Trade.
⏱️ C.M.P 📑💰- 968
🟢 Target 🎯🏆 - 1049
⚠️ Stoploss ☠️🚫 - 933
⚠️ Important: Always maintain your Risk & Reward Ratio.
✅Like and follow to never miss a new idea!✅
Disclaimer: I am not SEBI Registered Advisor. My posts are purely for training and educational purposes.
Eat🍜 Sleep😴 TradingView📈 Repeat 🔁
Happy learning with trading. Cheers!🥂
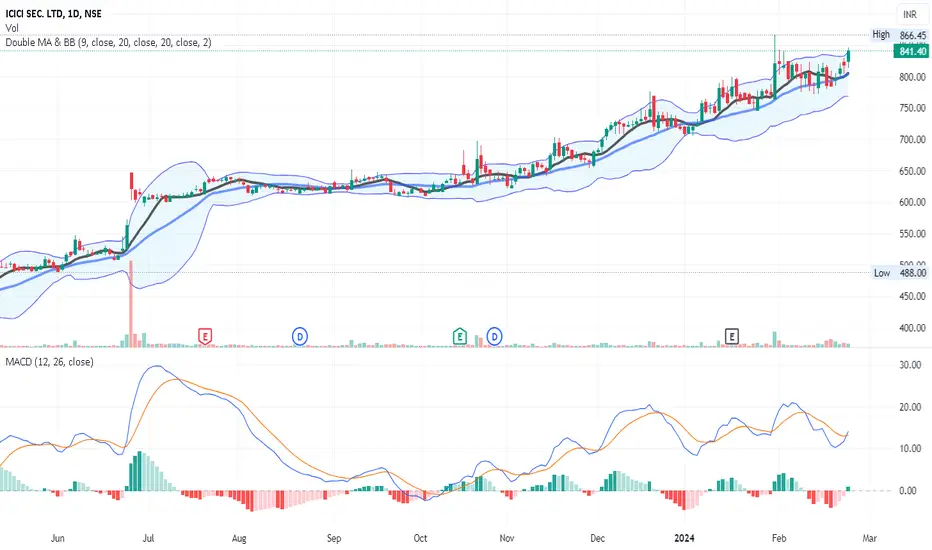
Breakout On D/W/M Chart - ISEC📊 Script: ISEC
📊 Sector: Stock/ Commodity Brokers
📊 Industry: Finance & Investments
Key highlights: 💡⚡
📈 Script is trading at upper band of BB and giving breakout of it.
📈 MACD is giving crossover .
📈 Double Moving Averages is giving crossover.
📈 Right now RSI is around 65.
📈 One can go for Swing Trade.
📈 Trendline Breakout on Daily chart.
📈 Rounding Bottom Breakout Soon on Weekly Chart.
📈 Rounding Bottom Breakout Soon on Monthly Chart.
⏱️ C.M.P 📑💰- 841
🟢 Target 🎯🏆 - 905
⚠️ Stoploss ☠️🚫 - 808
⚠️ Important: Always maintain your Risk & Reward Ratio.
✅Like and follow to never miss a new idea!✅
Disclaimer: I am not SEBI Registered Advisor. My posts are purely for training and educational purposes.
Eat🍜 Sleep😴 TradingView📈 Repeat 🔁
Happy learning with trading. Cheers!🥂
Chainlink(LINK): Will or When We Short?Chainlink caught our attention as well, with some decently high potential for the reverse to happen soon!
We are monitoring the coin after multiple BOS and FVG zones are left on the lower zones, which are waiting to be filled.
As the price had a nice breakup at $17.10, we are looking for that same sentiment to be re-tested.
So we shared two potential entries for a short position here; now starts the waiting game.
Swallow Team

YINN & YANG Market Cycles and Ratios YINN LONG nowThis weekly chart of the YANG /YINN ratio explains the rationale of the demonstration of the market cycle over the period of a few years as it relates to taking a swing trade in one or the
other and finding the likely pivot points based on resistance and support as static levels or
importance. Dynamic levels using an anchored VWAP and also a Bollinger Band are used to
support analysis and finding pivot points of importance. This is meant to be a methodology of
decreasing risk while optimizing reward. The same methodology could be deployed onto
a shorter time frame of 120 minute time frame to zigzag more often with greater precision
and potentially achieving greater profits over a given time interval. An optimal reversal on the high side is a confluence of the horizontal resistance /supply area with the upper Bollinger Band and the uppermost of the anchor VWAP bands.

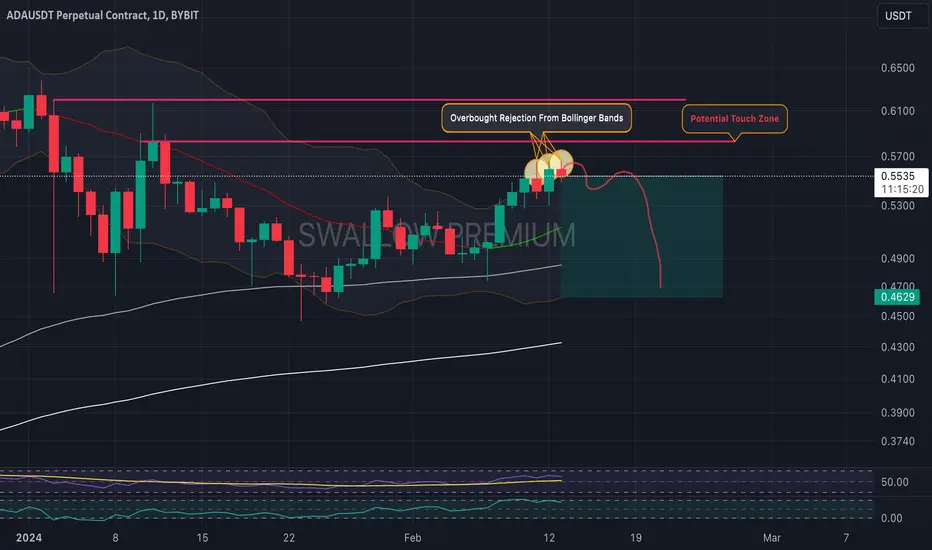
Cardano(ADA): In Overbought ZoneADA caught our attention here, where it is pushing and pushing the limits of Bollinger Bands.
As we see a great chance of seeing the price move to lower zones anytime soon, we are monitoring the coin for any potential sharp squeezes.
Overall, we are looking for that 100 EMA zone to be reached here!
Swallow Team
Algorand(ALGO): Good Time To Buy?Algorand seems to be having a pretty decent bounce from the daily 200EMA, which can be a start to a good potential upward movement here.
We are looking for those upper target zones as long as we are above 200 EMA; upon breaking the 200 EMA, we will most likely see a sharp movement to the lower zones!
Swallow Team

Cosmos(ATOM): Trying To Secure EMAsWhile markets are pushing, Cosmos has also had a nice small push.
With push being active, it is now trying to secure the branch of EMAs that is holding the price as of now. This zone will decide the next major movement for the coin.
Swallow Team

VeChain(VET): Waiting For A Breakdown!Another coin that is looking promising is VeChain, where we are looking for a potential breakdown that would result in a nice downward fall in the market price.
We are going to look for a breakdown as long as we are below that 200EMA, so keep an eye sharp for this one!!
Swallow Team

Polkadot(DOT): 200EMA Rejecting The PricePolkadot is looking similar to Litecoin, where 200EMA is acting as a pretty strong rejection zone, which is pushing the price lower and lower with each touch.
We are looking again for that lower zone (greenish) to be broken and a movement towards that target zone.
Swallow Team

Litecoin(LTC): 100EMA Working Well100EMA has been holding the price steady, so as long as we are below this 100EMA and bulls have no control over it, we should see further movement below this line.
We are monetizing this coin and looking for any potential significant rejection to happen, which would lead the price to lower the target zone.
Swallow Team

Chainlink(LINK): Overbought or Bull Run?LINK is back after that massive breakout; it recently broke the major resistance zone that was a point of interest for us.
As that being said, we are waiting for a correction on LINK to happen where the price is currently in an overbought state and there is a high chance of re-testing that broken zone (the resistance of BB).
Swallow Team
