5min. til Confirmation Candel BULL RUNNNAccording to what I see is when this 1 hour candle closes GREEN, We should see continued uptrend temporarily.
Good Luck to Us All
Bollingerbandstrategy

While We wait on the 1 hour candles... Lets view w/ 5min I've recently been testing the B.B. Reversal strategy. On XBTUSD using the 5min. candles & So far has proven to be quite profitable...(I just started testing earlier today. Sooooo) Anyways The Rules are simple, Stick to the Rules, Always wait for confirmation candle and MOST Important IS To TAKE PROFITS early. I found it to be a far better strategy IF I have a predetermined 'take profit' set. using this method it around the $200 mark, but everything is situational of coarse, but with practice you'll know when the time is right. Just DO Not Get Greedy. I've found out the Hard Way. That bitcoin is a sloth, except for when the market actually moves, and I've watched too many $200+ profits get erased in a moments notice w/o warning NEVER to return...
Here are the Rules I employ: * subject to change w/o prior notice... lol
1.- Only employ this strategy using either the 5min & OR the 1 hour candles Plz
2.- Once candle breaks through the B.B. but then closes back inside the B.B. (I've highlighted examples in chart) Once the follow candle which starts inside B.B. then usually the candle willl 1st venture back outside the B.B. almost matching previous wick... Once that candle closes back inside B.B. then its confirmed to follow trend
3. take profits at Mid way of B.B. unless candles break through Half line w/ no problem, should result in complete crossing of B.B. ( from top - botttomo vice versa)
a Gud example is IF the trending candle closes prior to crossing midway point then TAKE PROFITS Bcuz possible reversal. IF trending candle closes after crossign midway, Hell I still take my profits.... then wait to jusge market at that time, If able to jump back in do so IF not NEVER chase trends. There will Always be another opportunity. Some say count your blessing. I prefer to count my profits, but thats just Me... Too each is Own...

Check the bands, BTC up, then decline. Bands now squeezingWe have a pattern that indicates bitcoin bounces from the bottom BB and retraces a positive regression before continuing its swing. With the bands squeezing up (indicating lower volatility we could see an end to the down trend.

Big Volume increase, consolidation This is from a scan I created on Think or Swim, looking for potential breakouts. It has been consolidating for at least the past 4 hours and is above the midline of the Bollinger Band.

After range, possible H&S pattern on the 4H time-frameAfter a strong fall making the limits of the Bollinger Bands there is a possible Head & Shoulders pattern on Netflix ; Price also has climbed above 287 zone resistance, and there is still also some space on Bollinger bands to the upside.

Bollinger Bands - My FavoriteBollinger Bands, Great for determining high and lows and volatility in a market

BCH - Bollinger Band Squeeze Setup FormingBITSTAMP:BCHBTC may be forming a bollinger band squeeze setup
As you can see on the chart, the bands are narrowing and the bandwith is low
We want to see the price shoot through the upper band for a long posisition
But ideally, we want to confirm the long position by also breaking vertical support
Let's keep our eyes open on this one!
Let me know what you think.


My value channel strategy ETF investment strategy.
Long-term (3 yr)
Using my proprietary value channel strategy.
Ideal for use with long-term trending ETF's, Index ETF's work especially well.
It is based on a modified mean reversion strategy.
You can use same principles and strategies as Keltner Channels and B.Bands to get started for testing.
However, I suggest you tweak it to what works best for you and your lifestyle and make it your own and that you can trust.
1. Create trend channel.
2. buy on lows. Keep it simple.
3. Add fixed amount monthly, at low swings.
4. Never trade or invest with more than you can afford to lose.
5. Always use a stop-loss strategy.
6. For educational purposes only.
7. I am actively invested in this ETF.
Yes, it works on stocks as well, they must be trending, see tech stocks for example.
Use the last strong trend to create your baseline for your channel.
And yes you can change and update the channel as required. Monthly or Quarterly as needed. The channel is not fixed, but dynamic.
You can use the pitchfork tool or trend channel tool to draw the channels if you don't like to draw lines.

BTG Bollinger Bands LongThe price breakout for Bitcoin Gold is most likely a long with some returns. It is medium to high risk but still very investible until 3rd quarter 2018. While it isn't as investible as $BTC as a short or conservative as long, the potential is higher given more demand breakout. Also the resistance level has potential for a long run maximized trade strategy throughout 2018 to mid 2019. For a short position that is less then 2 to 3 month, it is expected to have higher risks or negative correlations.

HOW FAR WILL RIPPLE CLIMBOn Day chart price rested on the Bollinger Band Deviation 1 band and closed with a day green candle.
Now the new day candle is climbing.
How far up do you see it going?

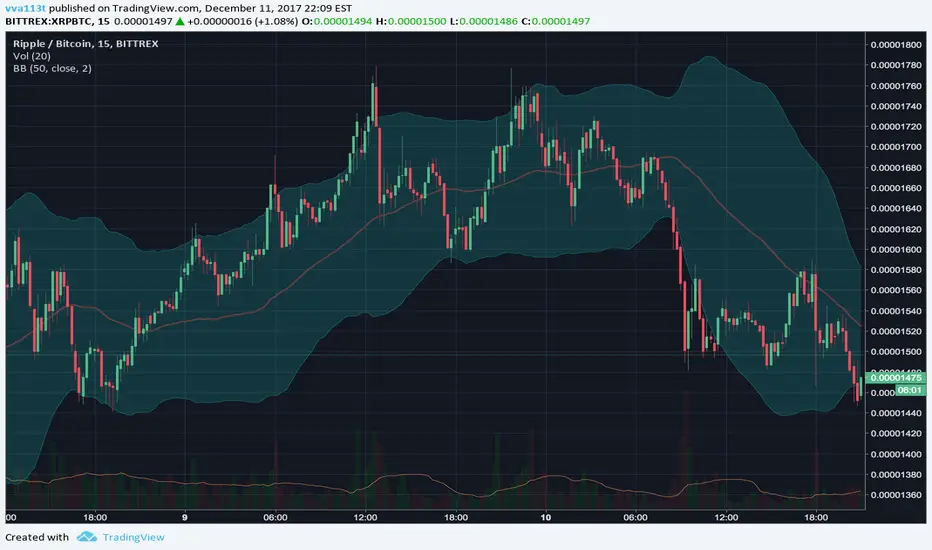
XRPBTC Quick GainBB's are the first indicators I spent a fair amount of time studying, practicing with, then leveraging for quick trades. So far I'm at roughly 88% success rate. Here's a quick entry point for scalping. In and out in a short period of time. Please keep your eyes on the screen if you're going to take my advice on this and give it a shot. Also, note that you do need to trade enough to offset the fees as the currency is extremely low cost.
Catching Bitcoin $wingsAs a followup to my last post , this is another way to see if you're catching Bitcoin in a swing.
If the price is way above the Bollinger Bands , it's an indicator that you may want to sell, and buy it back at a lower price. Way below? This is a good indication that you may want to buy. Combine this with the CM_Williams_VIx_Fix_V3_Ultimate_Filtered_Alerts , and this can be another supportive indicator of whether the price is outside of the norm. With this indicator, it seems to me that both the thickness (multiple bars together) and/or length of the green bars are indicators of abnormal price activity.
See previous post for the fuller strategy.

LISK: Did I buy at the right time?! Reversal Strategy in Effect.VOLUME, check. LOW RSI, check. BOLLINGER BAND BREAK, check. I have been working on developing my own unique (or not so unique) strategy. I only move when all THREE checkout. So far, I am having some positive odds. The arrow represents my buy in point. Now, this could never account for a Whale Bear Dump.

ETHUSD 1H RSI Bollinger Band Trade LongPrice paused at 800 sma. Candles closed outside BB with bullish reversal candle patterns. Macd was over-extended below 20 level. RSI below 20 level indicating reversal pending. TP is at the top BB.

EURUSD Day Double Bollinger BandsI will either do a day trade using these indicators or if I am going to do a shorter time frame trade I will reference this day chart template to see where price might be going.

"Trade what you see not what you think" Bearish Sentiment Validated confluences
1.Weekly/Daily Support broken Resistance valid (strong)
2.Trend Trading
3.Profit margin 1:3
4.No major support until 1.4200 desirable profit margin
5.Weekly Trend-Line broken (Strong Validation)

BTCUSDT Close of Day TradeMany Brokers have close of Day at 5 pm EST. At that close of day look to see where the day candle closed. If closed above the BB 1 band inside the range box then that new day should be bullish. If closed below the BB 1 band then that new day should be bearish. I have two Bollinger Band indicators on my chart. One has a deviation of 2 and the other has a deviation of 1. Day candles have been inside the Bollinger Band (BB) 1 bands which shows me a range box.

"Trade what you see not what you think" Bullish Sentiment Validated confluences
1.Monthly,Weekly,Daily uptrend
2.Daily Support valid Resistance Broken
3.Trend Trading
4.Profit margin 1:5
5.Daily Trend-line still validated
6.Breached lower (Bollinger-Band) which indicated strong area of support
7. The revised level is Lower on the curve increasing probability
8.Opposing zone breached (Strong Validation)

Well, we'll see more of that soon! For today: Sell till the EOtD
For the next week: Sell till the EOtW
Good for binary options and forex!
- The trend-resistanxe line
- The daily resistance line
- Bollinger's turning
- The MA-resistance line
Be careful! Have a nice weekend!

Crude Oil Continues Moving LowerCrude moved lower on Monday but ended the day in the middle of the daily range, unable to break through Friday's low of 46.74. Price also tested the weekly Pivot Point above at 48.13 but was not able to break above that mark. As long as crude trades below that Pivot Point, it indicateds that price wants to keep moving lower.
The Heikin-Ashi chart showed a slowing of the downward movement with an inside candle today. However, the trend is still solidly red.
If you like this post, please click the Like button, tell your friends, and re-Tweet!
Disclaimer: This post is for educational purposes only. Trading is at your own risk.

Crude Tests Higher After Inv RPT but Falls Below Key LevelsCrude tested higher this morning after the weekly inventory report showed a bigger than projected sell-off of inventory. However, WTI Crude failed to maintain it's bullish run and ended the day below the 2 important key levels. Those levels are the 21 day moving average @ 48.41 and the monthly pivot @ 48.13. And while the Elliot Wave Oscillator has not yet crossed below the 0 line, the haDelta indicator has printed a new magenta dot which indicates a new downward wave is starting. This gives the confluence of 3 technical indications to support the move down to the 45 to 45.50 price area.
Nice downtrend now on the Heikin-Ashi chart.
If you like this post, please click the Like button, tell your friends, and re-Tweet!
Disclaimer: This post is for educational purposes only. Trading is at your own risk.

Crude Oil Moves Down $1 but Fails to Close Below RangeCrude oil closed down $1 today. During the day, my first price target @ 48.36 was hit (I mentioned that in last night's post). Crude did hit a low of 47.73 but was unable to stay below the 48 price level, and in a something of show of strength, rebounded almost a dollar off the day's lows. The closing price of 47.73 was just 2 cents shy of the 21 day moving average.
So while the late day rally did show signs of strength, the technical indicators are still showing a more bearish outlook. First, there's the haDelta which has just printed a new magenta dot. That indicates a high probability of another downward wave. Second, the EWO indicator has been moving down since May 25 and is close to a zero line cross. Third, the Heikin-Ashi candles are red and starting to show signs of a continued downward trend.
The key levels right now are 21 day moving average and the Primary Pivot Point (orange lines). I've added the standard Pivot Point indicator to the chart and set the type to Fibonacci. The P level is currently at 48.13. A break below this level will increase the odds of a continued move down to the lower Bollinger Bands.
Crude Oil inventories come out tomorrow at 11 am EST. This is on Thursday this week due to the Monday holiday in the US. There is also other news tomorrow morning including Jobless Claims at 8:30 am EST and ISM Manufacturing PMI at 10 am EST. Expect some news generated volatility and protect your trades accordingly.
If you like this post, please click the Like button, tell your friends, and re-Tweet!
Disclaimer: This post is for educational purposes only. Trading is at your own risk.
