VET/USDThis is a longterm analysis of a possible 3 year outlook for VET/USD using the 1 week chart.
Here is a closer look at this VET/USD 1 week Chart.
On this 1 week timeframe, VET has been back above its Least Squares Moving Average (LSMA) since the week of 7th March 2022. Note that a weekly close ABOVE the LSMA is considered a BUY SIGNAL for this indicator.
VET is also back ABOVE its Bollinger Bands Middle Band Basis 20 Period SMA for this 1 week timeframe. Note that the Upper and Lower Bands are still contracting indicating VET still has plenty of room to move up or down before expansion kicks in and it becomes over extended on this 1 week timeframe.
VET is Back ABOVE its 100MA (Red Line) but still BELOW its 50MA (Blue Line) on this 1 week timeframe.
VET is in a massive Rising Wedge Pattern, the APEX of which is around the week of 5th - 12th May 2025 and is at around $8.8 as indicated by the Rising Converging Blue Lines.
VET is also in a Triangle Pattern as indicated by the Converging Black Dotted Lines.
Looking at the Trend-Based Fib Extension we can see that at the moment, VET has found some resistance from its 0.236 level at $0.0876. Note that the Fib Levels are based on Log Scale.
VET closed the last weekly Volume Bar ABOVE its Volume 20 Period MA, in the Green and this weekly Volume Bar will also close ABOVE its Volume MA.
VET is above its Volume Profile Fixed Range Point of Control (VPFR POC) for the Fixed Range of 3 Weekly Candle that i have selected.
Looking at the Moving Average Convergence Divergence (MACD), we can see that we have a BUY SIGNAL on this indicator for this 1 week timeframe because the MACD Line (Blue Line) has crosses back ABOVE the SIGNAL Line (Orange Line) creating a new Green Histogram. This is the first new BUY SIGNAL since the week of 25th Oct 2021 and it’s the first new Green Histogram since 22nd Nov 2022. Note that the MACD Line (Blue Line) is still in the Negative Zone under the 0.0 Base Line, so the next key thing will be when the MACD Line (Blue Line) crosses back over and ABOVE the 0.0 Base Line into the Positive Zone.
Looking at the Relative Strength Index (RSI) for this 1 week timeframe, we can see that Momentum is upwards at the moment and the RSI (Purple Line) is back above its 9 Period EMA (Orange Line) and indicating upwards momentum strength. Note that the RSI (Purple Line) has plenty of room to move up before entering the Overbought Zone which is above 70 on this 1 week timeframe.
Looking at the Average Directional Index (ADX DI) we can see that the Trend Strength is still weak with the ADX (Orange Line) at 14.51 under the 20 Threshold and under its 9 Period EMA (Black Line). Positive Momentum has increased with the +DI (Green Line) rising to 25.101 and ABOVE its -DI (Red Line) which is at 19.21. A very good sign on this 1 week timeframe will be if we continue to see the +DI (Green Line) expand further away from the -DI (Red Line) as well as the ADX (Orange Line) crossing back ABOVE its 9 Period EMA (Black Line) and AOVE 20 Threshold.
With such a large rise on the Daily, we shouldn't be surprised if VET re-traces back to its LSMA or even its Bollinger Bands Middle Band Basis 20 Period SMA on the 1 day timeframe. Here is a look at the 1 day chart so you can see the Expansion of the Bollinger Bands. Note that VET found support today from its LSMA Level on the 1 day chart.
Obviously a lot can happen and change in 3 years with the Crypto Market, VET can easily break ABOVE or BELOW and CLOSE a Weekly Candle ABOVE or BELOW the Rising Wedge Pattern's Trend Lines to invalidate it way before it ever gets to the APEX.
The first crucial step for VET will be CLOSE a weekly Candle ABOVE its 0.236 Trend-Based Fib Level at 0.0876 and if needs be, to successfully re-test that level as strong support.
Key things to look out for the potential start off on this VET/USD longterm 1 week timeframe in no particular order:
For the Positive Side:
1: A successful close ABOVE the 0.236 Trend-Based Fib Extension level.
2: Expansion of the Upper and Lower Bollinger Bands while the Price is above the Upper Band.
3: A successful Weekly Close ABOVE the 50MA,
4: The BB Middle Band 20 Period SMA crossing back ABOVE the 50MA
5: The 100MA crossing back ABOVE the 50MA
6: The MACD Line (Blue Line) crossing back above the 0.0 Base Line into the Positive Zone
7: The ADX Line (Orange Line) crossing back ABOVE the 20 Threshold and its 9 Period EMA (Black Line).
8: A Weekly close ABOVE the Ascending Upper Blue Trend-line of the Rising Wedge Pattern.
9: A Weekly Close ABOVE the Upper Triangle Pattern Trend-line.
10: A successful close ABOVE the 50MA.
For the Negative Side:
1: A successful close BELOW the 0.236 Trend-Based Fib Extension level.
2: A drop back UNDER the BB Middle Band Basis 20 Period SMA.
3: A Weekly Close back UNDER the 100MA,
4: A weekly Close back UNDER the LMA.
5: The 100MA crossing back ABOVE the 50MA
6: The MACD Line (Blue Line) crossing back UNDER the SIGNAL LINE (Orange Line)
7: The +DI (Green Line) crossing back UNDER the -DI (Red Line).
8: A Weekly close BELOW the Ascending Bottom Blue Trend-line of the Rising Wedge Pattern.
9: A Weekly Close BELOW the Lower Triangle Pattern Trend-line.
10: The RSI (Purple Line) crossing back UNDER its 9 Period EMA (Orange Line)
I’m sure I’ve missed a few things but that’s probably enough of me rambling on.
I hope this post is helpful with your Trading, Hodl-ing or DCA-ing.
Bollingersband

BOLLINGER BANDJohn Bollinger invented the Bollinger Bands, which are a sort of price envelope. Bollinger bands help determine whether prices are high or low on a relative basis. They are used in pairs, both upper and lower bands and in conjunction with a moving average. Bollinger Bands are price envelopes drawn at a standard deviation level above and below the price's simple moving average. The bands respond to volatility fluctuations in the underlying price because their distance is based on standard deviation. Bollinger bands are used to evaluate if prices are relatively high or low. They're employed in pairs, with upper and lower bands, and with a moving average in between. The indicator's main line is a simple moving average (SMA). This charting software defaults to a 20-period chart, which is sufficient for the majority of traders. At 7/6/2022, the price reached the top at the band at 51.91. After that, As can be seen, the price has settled back into the middle of the bands. Then at 21/6/2022, the price break the Lower band. This information help me add context to trends and potentially determine when they might be overextended and reverse. When it does, probability theory assumes the security price is likely to revert back to a moving average, or mean, between the upper and lower bands. This is called mean reversion and this is use as trading decision for me. Then I set a Entry/ Buy price at 39.89, Target Profit near the middle at 43.13 and Stop Loss Below the Lower Band which are 35.76.

BTC/USD - 1 day chart analysisLooking at the BTC/USD daily chart we can see that BTC is still under its Least Squares Moving Average as well as still under its Bollinger Bands Middle Band Basis 20 Period SMA. Note that we have expansion of the Lower Bollinger Band.
BTC is still in a Descending Pitchfork Pattern and has found some support from its Upper Green Pitchfork Support Line. Note that BTC is still above the Descending pitchfork Median Line. A drop to the Pitchfork Median Line would take BTC to around $20,000 which is new its 0.786 Trend-Based Fib level at around $20,122.
I have added various Support Lines on this chart and you can see the major Descending trend-line that BTC must CLOSE ABOVE and if needs be to successfully re-test as support on this 1 day timeframe. There are more support lines i could add but the chart would become too messy.
Looking at the Trend-Based-Fib Extension we can see that BTC is still under its 0.5 Trend-Based Fib level around $30,352.
Looking at the Volume Profile Visible Range (VPVR) we can see areas of interest that that might arise that has previously had massive volume. These levels coincide with the Support and Resistance Lines that I’ve added. The Volume Profile Visible Range Point of Control (VPVR POC) for this charts Visible Range is at around $19,112.
I have added a Volume Profile Fixed Range (VPFR) indicator which is from 27th Mar 22 to 11th June 22 and as you can see BTC is still below its Volume Profile Fixed Range Point of Control (VPFR POC) for that fixed range.
Here is a closer look at this 1 day chart.
Looking at the Moving Average Convergence Divergence (MACD) we can see that the MACD Line (Blue Line) is still in the Negative Zone under the 0.0 Base Line on this 1 day chart. Note that it looks like the MACD Line (Blue Line) may cross back under its Signal Line (Orange Line) creating a Sell Signal for this indicator on this 1 day timeframe.
Looking at the Average Directional Index (ADX DI) we can see that Negative Momentum has increased with the -DI (Red Line) rising to 25.39 and Positive Momentum has dropped with the +DI (Green Line) dropping to 15.50. Note that the Trend Strength is now turning sideways with the ADX (Orange Line) at 24.18 and the 9 Period EMA (Black Line) is heading downwards at 34.37. If the ADX (Orange Line) crosses back above the 9 Period EMA (Black Line) then that will be further strength for the downside if the -DI (Red Line) is still above the +DI (Green Line) on this 1 day timeframe.
All in all looking at this 1 day chart mid-term wise BTC shows no sign of breaking to the upside just yet. Look like there will be continued opportunities to acquire your crypto of choice at bargain prices.
I hope this chart is helpful with your Trading and Hodl-ing.

BTC short term agenda Bullish Engulfing confirmed on 2h timegrame
CME gap between 19,4k - 18.5 almost filled
MACD trend changed to bulish
BB median movement changed to bulish
3rd Elliot wave down completed
Going for 4th, which is a small ride till 20,7k (8%)
Enjoy it :)

BABA LONGKeltner Channel is looking upward which is typically a good set up for long position.
RSI just bounced back from level 50 and is going to cross the signal line again. Hopefully aiming for the overbought zone.
MACD seems to be losing strength but always above the signal line.
Moreover having a look at EMA we can see that 6EMA crossed up 18EMA which crossed up the 50EMA. It could be a hint bullish momentum.
Stochastic and Bollinger bands seem to confirm previous situation.
We put the entry price above yesterdays closing price just to have some margin because of the premarket price which is at 106.6 at the moment while writing.
ENTRY: 107 YELLOW
SL: 100.73 RED
TP: 119.5 GREEN

USDCHF potential bearish dropThe price has been rising, however the RSI is above the 70 threshold, so this indicates that it is overbought. Price is at the top of the Bollinger band and this also indicates upcoming bearish momentum. we are looking for 50% Fibonacci retracement.
Target: 0.979
Entry: 1.00
S&L: 1.012

Nasdaq-100 Riding on/below lower Bollinger Band Daily & WeeklyAfter 4 days of intense selling, we're back to new cycle drawdown lows in the Nasdaq-100. Meanwhile, the selling has pushed us below the lower Bollinger Bands on multiple time-frames (weekly chart left and daily chart right). It's nasty out there.

Volatility within a rangeHere’s one if you like drama. Barely averting a strike in Norway, ongoing conflicts in Ukraine, the Saudis cutting supply to China, oil is in the middle of it all. With so much uncertainty, oil has been suffering bouts of volatility recently which presents an opportunity for trading.
Over the past month, crude oil futures seem to be trading within an ascending wedge. A bollinger band marks out the upper and lower range that prices have bounced off previously. When coupling this with Relative Strength Index (RSI), we see a recurring pattern where prices bounce off the lower bollinger band as RSI reaches the oversold levels. With current prices trading near oversold levels and the bottom bollinger band just a touch away, we see a bounce on the horizon.
Let’s stay patient and wait for confirmation from prices touching either the support of the ascending wedge or breaking the lower bollinger band before committing to the position.
Entry at 117.8, stop below 114.5. Target at 125.
Disclaimer:
The contents in this Idea are intended for information purpose only and do not constitute investment recommendation or advice. Nor are they used to promote any specific products or services. They serve as an integral part of a case study to demonstrate fundamental concepts in risk management under given market scenarios.

BTC bottom in or more blood?BTC looks like it hit a bottom after LFG cleared out its $BTC reserves to defend its stability.
The momentum indicator if continues to curl up may produce a bullish momentum div, not yet confirmed. BBWP reading about to top out, no confirmation yet either upon crossover of its MA. EWT corrective target hit ~$30.7k from 1.272 fibs measured from late Jan. bottom to late March top. Not to mention we've hit the bottom of a fork
There are risk factors of this idea not playing such as:
BTC continues to correlate with trades/sp500 and drops alongside it as QT continues, and interest rates get risen from the fed.
BTC has not retested the 200W MA
Cyber security risks w/ regard to complete shutdown of power grids mining BTC and hosting/running many DeFi/L1/L2 services, with nations like RU/CN engaging in non-kinetic warfare. We've already seen RU disconnect intercontinental cables in the Atlantic. As the EU holds out on gas during winter, we could see more desperate measures/retaliation through new avenues in 5th Gen. warfare .
Shanghai lockdown fails to prevent the spread of bird flu , potentially inducing another global lockdown
If the trade does get stopped out, the next areas of interest for entry would be 23k if we close under $29.2k on the daily, invalidating bull impulsive Elliott wave since late June. The on-chain bottom is ~$27k, and 200W MA is ~$21K, both are also entries in the event of an invalidation.
Trade:
Entry:$30.7k
SL: $26.6K
TP: Hull MA ~$36k, ABC PoC ~$39k

Bitcoin price leveling outUsing Bollinger bands with momentum on the 1 hour and 4 hour time frames for dollar cost averaging, it seems that Bitcoin is beginning to level out and stabilize in price action.
This could be the bottom of this downward trend we have seen since the middle of November of 2021, however, I believe caution needs to be used and careful planning. Based upon the market's recent events of unpredictability and unstable volatility, I believe dollar cost averaging is the best approach over the long term in dealing with this unusual market while protecting your investment.
Whether or not this trend continues, it really doesn't matter as this is a good middle range point to pick up a few more positions in it for either a nice little profit if the market does rise, or a stable accumulation point for a continued downtrend.
The only thing that is really clear at the moment, is that the market is at a pivotal point. Risk mitigation and budget management skills are a requirement as this really could go either way.

VET/USD - UpdateAs I mentioned in my previous VET post in March, there was always a possibility that VET would drop out of the Bottom Trend-line of its Ascending Wedge and Invalidate that Ascending Wedge Pattern, which has happened. VET also failed to get back above its 0.236 Trend-Based Fib extension Level on that previous chart so we know that $0.087 is the price that VET needs to close a daily candle above solidified with a successful re-test as support.
So let’s move on.
Using a longterm Modified Schiff Pitchfork Pattern (A,B,C), you can see that VET is still below its Modified Schiff Pitchfork Pattern Median Line.
At the moment VET has found some support from its Lower Green Pitchfork Support Line.
Let’s take a closer look at this 1 day VET USD chart with the Bollinger Bands, LSMA and VPFR POC.
At the moment VET is fighting to stay back above its Bollinger Bands Middle Band Basis 20 Period SMA for this 1 day timeframe. Not that the Upper and Lower Bands are moving sideways at the moment. Using the VPVR, you can see that the Upper and Lower Bands are located roughly above and below an area of large volume.
At the moment VET has found some support from its Least Squares Moving Average (LSMA) level. A daily close ABOVE the LSMA is crucial for continued upwards momentum.
At the moment VET is trying to stay back above its Volume Profile Fixed Range Point of Control (VPFR POC) for the Fixed Range of 22x daily candles i have selected.
For your viewing pleasure i have added various support and resistance lines (Black Solid Lines and Black Dotted Line) as well as various support areas as highlighted by the horizontal black lines with yellow shading.
As you can see, VET is now in a Descending Triangle Pattern (Bearish) as well as a Descending Wedge Pattern (Bullish). Note that the APEX of the Descending Triangle is located around Nov 2022 and the APEX of the Descending Wedge is located around March 2023. Note that a pattern can easily become invalidated with the price drop below and successful re-test as resistance of the bottom trendlines.
Looking at the Average Directional Index (ADX DI) we can see that Positive Momentum is still downwards with the +DI (Green Line) dropping to 14.17. Note that Negative Momentum is also down with the -DI (Red Line) dropping to 20.00. Note that the Trend Strength is still strong but has dropped with the ADX (Orange Line) dropping to 30.52 and the ADX is also back under its 9 Period EMA (Black Line) at 33.84 which is further confirmation of a weakening of Trend Strength at the moment.
Looking at the Moving Average Convergence Divergence (MACD), we can see that Momentum is upwards at the moment with the MACD Line (Blue Line) pointing upwards and is still back above its Signal Line (Orange Line) on this 1 day timeframe. Note that the MACD Line (Blue Line) is still BELOW the 0.0 Base Line in the Negative Zone.
Looking at the bottom Volume indicator we can see that overall traded volume is still low especially compared to what VeChain was getting from around October 2019 to May 2021. This is similar to Bitcoin’s daily chart which possibly means that while big money might actually be accumulating crypto assets like BTC, but there hasn’t been a constant inflow of big money actually trading crypto like BTC on a regular basis since around May 2021.
Using the Volume Profile Visible Range (VPVR) indicator, you can see where the Volume Profile Visible Range Point of Control (VPVR POC) is for this VeChain Chart is. Using the entire charts range we can indicate at what price range was the most volume was traded at. At the moment the Crypto market is following BTC so if BTC drops to $20k or $12,400 then we may see a wick down to around $0.009 which would offer a real great buying opportunity for most crypto. If BTC doesn’t drop to $20K then we will see VeChain eventually break back above its Descending Triangle, its Descending Wedge and eventually back above its Modified Schiff Pitchfork Median Line.
I hope this post is helpful with your trading or hodl-ing.

CHFJPY SellThe price has been rising, however the RSI is showing that CHFJPY is being overbought which would be an indicator for a bearish momentum. The price is also touching the upper level of the Bollinger band, which would also indicates bearish momentum. We are looking for a 50% Fibonacci retracement.
Target: 131.780
Entry: 135.235
S&L: 136.720

Big Ass Move Incoming... 😲Hey Traders,
Volatility is at an all-time low. According to the Bollinger Bands, we haven't been this stagnant since 2020. When the bands tighten, it is a good indication of a substantial move coming. I highly recommend longing as we have been in a downtrend for so long...
Safe Trading,
-Pulkanator

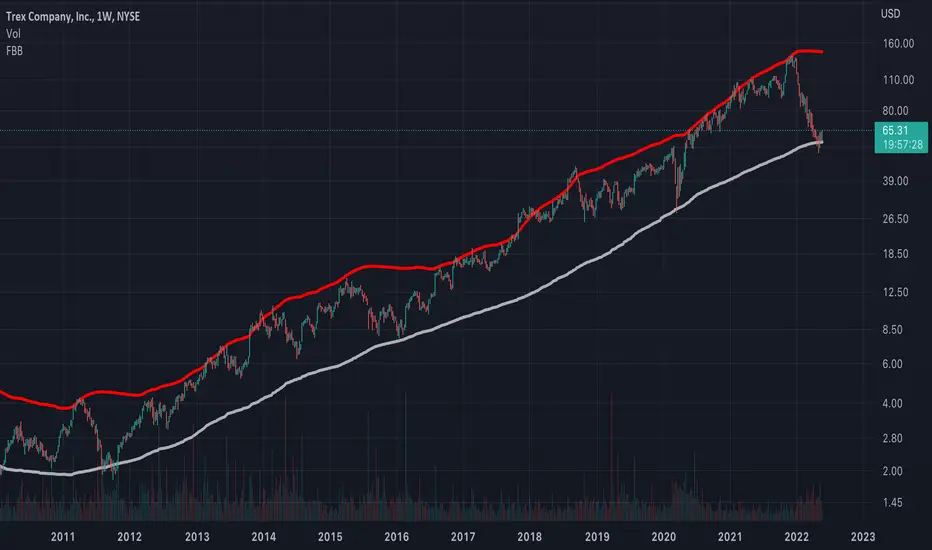
TREX continues range-bound TREK The weekly chart for TREX shows that price appears to remain bounded by the upper band (red) and basis (white) of the Fibonacci Bollinger Bands as it has since the Great Recession. The price is looking ready for a bounce. The oscillators are too oversold on the monthly chart to support a high probability that TREX will drop sharply below the white level. Therefore this price area represents a rather low-risk buying setup.
Not financial advice. As always anything can happen and trends can end.
ADA/USDA quick look at the ADA/USD 1 day chart:
ADA is still below its Longterm upwards Pitchfork (Blue A,B,C) Median Line on this 1 day timeframe.
ADA is also below its smaller descending Pitchfork (Black A,B,C) Median Line on this 1 day timeframe.
ADA is still below its Bollinger Bands Middle Band Basis 20 Period SMA for this 1 day timeframe. Note that the Lower Band is till pointing downwards and the Upper Band is now moving downwards.
At the moment of typing this, ADA is trying to get back and stay above its Least Squares Moving Average (LSMA) on this 1 day timeframe.
Note that ADA is still above its Volume Profile Visible Range Point of Control (VPVR POC) for this charts entire Visible Range. Looking at this range gives us a sense of potential upcoming areas of previous volume interest that may offer good buying opportunities if ADA drops lower.
ADA is also still under its Volume Profile Fixed Range Point of Control (VPFR POC) for the Fixed Range of 11x Daily Candles that i have Selected.
Looking at the Ichimoku Cloud with the 20,60,120,30 settings:
The Ichimoku Cloud Conversion Line (Tenkan Sen) is indicating that the Mid-point of the Short-term Momentum is sideways at the moment.
The Ichimoku Cloud Base Line (Kijun Sen) is indicating that the Mid-point of the Mid-term momentum is also sideways at the moment.
The Ichimoku cloud Lagging Span (Chikou Span) is indicating that momentum is upwards at the moment for this 1 day candle. Note that The Lagging Span (Chikou Span) is still under the Price from 30 Periods ago.
Note that both the Leading Span A (Senkou Span A) and Leading Span B (Senkou Span B) are moving sideways at the moment indicating a decrease in volatility at the moment.
Looking at the Average Directional Index (ADX DI) we can see that the Trend Strength is strong with the ADX (Orange Line) at 40.249 and above its 9 Period EMA (Black Line) which is at 37.203. Negative momentum is still dominant with the -DI (Red Line) at 29.750 but note it has dropped from 37.0. Positive Momentum has increased slightly with the +DI (Green Line) rising to 10.83.
Looking at the Moving Average Convergence Divergence (MACD), we can see that momentum is sideways with a slight upwards trajectory. Note that the MACD Lien (Blue Line) is still under its Signal Line (Orange Line) and still in the Negative Zone under the 0.0 Base Line on this 1 day timeframe.
Potential areas of previous Volume interest to look out for if you want to go long on ADA if ADA drops further are potentially:
$0.411 to $0.298,
$0.179 - $0.128,
$0.111 - $0.082,
$0.049 - $0.033.
Using the indicators on this chart, for confirmation of a renewed mid to longterm uptrend on this 1 day timeframe, we need to see:
1: ADA to successfully close a daily candle ABOVE its Bollinger Bands Middle Band Basis 20 Period SMA and stay above it.
2: ADA to successfully close a daily candle ABOVE its Least Squares Moving Average (LSMA) and stay above it.
3: ADA to cross back into the Bullish Zone of the Ichimoku Cloud and for the Leading Span A (Senkou Span A) to cross back ABOVE the Leading Span B (Senkou Span B) creating a Kumo (Cloud) Twist creating a new Bullish Green Cloud for this 1 day timeframe.
4: The Ichimoku Cloud Lagging Span (Chikou Span) to cross back ABOVE the Price from 30 Periods ago and stay above the price below it.
5: The +DI (Green Line) to cross back ABOVE the -DI (Red Line) on the Average Directional Index (ADX DI)
6: the MACD Line (Blue Line to cross back ABOVE its Signal Line (Orange Line) and back ABOVE the 0.0 Base Line into the Positive Zone on this 1 day timeframe.
7: ADA to cross back ABOVE both Pitchfork Median Lines especially the Longterm upwards Pitchfork (Blue A,B,C).
Apologies for the lack of posting, i have been busy filming a new feature film. I'm sure there's more things i could post and I've probably missed a few things but this hopefully gives people enough for to ponder.
I hope this is helpful with your trading and hodl-ing.

BTC/USD 1WLooking at the Trend-Base Fib Extension we can see that BTC found some support from its 0.5 Fib Level at $30,329. If this support level fails then the next Fib Levels are 0.618 at $26,100 and 0.786 at $20,077.
Looking at the Bollinger Bands, we can see that BTC is still way below its Bollinger Bands Middle Band Basis 20 Period SMA on this 1 week timeframe. Note that at the moment BTC is below its Bollinger Bands Lower Band.
Looking at the Least Squares Moving Average (LSMA) we can see that BTC closed a weekly candle below its LSMA. A close below the LSMA is considered a sell signal.
A key area of support is the area from around £31,075 to $28,666 as highlighted by the horizontal black lines with yellow shading. Note that BTC has found support from this Support Zone 9 times previous since the 4th Jan 2021.
Looking at the Volume Profile Visible Range (VPVR), you can see potential upcoming areas of previous volume interest if the support at around $28,666 and the 0.618 Fib Level at $26,100 both fail. Note that for the timeframe starting Sept 2020 to the present day, BTC is still below its Volume Profile Visible Range Point of Control (VPVR POC) for this charts Visible Range.
Note that BTC is still below its Volume Profile Fixed Range Point of Control (VPFR POC) for the fixed range of 7 weekly candles i have selected.
The Average Directional Index (ADX DI) is indicating a sharp rise in Negative Momentum on this 1 week timeframe with the -DI (Red Line) rising to 30.54 and the +DI (Green Line) dropping to 16.27. Note that the Trend Strength is increasing with the ADX (Orange Line) rising to 17.39 and crossing above its 9 Period EMA (Black Line) which is at 17.37.
The Relative Strength Index (RSI) is indicating momentum is downwards at the moment for this 1 week timeframe. Note that the RSI (Purple Line) still has room to drop further before entering the Oversold Zone on this 1 week timeframe. Note that the RSI is still below its 9 Period EMA (Orange Line) indicating negative momentum strength.
Looking at the Chaikin Money Flow (CMF) we can see that the CMF line (Green Line) is still under the 0.0 Basel Line in the Distribution Zone and has been since the week of the 21st Feb 2022 on this 1 week timeframe. Note that the CMF (Green Line) is also below its Least Squares Moving Average (LSMA) indicating strength for distribution.
If we use the area from around $31,075 to $28,666 as our base and the Descending Trend-line then we can clearly see that BTC is also in a Descending Triangle Pattern on this 1 week timeframe. In any case, if the support area fails then there will be some good opportunities to acquire BTC or your crypto of choice at a bargain price before the next bull cycle upwards. Never say never.
I hope this quick and dirty post is helpful with your trading and hodl-ing.

BTC pullback to 39kBTC has hit expected resistance around 47k from the PoC of the volume profile of the drawdown since the ATH to the Jan. 24 low of 33k. If BTC breaks the recent retest of the 55D HMA it will increase the probability of at least retesting 39k. The BBWP indicator below confirmed the end of the recent uptrend, suggesting BTC will at least consolidate for a while
I have doubt that we'll revisit sub 39k in one candle given how long BTC's bearish sentiment has been since the ATH. But if we do break down 39k, these are the support levels to look out for: 33k-35k, 30k, 27k, and 23k. I have my EW targets set there as I believe the range is a bearish triangle pattern ending on the 47k PoC. Nonetheless, it is a bit worrisome to see coins distributed recently from whales.
Short trade:
Entry:45.8k
SL: 49k
TP:39K
Support and Resistance Levels are noted on the chart. Green levels are support, and red is resistance. All other colors are areas of interest that could signify a major
price reaction.

USD RUB long positionHi everyone! As it can be seen on week TF we have clear signals from trend, from mr. Bollinger and Mrs. EMA9. All we have to do - to enjoy the show with our long positions set! Every move below the trendline must be considered as false.

Why Buy from D-Mart? Just Buy D-Mart.NSE:DMART
Stock is forming Triangle Pattern And you can take here a Swing or Positional Trade, on daily Time Frame also Bollinger Band it shows strong buying signal.
Target and Stop Loss depends on Investors and the above article is just for learning purpose.

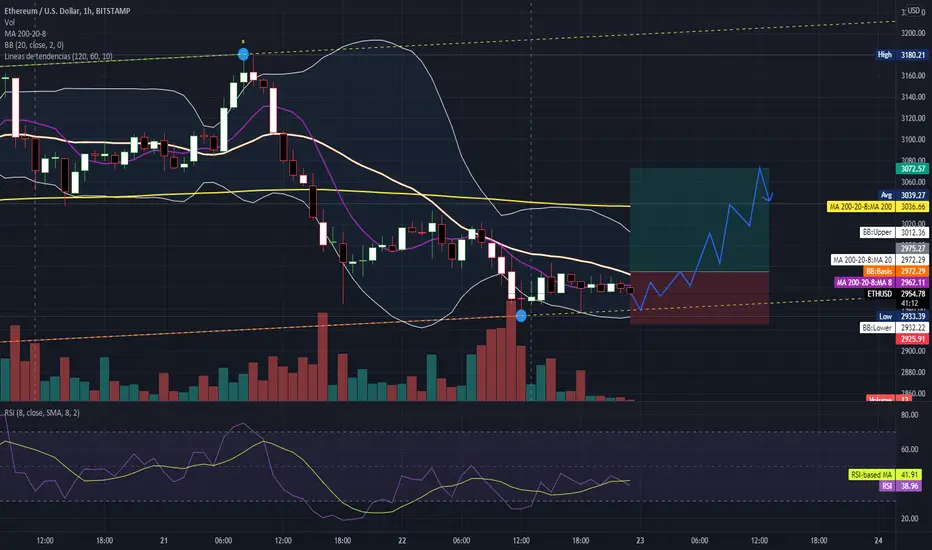
ETHUSD, We migth have uptrend, Intraday Strategy PP target R1-R2Hello traders, we might have some long position, working with Intraday Strategy Pivot Points Levels
Important take a note about this. Check the trend, confirm the uptrend when the prices cross the Pivot Point over up, and then R1, MA200, and R2. Controlling that the market doesn't reject those levels, we might get some profits with it.
Indicator MA 200, 20-8 RSI 8 MA8 Bolliger 20. Frame 1 hour
R3 3,176.43
R2 3,076.56
R1 3,019.99
PP 2,976.69
S1 2,920.12
S2 2,876.82
S3 2,776.95
EOS / ETH ↗️Buy Signals:
- Bullish Divergence BB%B
- Fibonacci Confluence matches div ( 3rd Fib cluster )
- Potentially bottomed in large channel
Other Signals
- Bollinger Band Squeeze ( potential large move in either direction )
- BBW all time high( existing trend is ending )
- Pending price action when price approaches the cloud.
Invalidation:
- Increased Volume and rejection in or before the cloud. ( strong resistance )
- BB%B fails to make a higher high and double tops.
- Rejection of the first Fibonacci price cluster.
Target Price:
- 1rst target: 0.0017-0.0018 ETH
- 2nd target: pending price / volume action in 1rst cluster.
- 3rd target: pending price / volume action in 1rst cluster.
- Ultimate target: 0.0065 ETH ( anticipate price to touch the beginning of the div )
Stop Loss:
0.0006712 ETH
Strategy:
- Dollar cost averaging while under first target.
Type of Trade:
- Long Swing Trade
- Ongoing purchase for contract deployment as insurance for increased contract costs.
Why buy:
- Ideal trade for any developer planning to migrate from ETH to EOS, potentially saving on EOS smart contract deployment costs.
Fundamental
- Unpopular opinion: Despite its controversial beginnings, EOS is a genuine blockchain with a unique resource model allowing feeless transactions, it only lacks a larger following, development of more trendy products, and is often overshadowed by its genesis.
- EOS EVM is being launched.
Long term outlook:
- EOS is highly inflationary and unlikely to create a long term bullish trend against ETH, however in the short term is likely to outpace ETH.
- EOS/USD is a different assessment.

HOOD ↗️Buy Signals:
- Bullish Divergence
- Fibonacci Cluster ( matches beginning of div )
Other Signals:
- Greater than average volume breaking above the Cloud ( this would validate a trend change)
Invalidation:
- BB%B: A significant drop below the bullish div trend line
- Cloud: Greater than average volume with drop in price in within or below.
Target Price:
- $38.20
Stop Loss:
- fluid ( * lack of stop loss is not advisable * )
Strategy:
- Dollar Cost Average while price is below $16
Type of Trade:
- Long Swing Trade

Bollinger band squeeze 4H DREP:USDTA classic Bollinger band squeeze forming on the 4H chart. Always different to determine which way the chart will go but multiple BUY signals from the RSI indicator.
TP when RSI crossing 70.
