Bond Bulls Smell Blood: 20-Year Yields Likely to Fall🧩 Fundamental Bear Case for 20-Year Yields
1. Recession Risk and Slowing Growth
Leading economic indicators (e.g., ISM Manufacturing, Conference Board LEI) continue to suggest softening demand across key sectors.
A recession or significant slowdown would drive capital into long-duration Treasuries, causing yields to fall as bond prices rise.
Historically, 20-year yields fall 200–300bps from cycle peaks during recessions. With yields near 5%, there is ample downside room.
2. Federal Reserve Policy Pivot
The Fed’s hiking cycle appears to be at or near its terminal point. Rate cuts in 2025 are increasingly priced in, especially as inflation moderates.
If inflation continues to decelerate toward the Fed’s 2% target while growth slows, the Fed may be forced to ease sooner or more aggressively than expected.
Long-duration bonds, including the 20Y, are highly sensitive to forward rate expectations and would benefit from a dovish pivot.
3. Disinflationary Trends
Core inflation metrics (e.g., Core PCE, Core CPI) are in year-over-year decline.
Key disinflationary forces:
Wage pressures have eased as labor markets normalize.
Housing costs, which lag in CPI data, are projected to fall further.
Supply chain normalization continues post-COVID.
These factors reduce the need for elevated long-term yields, especially with inflation expectations anchored.
4. Supply-Demand Dynamics Favor Treasuries
Despite large Treasury issuance, global demand remains strong:
Foreign buyers (e.g., Japan, EU) seek higher yields as their home rates remain low or negative.
U.S. institutions (pensions, insurance funds) are rebalancing into risk-free long bonds amid equity volatility.
A risk-off rotation or broader de-leveraging cycle would only accelerate this demand.
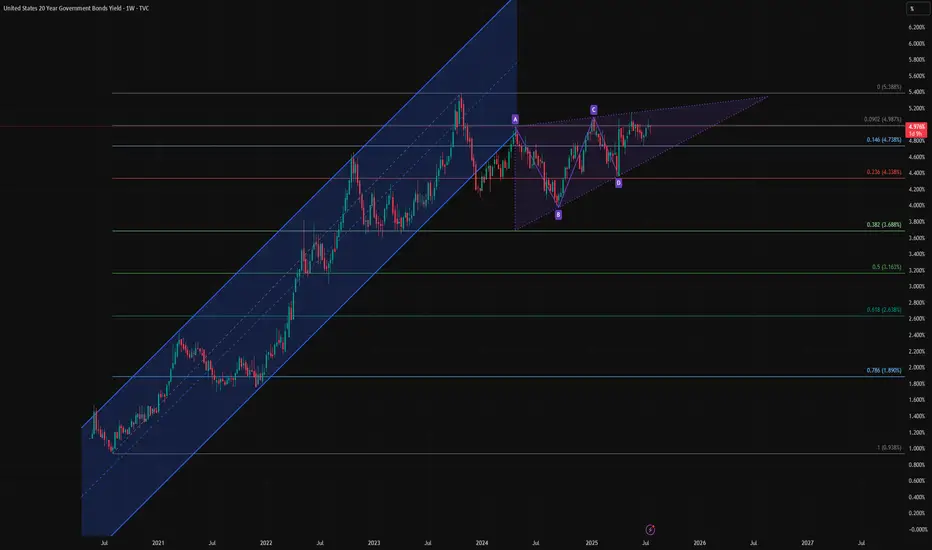
🔍 Technical Summary
Rising wedge pattern is nearing a potential breakdown — a bearish structure signaling exhaustion.
Price is failing to reclaim the previous uptrend channel, now acting as resistance.
A completed harmonic AB=CD pattern near recent highs suggests a mean-reverting move could be imminent.
Closest technical targets include:
4.33% (23.6% Fib)
3.68% (38.2% Fib)
Possibly even 3.16% (50% retracement) over the next 6–12 months if macro weakness persists.
📌 Bottom Line
The combination of:
Cooling inflation
A Fed pivot on the horizon
Rising recession risk
And technical exhaustion signals
Supports a bearish outlook for 20-year yields, meaning bond prices (especially long-duration instruments like TMF or TLT) could appreciate meaningfully from here.
Bonds
Do we continue the wedge…Bonds have been hit hard and Crypto at Ath trend lines, do we need to finish the wedge
US30Y Bullish ideaThis is a potential idea of the 30 year bond yield potentially having movement to the upside. We have already reached into a daily volume imbalance and weekly volume imbalance. We also have a monthly order block that is acting as support combined with our volume imbalance levels. We also have relative strength with the US30Y against the US10Y and US5Y. Could be a potential idea to look for bullish ideas with the the fact that we are in a potential point were we could have a Quarterly shift.
*Targeting
A move to the upside were we have buyside liquidity and the 4H fair value gap.

How Will Uncle Sam Strike Back? – U.S. Treasuries on the Edge📉 How Will Uncle Sam Strike Back? – U.S. Treasuries on the Edge
After covering leveraged loans ( BKLN ), junk bonds ( HYG ), and investment-grade corporates ( LQD ), we now focus on the most important piece of the U.S. credit puzzle: Treasuries.
Specifically, the long end of the curve — tracked by TLT .
📊 What the Chart Shows
Left Panel (3D Chart)
• All-time highs in Feb 2020 at $179.80
• Long-term trendline going back to 2004
• Critical support was broken in 2022 — a structural breakdown
Right Panel (8H Chart)
• Clear descending channel since 2020
• Price has rejected from the channel top multiple times
• Recent bounces off the lower channel suggest a potential final flush
🧠 What Happened in 2022? (can't blame Trump for that...)
This wasn’t politics — it was policy.
• The Fed's fastest hiking cycle in decades
• Liquidity evaporated
• Long-duration bonds were abandoned
• The key trendline that had held for years was finally lost
That line — once support — is now resistance.
📐 My Technical Expectation
I expect one final slide before a reversal.
• Channel base sits at ~$76.32
• My projection targets $71.30 or even $68
• That would mark new all-time lows for TLT
🟡 After that? I expect a macro reversal , targeting:
• 🔼 $101 – mid-channel reversion
• 🔼 $112–115 – former support zone (2019–2022), now resistance
🔍 Macro Context
This chart isn’t just about price.
It reflects how markets are pricing confidence in U.S. debt .
And right now?
That confidence is shaky . With Trump turning 'orange' and taking it out against almost everyone else: China but also his allies(EU, Canada, Japan, etc )
🔄 Recap of the Series So Far:
• BKLN – record leveraged loan outflows
• HYG – junk bonds bounced at historical support
• LQD – investment grade bonds holding steady
• TLT – U.S. Treasuries under pressure, and possibly breaking down
📌 Next up?
🟧 CRYPTOCAP:BTC
Because when the world begins to question Treasuries , the search for alternative stores of value begins.
One Love,
The FXPROFESSOR 💙
ps. wait for the next posts...they might be epic!

[b]No Panic Here – Quality Credit Says Relax[/b]No Panic Here – Quality Credit Says Relax
After watching leveraged loans ( AMEX:BKLN ) and junk bonds ( AMEX:HYG ) take heavy hits, we shift to the quiet giant in the credit space: AMEX:LQD .
What is AMEX:LQD ?
It’s the ETF for investment-grade corporate bonds — meaning bonds issued by highly rated, stable companies.
We’re talking about names like Apple, Johnson & Johnson, Microsoft, JPMorgan, ExxonMobil — the blue-chip elite.
These aren’t the bonds you dump in a panic — they’re the ones you rotate into when credit stress builds.
What’s happening now?
📌 Price just bounced off 103.81 , a key support zone that also held:
• During the 2020 Covid crash
• In the 2022 banking mini-crisis
• Now in 2025 – mid macro uncertainty
From 2003 to 2021, this chart trended upward with pressure on resistance. Since 2022, the pressure flipped — testing support. But structure is still being respected perfectly .
🟢 The ascending channel remains intact
🧱 Support at 103.81 is holding
🔄 No breakdown, no fear — just rotation
Zoomed-in 30m chart shows a clean technical bounce .
If we revisit 100.33, that could be a final test of the base — but unless that breaks, this still looks bullish on a macro timeline.
What it means:
This is not a market panic .
It’s a rotation into quality.
• Junk bonds = sold but found support
• Leveraged loans = stress but not panic, on support
• Investment grade = stable
• ** CRYPTOCAP:BTC 🟧 = crypto wildcard in this macro unwind**
Bottom Line:
LQD is holding up, following the rules, and quietly saying:
"Relax, we've been here before."
One Love,
The FXPROFESSOR 💙

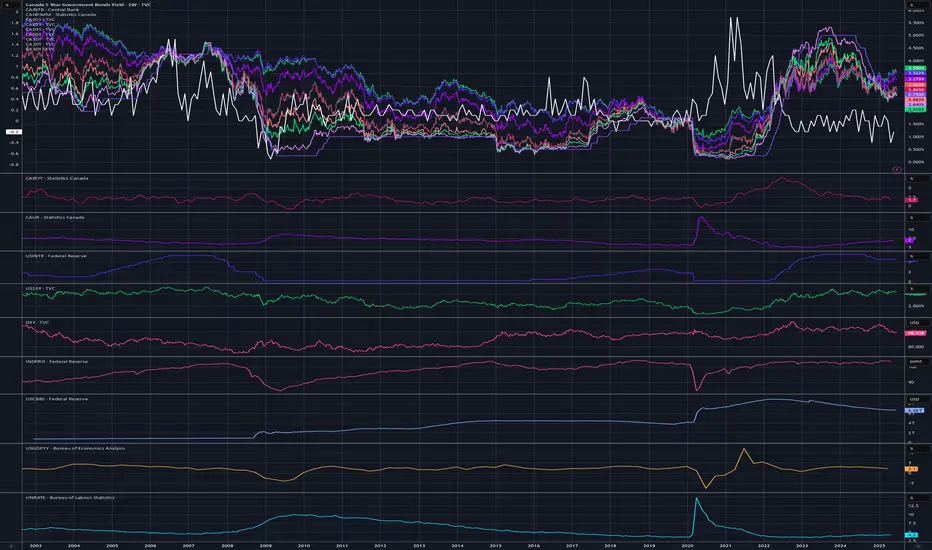
Canada macroeconomicsTreasury bond yields and house price.
Also include unemployment rate and inflation rate YOY
US10Y Big downside potentialThe U.S. Government Bonds 10YR Yield (US10Y) has been since last week on a 1D MA50 (blue trend-line) rebound, consistently rising since the April 04 Low (Support 1). The presence of the Lower Highs trend-line just above it, puts strong selling pressure long-term.
As a result, either now or upon a Lower Highs contact, we expect the US10Y to turn bearish and Target 3.860% (Support 1).
-------------------------------------------------------------------------------
** Please LIKE 👍, FOLLOW ✅, SHARE 🙌 and COMMENT ✍ if you enjoy this idea! Also share your ideas and charts in the comments section below! This is best way to keep it relevant, support us, keep the content here free and allow the idea to reach as many people as possible. **
-------------------------------------------------------------------------------
💸💸💸💸💸💸
👇 👇 👇 👇 👇 👇

Steepening Yields & Uncertainty: What says the Bond Markets?
CBOT:ZN1!
US Yield Curve in Image Above
Showing yields on May 27, 2024 vs May 27, 2025 . What happened in a year and how to understand this?
Looking at the image above, the yield curve was inverted on this day last year. Comparing last year’s term structure to today’s, we can see that the yield curve has steepened sharply.
What does this signify? Let’s dive deeper as we share our insights and assessment of what the bond market is doing.
At the March 16, 2022, meeting, the FED finally pivoted away from their "transitory inflation" narrative to a significant supply shocks narrative—supply-demand imbalances and Russia-Ukraine war-related uncertainty. This started a rate hike cycle, with rates peaking at 5.25%–5.50% in the July 26, 2023, meeting.
The Fed Funds rate was reduced by 100 bps, with a cut of 50 bps on September 18, 2024, and two cuts of 25 bps in the November and December 2024 meetings. The FED paused its rate cutting at the start of the year, citing—as we have all heard recently—that the inflation outlook remains tilted to the upside, and given policy uncertainty and trade tariffs, the risk to slowing growth continues to increase. Businesses are holding back spending due to this confusion and continued uncertainty. ** Refer to the image of FED rate path above.
The start of the rate hike cycle also began the FED’s balance sheet reduction program—from a peak of $8.97 trillion to the current balance of $6.69 trillion. **Refer to the image of FED's balance sheet above.
Rates remained elevated at these levels to bring down inflation, which peaked at 9.1% in June 2022. Inflation has currently eased to 2.3% as of April 2025. Refer to the CPI YoY image above.
Ray Dalio, Jamie Dimon, and most recently non-voter Kashkari (FED) highlighted stagflationary risks. FED Chair Powell noted risks to both sides of its dual mandate in its most recent meeting March 19, 2025.
In the March meeting, they also announced a slower pace of reducing Treasury securities, agency debt, and agency mortgage-backed securities. In this announcement, Treasury securities reduction slowed from $25 billion to $5 billion per month, while maintaining agency debt and agency mortgage-backed securities reduction at the same pace.
Many participants and analysts noted this as a dovish pivot. However, given the current market conditions and the supply-demand imbalance emerging within US Treasury and bond markets, we note the rising yields.
The yield curve steepening signifies that investors want better return on their bond holdings. The interesting turn of events here is that US Treasuries and bonds have not provided the safety they usually do in times of uncertainty and policy risk. The dollar has fallen in tandem with bonds, resulting in a devalued dollar and rising yields. Thirty-year yields touched the 5% level, and the DXY index traded at levels last seen in March 2022.
Looking deeper under the hood, we note that a repeat of COVID-pandemic-style stimulus measures may perhaps result in an uncontrollable inflation spiral. The ballooning twin deficits—i.e., trade and budget deficits—with the new “Big Beautiful Bill,” or as some analysts joked, noting this as a foreshadowing of the newest credit rating: “BBB.”
Any black swan event may just be the catalyst needed to tip these dominoes to start falling.
As we previously noted in some of our commentary, debt service payments are now more than defense spending.
The new bill, once passed, is going to add another $2.5 trillion to the deficit. While the deficit is an issue in the US, it is important to note that it is a global issue.
The key question here will be: in due time, will the US bond market and US dollar regain their usual haven status? Or will we continue seeing diversification into Gold, Bitcoin, and global markets?
So, to summarize these mechanics playing out in the US and global markets—in our view—sure, the US administration, one may debate, is not helping by creating this environment of uncertainty in global trade, coupled with a worsening deficit and higher-for-longer rates. The markets currently are perhaps at their most unpredictable stage, with so much going on in the US and across the world.
It is still too early to write off US exceptionalism, and there will be value in rotating back to US markets once the dust on policy uncertainty settles. We suggest that investors stay diversified, watch for any upside surprises to the inflation and do not chase yields blindly as the move may already be overstretched. It is also our view that we are past the extreme policy uncertainty having already noted Trump put when ES Futures fell over 20%.
Although note that near All-time highs or at 6000 level, we are likely to see further headline risks until trade deals are locked in. As always, be nimble, pragmatic and be ready to adjust with evolving market conditions.
Definitions
Plain-language definition: A “basis point” (bps) is 0.01%. So, a 50 bps cut = 0.50% reduction in interest rates.
Plain-language definition: A steep yield curve means long-term interest rates are much higher than short-term ones. This can reflect rising inflation expectations or increased risk.
A “black swan event”—an unpredictable crisis—could set off a chain reaction if confidence in US finances weakens further.
Trade deficit: Importing more than exports
Budget deficit: Government spending far more than it earns

US Gov Spending to Tax Revenues & Debt to GDPUS government spending is exceeding tax revenues by over 2:1, reaching extreme levels compared to historical norms and worsening rapidly
More alarmingly, unlike past decades, the US government's total debt-to-GDP ratio is also rising sharply with no end in sight, accelerating in the wrong direction.
For this reason, bond investors are currently demanding higher interest rates.
Trump's tariffs, undermining trust in Gov, the economy, and markets, are creating conditions for a global currency crisis coupled with an economic recession or depression.
If you think this information has no impact on your trading/investing, you are making a grave and possibly an expensive mistake.
Click Boost, follow, and subscribe for more. Let's get to 5,000 followers. ))

The break-up (a must-watch chart)One of the most important—and unusual—developments in the market right now is the combination of rising US bond yields and a falling US dollar.
Normally, when bond yields go up, the dollar strengthens. It's similar to a high-interest bank account: if you can earn more by holding US assets, global investors tend to pile in, increasing demand for the dollar.
But that’s not what we’re seeing today.
Instead, yields are rising while the dollar weakens—something that’s more often associated with emerging markets facing debt concerns. It signals a deeper issue: despite higher returns on offer, investors are becoming wary of the underlying fundamentals.
In short, **America’s massive debt load and relentless money printing may be starting to catch up—**even with the world’s reserve currency. And the market is beginning to take notice.
This is important to all asset classes moving forward. Keep your eyes peeled on it.

Indexes Daily "Slow" Trend anticipationExpecting a Daily slowliness a.k.a. HRLR (ICT Concepts) due to the Bonds decorrelation which is bearish. Once Bonds has reached Sell Side Liquidity Target, acceleration will be seen on Indexes higher. Meanwhile "give and take" is expected on a Daily and 4h basis.

VAGX ETF: A Hidden Gem in an Era of Economic UncertaintyIn a world of shifting economic tides, investors are constantly searching for assets that offer both stability and growth potential. The Vanguard Global Aggregate Bond UCITS ETF (VAGX) may be one such opportunity, quietly accumulating strength amid global economic fluctuations.
Understanding VAGX ETF’s Accumulation Phase
VAGX tracks the Bloomberg Global Aggregate Float Adjusted and Scaled (CHF Hedged) index, which includes a diversified mix of corporate and government bonds. Since its inception in September 2021, the ETF has steadily grown, accumulating assets and reinvesting interest income to enhance long-term value. With 8,891 holdings and a low expense ratio of 0.10%, it offers broad exposure to global fixed-income markets.
Macroeconomic Landscape: Tariffs, Inflation, and Interest Rates
The global economy is at a critical juncture, with policy shifts and trade tensions shaping investment strategies. Key factors influencing VAGX’s potential include:
Tariffs & Trade Tensions: Recent tariff escalations have heightened uncertainty, impacting global trade and economic growth. This environment makes bond-based ETFs like VAGX attractive as investors seek stability.
Inflation Trends: Inflation is projected to moderate slightly in 2025, but remains a concern for central banks. Bond ETFs, particularly those with investment-grade holdings, can serve as a hedge against inflationary pressures.
Interest Rate Outlook: The Federal Reserve’s stance on interest rates has been influenced by inflation and trade policies. While rate cuts may be delayed, fixed-income assets like VAGX can provide a reliable store of value in uncertain times.
Why VAGX Could Be a Strong Long-Term Holding
Diversification: Exposure to global bonds mitigates risk compared to single-market investments.
Accumulating Nature: Interest income is reinvested, compounding returns over time.
Hedged Against Currency Fluctuations: CHF hedging reduces volatility from exchange rate movements.
Low Expense Ratio: At 0.10%, it remains cost-efficient for long-term investors.
Final Thoughts
As the global economy navigates inflationary pressures, trade uncertainties, and interest rate shifts, VAGX ETF stands out as a stable, accumulating asset with strong long-term potential. Investors looking for a reliable store of value and gradual appreciation may find this ETF an attractive addition to their portfolios.
SIX:VAGX INDEX:BTCUSD SP:SPX TVC:DXY OANDA:XAUUSD BITSTAMP:BTCUSD $ EURONEXT:N100 SIX:SMI TVC:SXY

apan’s Bond Market Is Flashing Alarms – Carry Trade at Risk?🚨 Japan just witnessed its weakest 20-Year Government Bond auction since 1987, triggering a spike in long-dated yields:
📉 Bid-to-cover ratio at lowest since 2012
📉 Tail (spread between avg. & lowest accepted bid) was massive
📈 40Y JGB yield hit all-time highs
📈 30Y at highest since it was introduced in 1999
📈 20Y at highest level since 2000
This is a BIBLICAL move in the JGB complex.
📌 The implications?
Japan’s carry trade—a pillar of global liquidity—could be under pressure
Global bond markets may reprioritize risk
BoJ is walking a tightrope: intervene now or risk a credit crunch later?

T Bond Futures Quarterly chart targets the LOWSDebt levels are increasing
There is insufficient demand to soak issuance.
Interest rates need to increase.
The value of bonds is expected to decline down to the bear flag target.

US Downgrade, 3-5-10% Pullbacks But Still Bullish on S&PHappy Sunday!!!
US Futures open lower after Friday's close and Moody's downgrade.
Last time this occurred in 2011, the S&P dropped around 10% from the "news."
This is all interesting timing but I'm still liking pullbacks for opportunities to position
bullish in the US indexes (S&P, Nasdaq, Dow)
Because the melt-up continues to run (US/China gap last week and drift higher), I'm trying to stay patient for a pause or pullback
Trump and Bessent are still chirping about Tariffs and a government "detox" so a round of trade war related news may help calm the market's red hot advance post April 7 lows
I'm selling calls on owned positions for income. I'm waiting for more favorable levels to add new positions, but within 3-4% of all time highs for the S&P and Nasdaq I don't think anybody will be surprised to see the all-time highs revisited in the near to medium-term
Let's have a great week - thanks for watching!!!
-Chris Pulver

US10 YR Yield Weekly Chart Analysis: NFAUpdate: May 15, 2025
-As per my last update(April 5, 2025) about the gap between March 24th candle and March 31st candle that any candle body close above that gap will invert that gap from resistance to support and Upside target will be Jan 13, 2025 candle High
- We had a candle body close above that gap and now its acting like support.
-Now i am expecting the bullish trend to continue and long term upside target is Jan 13, 2025 candle High and Short term upside target is April 7, 2025 candle high

US10 YR Yield Weekly Chart Analysis: NFAUS10 YR Yield Weekly Chart Analysis: NFA
-After sweeping the previous swing high we retraced back to 50% Fib(Equilibrium)
-Expecting this Week's candle wick to sweep Sellside Liquidity-1 and bounce
-If we bounce from here, iFVG-W (red rectangle) will be our resistance zone
-Rejection from that level can send it back to sellside and our next target will be BISI-W(green rectangle)
If any of these Support/Resistance levels are invalidated i will update the idea next week.
**Major economic events can cause drastic moves and invalidate these levels**

Bond Yields moving soonSo, we redrew the trendlines a few days ago and this is where the 10Yr currently stands.
Bond Yields should give some sort of direction within the next handful of days. Be ready.
TVC:TNX
Interest Rates

Interest Rates don't seem to want to slow downWe believed that interest rates were going higher in Early April/Late March.
The Bullish Engulfing formation was a sign that higher interest rates were coming TVC:TNX
The 10 Yr Yield Downtrend was broken, it retraced some, we posted that it was likely consolidating, & seems to want to go a little higher.
Central Banks worldwide are lowering rates while the US is raising them.
---
Please see our profile for more info... We do post a lot.

The Bitcoin Trust Flow Cycles Model: What Comes Next (chart)b]📉 The Bitcoin Trust Flow Cycles Model: What Comes Next
Video idea here:
Friends, if you’ve seen my last two posts, you already know — we’re no longer relying on broken halving cycles or outdated narratives.
We’re now in the realm of The Bitcoin Trust Flow Cycles™ by FXPROFESSOR — a framework that maps how trust moves between Bitcoin and traditional assets like U.S. Treasuries .
And today’s update? It might be the most important one yet.
🔁 Quick Recap: What Is This Model?
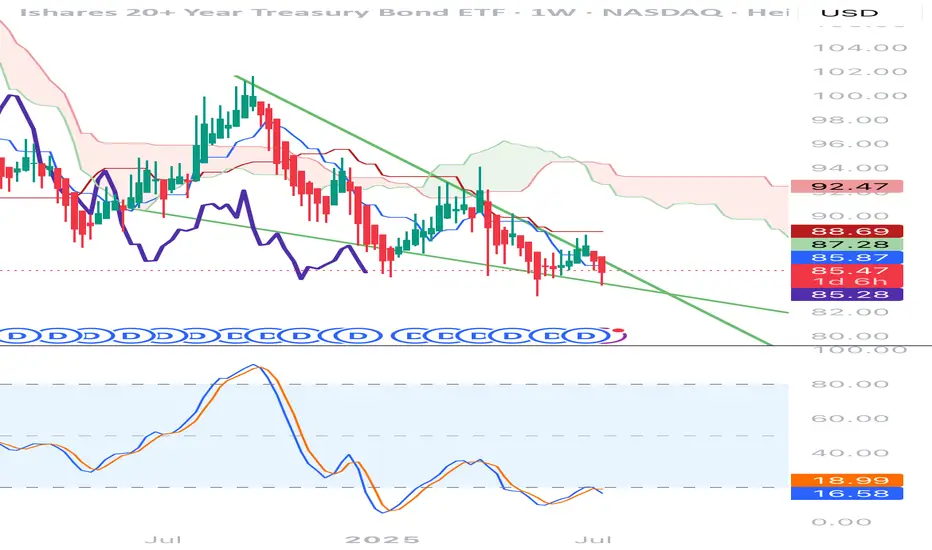
This model tracks Bitcoin’s relationship to long-term U.S. Treasury Bonds (TLT), cycling between:
• Correlated Periods (Blue): BTC and TLT move in the same direction
• Inverted Periods (Green): BTC and TLT move in opposite directions
And here’s the magic:
These flips often occur right at key structural levels in the bond market.
🧠 Where Are We Now?
We’re still in an Inverted Period — the 6th major one.
• TLT (Treasuries) are dropping again
• Bitcoin is rising against that backdrop
• The previous support at ~86.8 failed — we are now sliding toward the next major level
That level?
📌 71.32 – the all-time structural support for TLT going back to 2004
It’s the same zone that sparked Bitcoin’s explosive moves in the past.
📉 My Expectation:
• TLT continues sliding lower
• It finds support around 71–76
• Once that happens, we enter a Reversion Phase — where Bitcoin and TLT rise together again
• Bitcoin doesn’t just “survive” the macro shakeout — it thrives on it
This would be the 6th inversion-to-correlation flip in the model — and historically, these have marked powerful Bitcoin trends.
📊 Why This Model Matters
This isn't just about price.
It’s about trust .
It’s about rotation .
It’s about macro capital flow .
Forget halving hype — this model focuses on how institutional trust migrates between old systems (bonds) and new systems (Bitcoin).
When TLT fails, Bitcoin rises.
When TLT finds support, Bitcoin joins in.
This is not just a macro hedge.
This is the new cycle narrative .
🔍 What to Watch:
• Does TLT drop to 71?
• Do we find a bottom and reverse?
• Does BTC correlate again and break out above 115?
If so — we may be on the cusp of a new correlated bull leg .
This post builds on the foundation I laid here:
📌
📌
This is part 3.
The signal is there.
The rotation is happening.
The trust is shifting.
Are you watching?
One Love,
The FXPROFESSOR 💙

The Bitcoin Trust Flow Cycles Model: What Comes Next📉 The Bitcoin Trust Flow Cycles Model: What Comes Next
Friends, if you’ve seen my last two posts, you already know we’re not talking about your average halving theory anymore. We're entering a new era of Bitcoin cycle analysis — and this model may change the way we look at macro rotation forever.
This is an update to The Bitcoin Trust Flow Cycles™ by FXPROFESSOR — a cyclical framework built around one question:
When trust flows in and out of traditional assets like Treasury bonds... what does Bitcoin do?
In this post, we zoom into the latest data: • TLT is testing key support again • Bitcoin is still rising — but in an inverted period • The next major reversion event may be approaching
I'll walk you through what happens when correlation flips , why these cycles compress over time, and how we could be approaching the next Bitcoin surge — not because of supply, but because of macro trust flow .
If you’ve been wondering what’s really moving the market... this might be the chart you’ve been missing.
One Love,
The FXPROFESSOR 💙

CREDIT CRISISWe are beginning to see evidence of a credit crisis starting. low demand for US bonds can trigger a currency crisis for the USD, higher rates will lead to refinancing company problems (especially with all the zombie companies that should have blown up over a decade ago.) and major economic depression-style job losses.
Currently, we are very early stages but things are moving at lightning speed on a macroeconomic level.
I know this is likely gibberish to most here pon trading view but it is of MASSIVE importance to your trading and investing.
CAUTION IS IN ORDER!!
Click boost, follow, and subscribe! I can help you navigate these crazy times.

The Charts Wall Street Watches – And Why Crypto Should Too📉 Crisis or Rotation? Understanding Bonds Before the Bitcoin Reveal 🔍
Hi everyone 👋
Before we dive into the next major Bitcoin post (the 'Bitcoin Reveal' is coming up, yes!), let's take a moment to unpack something critical most crypto traders overlook — the world of bonds .
Why does this matter? Because the bond market often signals risk... before crypto even reacts.
We're going to walk through 4 charts I've posted recently — not the usual BTC or altcoin setups, but key pieces of the credit puzzle . So here’s a simple breakdown:
1️⃣ BKLN – Leveraged Loans = Floating Risk 🟠
These are loans to risky companies with floating interest rates.
When rates go up and liquidity is flowing, these do well.
But when the economy weakens? They’re often the first to fall.
📌 Key level: $20.31
This level held in COVID (2020), the 2022 bank scare... and now again in 2025.
⚠️ Watch for a breakdown here = real credit stress.
Right now? Concerned, but no panic.
2️⃣ HYG – Junk Bonds = Risk Appetite Tracker 🔴
Junk bonds are fixed-rate debt from companies with poor credit.
They pay high interest — if they survive.
When HYG bounces, it means investors still want risk.
📌 Fear line: 75.72
Held in 2008, 2020 (COVID), and again now.
Price rebounded — suggesting risk appetite is trying to return .
3️⃣ LQD – Investment Grade = Quality Credit 💼
LQD holds bonds from blue-chip companies like Apple, Microsoft, Johnson & Johnson.
These are lower-risk and seen as safer during stress.
📊 Chart still shows an ascending structure since 2003, with recent pressure on support.
📌 Support: 103.81
Holding well. Rebound looks solid.
Unless we break 100, this says: "No panic here."
4️⃣ TLT – U.S. Treasuries = Trust in the Government 🇺🇸
This is the BIG one.
TLT = Long-term U.S. bonds (20+ yrs) = safe haven assets .
But since 2022, that trust has been visibly broken .
A key trendline going back to 2004 was lost — and is now resistance.
📉 Price is in a clear descending channel .
📌 My expectation: One final flush to $76 or even $71–68
…before a potential macro reversal toward $112–115
🔍 The Big Picture – What Are Bonds Telling Us?
| Chart | Risk Level | Signal |
|--------|------------|--------|
| BKLN | High | Credit stress rising, but support holding |
| HYG | High | Risk appetite bouncing at a key level |
| LQD | Medium | Rotation into quality, no panic |
| TLT | Low | Trust in Treasuries fading, support being tested |
If BKLN breaks $20...
If HYG fails to hold 75.72...
If LQD dips under 100...
If TLT falls to all-time lows...
That’s your crisis signal .
Until then — the system is still rotating, not collapsing.
So, Should We Panic? 🧠
Not yet.
But we’re watching closely.
Next: We add Bitcoin to the chart.
Because if the traditional system starts breaking... 🟧 Bitcoin is the alternative.
One Love,
The FXPROFESSOR 💙
📌 Next Post:
BTC vs Treasuries – The Inversion Nobody Saw Coming
Because if the system is shaking… Bitcoin is Plan B.
Stay ready.
