US10Y - Trying to reach 2.80% by SeptemberUS10Y - Trying to reach 2.80% by September 2021.
Goodbye Mr Stock market.
Bondyields

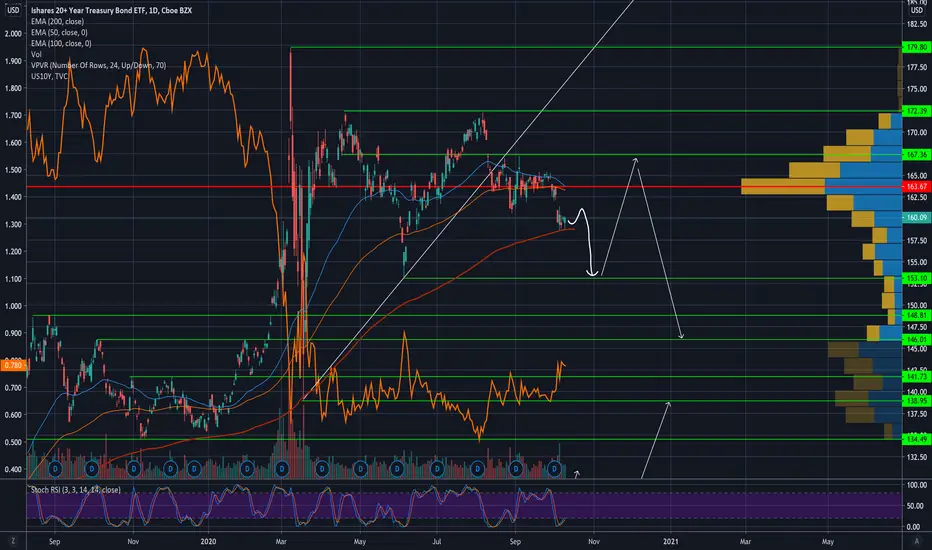
US10Y Testing a symmetrical level. Potential Resistance.One of the hot topics in the market recently has been the rising bond yields. The US Government Bond 10 year yield traded this week inside a Zone that has formerly been (from 2011 to 2019) a long-term Support level as clearly illustrated on the chart.
With the RSI on the 1W time-frame also entering its Resistance Zone (holding since 1996) and the MACD approaching its own, can this mean that the US10Y has topped? It is not impossible that what used to be a Support Zone, will now turn into a Resistance.
What do you think?
** Please support this idea with your likes and comments, it is the best way to keep it relevant and support me. **
--------------------------------------------------------------------------------------------------------
!! Donations via TradingView coins also help me a great deal at posting more free trading content and signals here !!
🎉 👍 Shout-out to TradingShot's 💰 top TradingView Coin donor 💰 this week ==> alanmasters
--------------------------------------------------------------------------------------------------------

Upside continuation? Same formation as before.
Would be nuts if this continues and definitely says something if it indeed continues.
This is happening world wide not just in US.
Let's see if someone steps in on these narrowing trends.
That's all folks

10 Year Treasury yield at resistance levelThe 10 Year Treasury yields have bounced aggressively from all time lows. However, we are not at the August/September 2020 lows which coincides magically (lookup the gold number found everywhere in the Cosmos) with the 38.2% fibo retracement from the highs to the lows. If rates go sideways or correct from here, we're likely going to see a bounce in the Nasdaq which is currently near the 100 DMA bounce level...

$TQQQ Market Correction DDThe market was extremely bloody last night, where we saw $TQQQ trading at highs of $98.07 at one point and subsequently closing at $87.90. I believe this can be attributed to the rising bond yields trend we are currently witnessing, particularly in the 5 year and 10 year treasury yield.
Between the start of February 2021 to February 24th, the 5 year treasury yield has been steadily increasing at an average of 0.01 to 0.03 daily, while the 10 year treasury yield has been increasing at an average of 0.01 to 0.04 daily.
However, yesterday on the 25th of February, this skyrocketed. The 5 year treasury yield shot up by 0.19 from 0.62 to 0.82, while the 10 year treasury yield shot up by 0.16 from 1.38 to 1.54. Typically, when the 5 year treasury yield goes beyond the 0.75% threshold and the 10 year treasury yield goes above the 1.50% threshold, the stock market tend to sell off in reaction to that. This huge one-day surge in yield return as a result of a lack of interest in bonds likely exacerbated the sell-off.
I believe that this correction is extremely healthy in a market where a lot of the valuations are rather high; and this is unlikely the "huge market crash" or the "bubble pop" premonition that many investors are fearful for, especially considering the fact that a huge $1.9 trillion stimulus will be incoming.
However, it will undoubtedly do us good to remain cautious and keep some cash on the side because in the short-term, the hardening of yields will likely lead to some volatility - which means more frequent dips for you to average your positions; but more importantly, eventually, the consequences of printing these money will likely catch up to us in the form of record-level inflation and interest rate rise, possibly killing the bull run - and we need to be prepared for it.
For now, I expect growth from the support zone of this bullish channel back to the $100 to $110 range.
This is not investment advice so please do your own due diligence!
Support this idea with likes and share your thoughts below.

GOLD and BOND yields. Can they rise together?A lot of talk has been done lately regarding Gold's continuous drop and its correlation with the bond yields and rightly so. As the chart below shows, since 2015 in particular the negative (inverse) correlation of Gold (XAUUSD) with bonds (US10Y in particular used in this study) is evident. Every time the bond yields rise, Gold loses value as the two are in direct competition as low risk financial assets. Bonds in particular offer yields, a characteristic that Gold hasn't.
So as the chart above shows, the story hasn't been any different since the COVID pandemic struck the Western World in February 2020. The bonds got sold even lower and while they've been accumulating, Gold was used as a counter-inflation asset and rose aggressively. But since the August peak, we've seen Gold continuously being sold on Lower Highs, while bonds haven been rising and even above their March peak.
So will this correlation hold that will have Gold continue to fall as long as bond yields rise? The answer can be found on their historic multi-year regression, which is shown on the study's main chart.
As you see my focus is on two periods:
* (1) The Resistance break-outs . When Gold broke its 2011 Resistance (at the time All Time High) last July and when it broke above the 1996 Resistance in 2004. Those patterns are fairly similar in the sense that they both initiate a new Bull Cycle for Gold.
* (2) The start of the Quantitative Easing in 2008 to tackle the financial aftermath of the sub-prime mortgage crisis and the start of a series of stimulus to deal with the COVID19 crisis.
(1) As you see on the chart, when Gold broke above the first historic Resistance in 2004, it got immediately rejected back below it, similar to what happened on last July's break-out (and what we currently witness). At the same time, the US10Y has already entered a Channel Up from mid 2003 until mid 2007. This didn't affect Gold's trend, which as it recovered from the initial Resistance rejection, it continued its rise throughout the bond rise. Since the 2020 Resistance break-out has so many similarities with 2004, we may see Gold having a similar long-term bullish trend (a new Bull Cycle) regardless of the rising yields.
(2) That brings us to the comparison between the two "money printing" (or call it monetary easing if you like) periods on the chart. When Quantitative Easing 1 (QE1) was introduced in November 2008, Gold naturally started to rise (after an 8 month drop due to the market meltdown because of the sub-prime crisis) naturally as the market treated it as a counter to the upcoming inflation. At the same time while the yields initally fell, they started to rise (even on a very aggressive tone) in tandem with Gold. The situation brings resemblances to the current times. On March 2020 the first stimulus package was voted to offset the potential consequences (lock-downs) of the COVID-19 pandemic. Gold was again immediately bought as a counter inflation asset while the yields after an initial fall and accumulation phase, the started rising (which is still the case to this date).
The above two key landmarks on Gold's historic price action, show that Gold and bond yields can rise together, in fact in times of monetary shocks such as November 2008 and March 2020, that seems to be the norm.
Does this mean it is only a matter of time before Gold resumes its long-term bullish trend within the currenct Cycle, regardless the fact that the yields may continue to rise. In my opinion yes and the catalyst can be very much be the upcoming vote on the new stimulus package.
But what do you think? Are you expecting Gold and the bond yields to rise together in the coming months?
Feel free to share your work and let me know in the comments section!
Please like, subscribe and share your ideas and charts with the community!
--------------------------------------------------------------------------------------------------------
!! Donations via TradingView coins also help me a great deal at posting more free trading content and signals here !!
🎉 👍 Shout-out to TradingShot's 💰 top TradingView Coin donor 💰 this week ==> Vergnes
--------------------------------------------------------------------------------------------------------

US10Y VS S&P500 Dividend Yield = Market Crash?US10Y = 1.215% (yellow line)
S&P500 = 3955 points (orange line)
S&P500 DY = 1.48%
Personally, I think the catalyst for the next correction in the stock market may come directly from the bond market.
The logic is this: if the bond yield (US10) were to return 1.40% why should I take on more risk by investing in the stock market with a dividend yield of just over 1.40%? As an investor, I would prefer to sell equities and buy some bonds.
Surely the FED will intervene with control of the yield curve in order to avoid a sharp downward acceleration.

Have some markets shown they have already past a mid Jan peak?Some markets seem to have shown that they peaked in mid-January... indicated in their U.S. listed, $USD denominated, ETFs: Russia RSX, Brazil EWZ, India INDA, Thailand THD, Europe EWZ... and also in certain financial markets as indicated by a Commodity Tracking fund DBC, and see also the US Government Bond 5 Year Yield .

This Signal in Bond Yields Will Predict the Next Recession.After one of the most unexpected years, I thought I should take a step back and look at macroeconomics a little bit, at one specific chart that I've been watching. That is the German Government 10-Year Bond Yield (DE10Y). I've been anticipating a signal in that chart that will indicate massive shift in global market trends and will bring us closer to the next imminent recession. That signal is the breaking of the decades-long descending wedge.
The momentum is still bearish, and this week the price got rejected at the upper line of the wedge. If this continues downards, then the economy remains in the same state. Central banks are printing currency at an unprecedented rate, and inflation is showing on commodoties and stocks and everything else. Governments are sinking more into debt, and the best place to put your money remains the stock market. That is until this wedge breaks. Because when it does, the bond yields will accelerate upwards. It will become more costly to borrow money. And the economy will slow down again. But this time, it is slowing down while everyone is extremely leveraged and deep in debt. We want to maximize our profit but we do not want to be caught in that state. That is why I pay attention to this chart and the DXY.
There are many charts that can indicate the same outcome, but I choose to focus on one only that does the job.
Now according to some Fibonacci levels, I predict another touch in October 2021. By then, perhaps the majority of zombie companies will have declared bankruptcy. Is it too soon for that? Will government regulation delay that even further? No idea. Too many factors to watch. So let's keep watching this one key chart.

Bond Update #bondsThis breakout trade out of the December range (rectangle)to the downside to the lows set back in March has been even better then expected but as we approach those lows it is decision time again. Because I have good trade location I am going to hold the short position even if we get an immediate term bounce. I am watching to see if we can hold below 169'00. If we can the downtrend is still intact. How price reacts here at 167'00 will be interesting to watch though because if rates are really going to rise this time, the down move could be strong if we can make it below 167'00. Despite the FED and the economy not fully being open, bond yields are certainty indicating inflation for now.

Time for US BONDS=> Big Banks will Dump Stock Market!hello Millennials,
As we predicted on our youtube channel,
Time for US BONDS just started, Fed manipulation lost power and:
as bonds go UP,
Big Banks and Big Funds
will sell stocks and Buy Bonds, because it is safer than this crazy moment in the market.
So, Stock market incoming Sell pressure.
Good Luck and Good Profit
Moving Water


GBPUSD SHORT (long yields)Both respective colored boxes are the exact same size . Yields up, GBP down. Flows nicely with Brexit negotiations finishing.

US INTEREST RATES - To Go Through The Roof. Here's The Evidence.Using the very latest advances in my AriasWave analysis I bring to you the breakdown of the US Bond Yields AKA INTEREST RATES.
What do you think higher interest rates will do to the global economy? Leave your comments below.
My analysis using the AriasWave methodology is improving at a rapid rate.
Once you learn how to do proper research you will no longer rely on indicators or hunches.
Get ready because things are about to get messy in the debt market.
Please LIKE and FOLLOW to get notification of updates and future posts.

US Government Bond 30 Year Yield Price ActionUS30 yr yield price action
W bullish patterns is being completed , if the price can cross the red line and stay above it for a enough time , then this pattern will work
Properly and it can reach to the green line , which this is not a good news for stocks , because usually the correlation between the stocks and the bond yield is opposite .

BOND YIELDS - 870 Year Zig Zag In Bond Yields Looks CompleteThe Red Wave A Zig Zag since 1150AD looks complete. The (C) Wave was an expanding ending diagonal.
I have clearly marked the impulsive 3 Wave moves (1,3,& 5) and the corrective move (2 & 4)
Down below there is a 1-2 pattern forming which also looks complete, I will touch on that in a separate idea.
Higher Interest Rates Anyone?
Please LIKE and FOLLOW to get notification of updates and future posts.

DOW VS NASDAQ VS 10YR BONDS VS ARIASWAVE - The Final VerdictThe world is changing faster than we can adjust and this is the reason.
In this video I give you the conclusion of years of research finally coming together, just in time.
To understand these markets without AriasWave is like driving in pitch black darkness with no lights on.
Let the show begin.
Please LIKE and FOLLOW to get notification of updates and future posts.

TLTLooking for something like this to unfold heading into elections USA. The orange line is 10 yr Tbonds yields. So they inverse each other. When yields rise so do stocks and exactly the opposite when yields fall.
Thinking a nice long set up on TLT options will be presented very soon maybe end Oct.
10 yrThinking the 10 yr pushes up .95 b4 election and a big stock market push higher.
After that crashes back to .72 for what could be the most volatile election since Bush vs Gore.
Then we end the year back up around 1.3 with Joe Biden winning and markets on a F**king tear

10 yrLooks like bond yields have gone risk on but the stock market hasn't caught onto this quiet yet. Heavy resistance incoming, break .79 and the bulls will party

$EURUSD Weekly Outlook - To Summarize - ShortCoT has the commercial banks shorting the EURUSD still. Yeah, they added a few long positions this weel, but that was to get back to a level they wanted to add more shorts. They/ve been shorting since the height of the Pandemic swing. so for the Central banks to start being profitable, the price will have to be below 1.13500. If you draw a fib from the start of the EURUSD commercial shorts to the height of the commercial shorts, you can see it unfold in the fib extensions where price wants to reach.
I personally like to see a bit of a larger retracement to the green box notated in this chart during the London/NY session before aggressively going short.
Plus theirs divergence in the 10 year bonds between the currencies. As most are going up, the EUR is taking a dip as of recent.
DIVERGENCE IN 10 YEAR BONDS
Strong Bear tendencies this week. It will be London op and NY open to find the best setups to go short.

GBP STILL BULLISHlooking at the chart we have marked out key levels with active Options strike prices supported with high volume and open interest. We plan to observe how price reacts at 1.3300 and 1.2500 levels prior the the expiration of these contracts. In terms of price action , Cable still maintains an upward trajectory in line with non-commercial sentiments and seasonal outlook. UK bond price maybe trending downwards in line with its inverse relationship with the GBPUSD. However, the Brexit fears may invalidate this move if the trend line is broken and prices fall below 1.2500

Inflation-hedged assets in the age of QERich people don't hoard the dollar, neither should you. They put all their money into inflation-hedge assets as dollar continues to depreciates.
Put your money into the good use.
