Bonfire built trends and intersects DOGEFinding true square and natural alignment with Bonfire indicator. Paying close attention to the advanced indicator and current price action, I found some hidden intersections that really matched well with some of my levels on previous charts. To use : Follow the price along each trendline and/or Gann fan. Does the price respect it? Look for wedges that build pressure for big moves up and down. Does the price stop right on the line or drop well below? Posting as neutral because we are at a fork in the road or decision node leaning towards a break upward.
See Part 2 " The Flip Side" HERE
Bonfire

BSV natural trendsGot a 12h signal for BSV so I looked at it for the first time in months. The Gann fans are from DWEB alignment. BSV is also on Robinhood. Just showing what I see here as possible trends to follow or fail. BSV

Ocean trends built from advanced indicator Please see original with indicator on. Ocean looks great at as it seems to have reached balance well below its ATH. Primed for crossing over some historical hurdles (pending BTC). Too much alignment not to share.
SEE THIS VERSION WITH CHANNEL ALIGNED TO FIB

v.Lite Crypto Mkt Excluding BTC trends alignment and crossingsBased on finding true square from current limits, history, and time. If you follow each line and trend with the price, you will find that there is nothing random about the way things align with the price but also how each line intersects at a pivot in price or important level to watch. This is actually a stripped down version I will link to the loaded version below.

Loaded Crypto Mkt Excluding BTC trends alignment and crossingsBased on finding true square from current limits, history, and time. I am leaving all lines and drawings on this one because there is some really good data to build on. If you follow each line and trend with the price, you will find that there is nothing random about the way things align with the price but also how each line intersects at a pivot in price or important level. I will post a stripped down version and link it to this one soon.

1 week - 3 frame Fib tangent curves.Used my new Auto Fib indicator to find center pivot high . After scaling to square, I drew curves from major bottoms to ring tangents and pivot high intersects. The indicator is turned off in the charts.

Symmetry based trends with sine. Using a hybrid drawing/indicator method to find center, mean, and tangents. From there, I found some interesting alignments and sine that capture the price repeatedly. Follow the price and use this as a tool to confirm your own interpretation. See how the price respects/crosses over/ breaks down as in interacts with the trends, vertical pivot lines, sine lines and levels. I'm big on balance and natural movement so these charts are great foundations for finding possible future price coordinates. Looks like a chance to climb to another ATH still remains but real volume and orders will be the deciding factor before the next major pivot is due.

Bonfire Fib built 45 trends and intersects BTCUSDPlease see chart with indicator turned on below:
Found alignment and center using 144 days. From there, I used common intersection from square to dissect symmetrical trends and grids that should capture future price action. Follow the price along each line for confluence. Does the price respect the trend, breakup, or breakdown. Pay attention to your indicators and volume as the price approached these trends , levels and pivots. This chart has some good pattern data if you like reading into that.

Long term levels BTC log scale - Squared intersections Upon publishing the scale will be different: Use the scale on the right side to slide the drawings to align with price. See below for original.
Testing Bonfire indicator to square a log scale chart to current price action. Natural alignment,tangents, and intersections used to build target levels, trends and possible pivots (look for line junctions). These levels could hit years from now but I would be willing to bet they are going to be great to find major support and resistance later on.

Simple price vs time squareSquared using Bonfire and traced the boxes. If you want a great exercise, use this chart as a base for geocharting. The corners are great for starting points on Fib rings as well as Gann and drawing shapes to find common intersections .

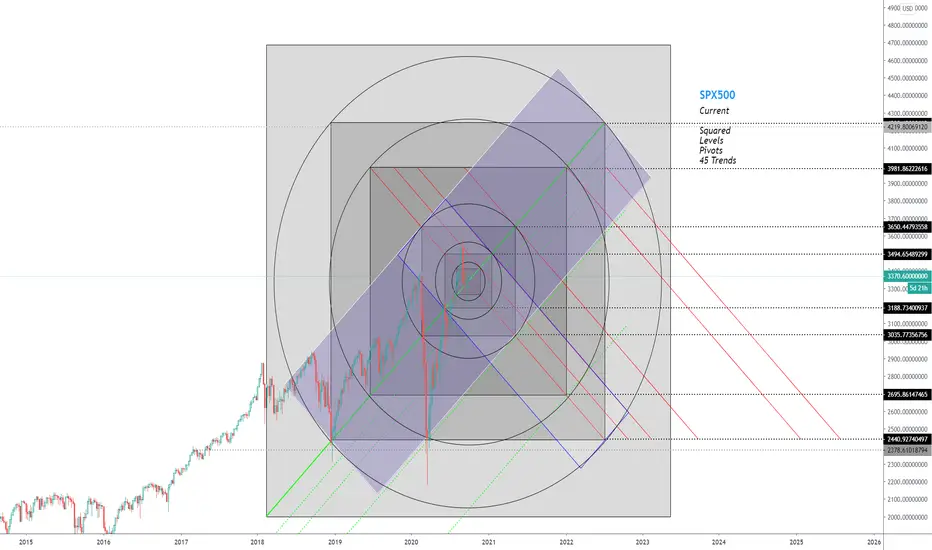
Per Request - SPX500 Squared Trends Pivots and Levels Using Bonfire indicator, I built this chart by request. Finding the square of an asset can really open things up from a visual standpoint. This allows users to bypass scaling variables and helps with finding natural movement, trends , levels and pivots. I often use these charts for confluence along with other indicators to help predict price action vs time. Watch how the price respects, follows, or fails at each line.
Square Pitchfork ideaSquared price to 45 degrees and used inside pitchforks from corner to corner. This should give some nice trends to follow, maybe some action at or before each junction. Original below.

Box Trends short term chart for BTCKeeping it as simple as I can here. These box trends were drawn from True Price Square, which is something I have come to rely on greatly. 4 rotated rectangles from each corner of Bonfire indicator,width set at tangents to local price (center boxes). See update for original picture. I am sparing the added lines to mark pivots and levels from the indicator and intersections. These can be added to your chart how you see fit.

Squared Trends To WatchUsing Bonfire to find local square, I made a tool for confluence. These are very handy to have and ,amy times very accurate to find natural price action and predict pivots, and trends moving forward.
This is a smaller timeframe than most of my Bonfire charts so please reference previous charts for big picture.

Sine vs time vs BTC IntersectsRace against time to fill liquidity gaps. Built from a Bonfire TA sine algo - see below for original . Found some very nice intersects

DGB DigiByte Bonfire Squared Gann Another Bonfire Squared chart with some Gann trends and trinity built from hidden intersect that aligns well

My charts are too crazy !!!I know they are "chart cancer" to some people. Trust me... I know this... so you can move on if you feel that way. For those of you that power through my charts or follow me, you know I am big on using multiple concepts at the same time to bring confluence. I use my own charts for this instead of asking people and/or waiting for signals provided by others. My thought is : there is no such thing as having too much data available. I also repeat the fact that there is useful data in just about anything right or wrong. The chart you are looking at is from Feb 23, 2019 when BTC was in the bottom range. You can hit play on the link below the full version play out. You don't have to love the way a chart looks to use it. Tradingview has a great feature to replay your data from any point of time. I use often , only sharing a small percentage of my charts because I know they look like a mess to people wanting a simple read. I understand why they would want that. I want that too but this is the only way to cram as much data onto a chart at one time. As you can see, you can always take away drawings but you cant go back and get the same view on an asset that at that very moment. Having the price respect the lines only builds more trust and pattern understanding so why not make your own charts full of data ? I prefer making money over optics apparently. For those of you that stick around , thank you for your time and attention. I hope to make the process of reading my charts easier in the future.

Auto Fib indicator built precision z axis See image with Auto Fib turned on.
Using Bonfire Auto Fibonacci indicator to align price action from the local "pivot high center" . Next I used theses points to run tangent rings (top and bottom) to create another dimension of levels. This indicator will be available soon please DM to get on the list for PAY FOR ACCESS .

DGB DigiByte Bonfire Squared with hidden prediction indicators Complicated at first but over time it becomes easy to read. Along with the squaring feature Bonfire indicators give advanced data and patterns to reduce risk in trades.

DGB DigiByte Bonfire Squared plus fundamental reasoning! I'm Bullish DGB till the end (long term). DGB is fighting hard to stay above the 45 mean (square). I'll be watching these levels and pivots closely in the future. Breaking and staying above the 45 line will be very telling. This chart shows many failsafe options depending on your risk limits. As I mentioned, I am very bullish long term for DGB but will take advantage of any and all obvious "oversold/ overbought" opportunities with a percentage of my bag.
CONCEPT : After squaring (45 degrees) the price to my objective interval, drawing horizontals (levels) to touch the bottom and top of each square has been a huge advantage for me the past year or so. The probability of pivots near or on the vertical sides of boxes should be on the winning side if you read the chart pattern correctly
Price action and volume is showing us a new Digibyte than we have seen in the past. Sustaining pumps and rebounds quicker than before. This is why it is important to watch the current health of DGB when its on the (45) line like this. Big moves by Bitcoin have not altered its trajectory as much as other coins. That to me is a sign of strength. From a fundamental standpoint, at .03 USD it's easy to see why many are catching on to this coin with all of it's truly decentralized features, amazing apps/wallets, blazing speed, and security. It's also a popular coin for mining which is a big criteria for me right now. Being truly decentralized is the OG antibank idea.

Bonfire built trends and intersects BTCUSDSame method using Bonfire to square but added symmetry and geometry to show possible trends, levels, and pivots in the future. This is a method to consider and a tool for confluence.

ETHUSD 9D Bonfire Square. Long Term 45 tool Will be checking back with this one to update and check for confirmation.

Ellipse Tangent to Bonfire SquareBuilt using Bonfire for squaring price to 45 then connected ellipses to each corner of the squares. Simple but it should produce some good data later on.
