DGB scalled majo Trends built using BonfireTA Squaring Gann Fib DGB scalled majo Trends built using BonfireTA Squaring Gann Fib. Using Binfir Squaring TA and indicators to find true sqaure for timeframe. Tangent Fib with Gann inputs inside. I will most likely add to this later on and us it for major jevels and curved pivots.
Bonfire
Bonfire built trends and intersects BTCUSDPlease see original here. Follow price along trends as it respects and or fails them. Also there are lots of pivots that can be marked with vertical lines on major intersections in advance (near, above, and below the price )

Bonfire built trends and intersects BTCUSDOriginal Bonfire chart. I use this method and/or have a Bonfire chart open 24/7 and nearly every major trade. There are many levels of use for this indicator but I can assure you that with practice, you can create a prediction tool that works for you. This is the best way to find true square and price sync / counter predictions and pivots in advance . See the original chart below with Bonfire turned on. If you are interested in access in using Bonfire the cost is $50.00 per year via BTC, ETH, or DGB (Digibyte).

BTC Tangent Midline UPDATE
Per request, this is an update on the original tangent / midline chart published in November 2019 . See the chart attached for concept built off Bonfire Sine Time

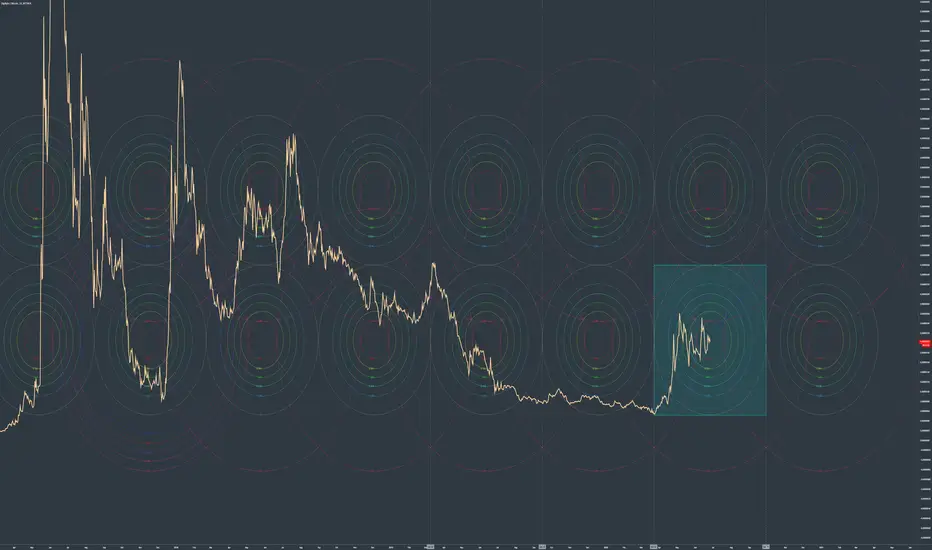
Update : Boxtrends found with Vibration and Bonfire indicatorsPart 2
Extended box trends and added intersects to this very simple yet accurate chart. See original below " Link to Related Ideas"

Ratio Trends built using BonfireTA Squaring
Chart showing true square and Schiff pivots that I built from Bonfire method.

8D BTCUSD BOXTRENDSBuilt using Bonfire.. This is a simple concept but one I feel will add value later on down the line

Bonfire built trends and intersects BTCUSDFairly simple box trend outlining some parallels and nice intersects that may provide data for levels and pivots.

Bonfire built trends and intersects BTCUSDBuilt from Bonfire squaring . This is going to fun to watch. See how it started below. Finding square 1st then building intersects to capture price and build symmetrical trends.


BonfireTA symmetry and aligned intersects on Bitcoin BTCThe chart you see was created with Bonfire Vibration and Bonfire Geo for a hybrid chart using a mixture of Gann, geometry,and indicators. All of the lines on this chart are deliberate and very natural. The system I have created is very accurate for finding curved and linear trends as well as S&R levels.

Bonfire built trends and intersects BTCUSDThis may not be the popular idea and I know you may not understand my lines on lines but I'm gonna post this as a concept I use to try and stay ahead (while I'm catching up from vacation). Furthermore, I think there's still slight a chance for a lower low if we keep getting these premature huge spikes. The last one was on time but overactive. I'm not wanting BTC to go down because I have a have a good amount but I like to be prepared for what can happen. Overall, if it can somehow stay near this level for a week or more there is some bullish lift ahead with some quick volatility dips and pumps 12k being maxed out bullish level. That last pump was supposed to happen it when it did however get out of hand a bit aka overbought. This is fine if you account for it and slowly close out BUT without a ton of REAL takers here (9800 to 10k) the price will go on sale again. I've seen it many many times and orders are balanced in arrear , along a moving median that is needed to fill voids in order books (liquidity gaps). Dates are legit many times but getting the y coordinate is not as predictable unless you know what areas have gaps that need to be filled. Attempts will be made at each level unitil balance is achieved. A lower low would be 5800 to 5900 and extreme oversold would be 4800 to 5000 (absolute worst case). 3/1/20, 3/18/20 dates to watch.
See similar ideas below along with the original view of this chart with indicators turned on.
Follow me on Twitter or message me with your telegram ID for an invite to a broadcast channel.

Triangle trends with intersects Hybrid chart using geo and Bonfire indicators as finders. Reference Bonfire "finder" section in book.


Bonfire built trends and intersects BTCUSDLook at all the symmetry and alignment here. Showing decision nodes along the way to bigger pivot around 17th -18th. There is a data pattern here if you know what to look for.
Image of chart before publishing. Often the scale gets thrown off

Likely GreenHidden pattern shows likely green candles or highs compared to previous candle. I expect some curve balls but this could be a useful data pattern short term

Backtest BTC - Bonfire Adaptive Vibration and live pivotsThis is crazy! Watch video and see how I mark just some of the pivots that were given in advance and "on the fly" . Using replay (med/fast mode) I was able to capture some nice pivots. Because the indicator adapts, I was only able to zero in on some of the bigger swings but the data is there to predict small ones in real time.

MTLBTC Bonfire trends and pivots This was mentioned to me so I checked it and and built some trends based off Bonfire indicators and after squaring price to time. Original view here
BINANCE:MTLBTC
COINBASE:BTCUSD

MTH USD on Bonfire
Pre-published View
The same box trends and pivots using Bonfire and Gann. Follow price along these trends and pivots. The price and lines are squared true. This is a short term outlook but the S&R levels should hold for a while.

Bonfire Vibration on BTC is like having a Crystal Ball This is a final test for the script and I have to say its pretty incredible. Bonfire Vibration adapts to forecast big movement, pivots, trends, levels of support /resistance and intuitive Bonfire MA's. Publishing the chart will not show this adaptation as indicators are locked.
Great for confluence along with Bonfire and/or your TA to confirm price action.
Using the advanced indicators to build trend lines, geometric charts, and Gann can help you customize a trading strategy.
Adding additional indicators makes the possibilities endless

45m BTC Bonfire ChartBTC currently tracking good at the 45m interval and showing a pattern to watch closely. Marked some possible pivots with arrows pointing to SN(brown) trends countering price


Box Trends, Bonfire and Channels update on BTC Capturing min/max trend and condensing them down to find price action as it widdles to a fine point .
