BONK: Time to BounceBONK has seen a 75% retracement to the downside since November and is currently holding at support. I would expect a bounce to the upper trend line. A clean break of the trend line would cause a huge move to the upside. Keep an eye at these levels.
Bonk

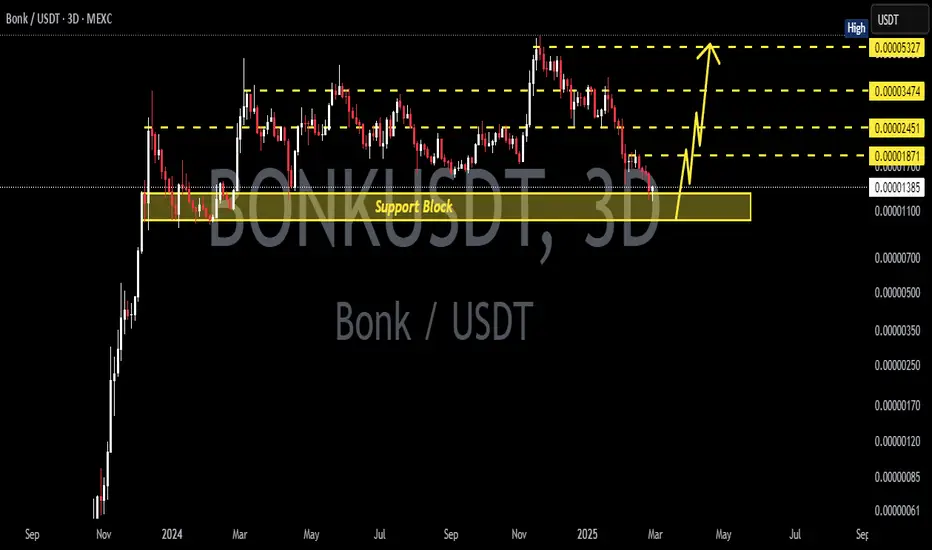
BONKUSDT 3DBONK ~ 3D Analysis
#BONK Buy gradually from here if you still have a Conviction on this coin.
Reason, This support block is still maintained.
1000BONKUSDT: Ready for a Breakout?
🔥 **1000BONKUSDT.P** has been consolidating under resistance for a long time, accumulating liquidity. The price has tested **0.017630 USDT** multiple times, and whales are clearly building positions. The question is: will we see a breakout, or will there be another dip before the pump?
---
🔑 **Key Levels:**
**Support:**
**0.017630 USDT** — Major demand zone. A breakdown below this level could trigger further declines.
**0.016800 USDT** — Last defense for bulls to maintain the uptrend.
**Resistance:**
**0.018481 USDT** — Initial liquidity zone, where a local rejection may occur.
**0.019000 USDT** — Key level that, if broken, opens the way to 0.020 USDT.
**0.024379 USDT** — Ultimate target where large players might start taking profits.
---
🚀 **Trading Strategy:**
**Entry Points:**
- Long upon breakout of **0.018481 USDT**, confirmed by volume increase.
- Alternative entry on a retest of **0.017630 USDT**, provided support volumes increase.
**Stop-Loss:**
- Below **0.016800 USDT** to avoid liquidity grabs before the potential move up.
**Take-Profit Targets:**
**0.019000 USDT** — Partial profit-taking, securing position.
**0.020000 USDT** — Major target if momentum follows through.
**0.024379 USDT** — Ideal scenario if a strong impulse move occurs.
---
📈 **Market Analysis:**
Price has been consolidating near resistance, suggesting an impending breakout.
Large orders in the order book indicate whale activity.
Volume is starting to pick up, signaling a potential phase transition.
---
💡 **Conclusion:**
1000BONKUSDT.P is at a decisive moment. A confirmed breakout above **0.018481 USDT** could lead to a strong bullish move. However, if another fakeout and dump happen, it's time to reassess. What’s your take—ready for the pump? 🚀💬

BONK vs DOGE! Both are gone!Gone means not completely, but loooks like they both retest thier lows completely once more, bearish stances again!

Bonk Support targetBonksi is falling down. The support is on the cross. There is a chance it will consolidate at the rising wedge on the weekly chart, Will buy some here.

Bonk Back at Support: Time to Buy or Wait...?Currently, the BONK coin is testing an important support level after a downward trend. If you are considering buying it, it's advisable to wait until it breaks above the downtrend line. This would provide two confirmations: the support level and the breakout from the trendline. Please be cautious with your decision, as it is a meme coin and can be highly volatile.

BONK/USDT: BIG MOVE Incoming (stay tuned)BONK/USDT: 24-Hour Market Sentiment and Trade Analysis
I spend time researching and finding the best entries and setups, so make sure to boost and follow for more.
Market Overview (Current Price $0.00003269):
- BONK/USDT is trading above the entry price of $0.00002295, awaiting entry as it retraces from recent highs.
- The token is riding on speculative interest, fuelled by increased activity in meme and low-cap altcoins.
Technical Overview:
- Support Levels: $0.00002295 (Entry), $0.00001135 (Stop-Loss)
- Resistance Levels: $0.00006132 (TP1), $0.00013343 (TP2)
- Indicators: MACD shows decreasing bullish momentum as the price consolidates, while RSI is in a neutral zone, leaving room for further moves.
Fundamental Catalysts:
- Community Sentiment: BONK is gaining traction as a meme coin, with a vibrant social media presence driving speculative interest.
- Liquidity: Trading volumes remain elevated, providing opportunities for significant price movement once the entry is triggered.
- Market Context: Broader crypto market sentiment remains positive, favouring meme tokens and low-cap projects like BONK.
Scenario Planning:
- Bullish Scenario: If BONK reclaims momentum, it could trigger entry at $0.00002295 and move toward TP1 ($0.00006132) and TP2 ($0.00013343) over time.
- **Risk Scenario:** A breakdown below key support levels or broader market corrections could lead to a stop-out at $0.00001135.
Trade Setup:
- Entry Price: $0.00002295 (Awaiting Entry)
- Stop-Loss: $0.00001135
- Take-Profit Targets:
- TP1: $0.00006132
- TP2: $0.00013343
When the Market’s Call, We Stand Tall. Bull or Bear, We’ll Brave It All!
**Disclaimer:**
This analysis is for informational purposes only and does not constitute financial advice. Traders should conduct their own due diligence before making investment decisions.

$BONK: Hold or Fall? Potential 3x from Here!Decided to bid this area one more time on BINANCE:BONKUSDT :
The lows need to hold, or it’s an easy path down to 0.00002150 or lower.
It needs to break the current swing highs to at least flip the downtrend.
Just placing a bet here, expecting the following to happen. Will add significantly once the MSB occurs at the swing high.
It’s a good level, and I still believe CRYPTOCAP:SOL holds above 170. Don’t think twice, it’s simple.


BONKUSDT: Double Bottom Reversal or Breakdown Ahead?Yello, Paradisers! Are you watching BONKUSDT right now? Because what happens next at this critical support zone could either set up a massive bullish reversal or bring another wave of panic selling that traps impatient buyers. Let’s break down why this setup demands your full attention.
💎Right now, BONKUSDT is showing a healthy retracement after its recent moves, and the formation of a descending channel suggests a possible double bottom pattern could be in play. But here’s the catch — for this bullish scenario to play out, we need to see confirmation on the lower timeframes. Here’s what we’re watching closely:
💎If BONKUSDT gives us a bullish I-CHoCH (Internal Change of Character) on the lower timeframes within the current support zone, it will significantly increase the chances of a bullish breakout from this descending channel. This would be the first signal that buyers are stepping back in and preparing for a reversal.
💎However, if we see further retracement or even panic selling, don’t worry just yet. There’s a strong support zone below, where we can expect another potential bounce. But once again, we need bullish confirmation through an I-CHoCH in the lower timeframes to increase our probability of success. Without that confirmation, it’s best to stay cautious.
💎If BONKUSDT breaks down and closes a candle below the strong support zone, then our entire bullish idea gets invalidated. In this scenario, it’s better to stand aside and wait for a more reliable structure to form. No need to force trades — discipline beats FOMO every time.
💎It all comes down to patience and waiting for the right signals to line up. The lower timeframes hold the key, and as always, we must follow the price action, not get caught in emotions.
Stay focused, Paradisers. Let the market show you the way — it’s all about timing and strategy.
MyCryptoParadise
iFeel the success🌴

#BONK/USDT Ready to go higher#BONK
The price is moving in a descending channel on a 1-day frame and sticking to it well
We have a bounce from the lower limit of the descending channel, this support is at 0.00002500
We have a downtrend on the RSI indicator that is about to be broken, which supports the rise
We have a trend to stabilize above the moving average 100
Entry price 0.00003350
First target 0.00003500
Second target 0.00004186
Third target 0.00004854

BONK support and resistance levels to watchDaily BONK chart (right chart) showing resistance levels on way up and support trendline below.
Weekly chart (left chart) also shows levels to watch.
Targets are green horizontal line (left chart) then blue horizontal line (right chart) and then red trendline (right chart).
Don't forget to smash that rocket like button!

$BONK consolidation is ending. Ready to pump again.SEED_DONKEYDAN_MARKET_CAP:BONK experienced a significant pump in November 2024 and has been consolidating since.
It touched my refill zone at 0.00002500 and bounced from there. However, its MACD and RSI were showing signs of a significant bearish divergence.
The correction appears to have bottomed out, with a MACD crossover on the 1D chart. This could indicate the potential for another upward pump.
The green lines on my chart mark the possible resistance/support levels.
DYOR!

BONK/USDT: Channel Breakout Signals Potential Wave Rally
1. Price Action
- The asset is currently trading at 0.00003017 USDT
- Clear descending channel formation (marked by yellow lines) from early January to mid-January 2025
- Recent breakout attempt from the upper boundary of the descending channel
2. Trend Analysis
- Overall downtrend since early January
- Formation of higher lows in recent trading sessions
- Possible trend reversal signal with the channel breakout
Here's a concise analysis of the BONK/USDT 4H chart:
Technical Setup:
- Price breaking out of descending channel (yellow lines)
- Current price: 0.00003017 USDT
- Clear bottom formation with higher lows
Potential Targets:
1. 0.000035
2. 0.000040
3. 0.000045
Key Levels:
- Support: 0.000025
- Breakout: 0.000030
- Stop Loss: Below 0.000024
Trend shows bullish reversal potential with a projected upward wave pattern. Watch volume for confirmation.
Risk Management Note:
Always use proper position sizing and consider the volatile nature of this asset. The projected path (green waves) represents a possible scenario but markets can behave unpredictably.

Identify Memecoin scams complete guide🔸Learn to identify memecoin scams effectively by recognizing red flags, using essential tools, and understanding various scams like airdrop scams, honeypots, and MeV attacks. The video offers insights from an experienced trader and provides access to a master list of meme coin trading tools for safer trading practices.
🔸Crypto scams are rampant, especially targeting traders unfamiliar with red flags. Knowing these scams can save you from losing your hard-earned money in the meme coin market.
🔸Airdrop scams are common, where scammers send fake tokens to wallets. Interacting with these tokens can lead to a complete drain of your wallet.
🔸Avoiding certain wallets for meme coin trading is crucial. Fantom, while popular, may expose traders to more risks compared to faster and more secure alternatives.
🔸Identifying scams in the cryptocurrency market requires vigilance on token activity and chart patterns. Recognizing indicators such as rug pulls and honeypots can protect investors from losses.
🔸Rug pulls often manifest through sudden price spikes with no selling activity, indicating potential manipulation by developers. This pattern serves as a red flag for investors.
🔸Honeypots are tokens that allow buying but prevent selling, trapping investors. Understanding this concept is crucial for avoiding scams.
🔸Verifying the legitimacy of a token involves checking for duplicate tokens and ensuring liquidity is locked. These steps help ascertain the safety of investments.
🔸Analyzing social media presence is crucial for determining a developer's reliability. Active communication and transparency on platforms like Twitter can indicate a legitimate project.
🔸Using bots to check the history of Twitter accounts can expose recycled profiles often associated with scams. This method enhances the security of investment choices in crypto.
🔸Community takeovers often occur after a developer rugs, allowing the community to reclaim control and potentially revitalize the project. This can lead to a more decentralized management.
🔸Verifying the authenticity of a project's website is crucial. Scammers may create fake sites, so utilizing domain age checkers helps to ensure the legitimacy of the information.
🔸Understanding the dynamics of token holders is crucial in the crypto market. Analyzing the behavior of bundle snipers can reveal potential risks associated with token investments.
🔸Analyzing token holders and their activities can help identify potential red flags. Tools like trench radar scanner assist in monitoring bundle activities and assessing risks.
🔸Visualizing bundle data can enhance decision-making in token investments. Understanding the distribution of holdings among wallets helps assess the stability of a token.

Becoming a Meme Coin Millionaire in 2025 Guide
▪️Becoming a millionaire through trading Solana-based meme coins in 2025 is a high-risk and speculative endeavor that requires careful planning, research, and disciplined execution. Here's a guide to help you navigate this volatile but potentially lucrative market:
1. Understand the Meme Coin Market
Meme coins are cryptocurrencies that derive value largely from community enthusiasm, social media trends, and memes rather than intrinsic utility.
▪️Key Characteristics:
-High volatility and speculative value.
-Often community-driven and influenced by social media hype.
-Short-term opportunities with rapid price fluctuations.
-Popular Solana-Based Meme Coins:
Keep track of emerging and trending meme coins in the Solana ecosystem.
Join Solana communities on platforms like Twitter, Reddit, and Discord to stay updated.
2. Start with Research
Thorough research is critical before investing in any meme coin.
▪️Analyze the Project:
-Tokenomics: Look at the coin's supply, distribution, and burn mechanisms.
-Community Strength: Check the activity and size of the project's community.
-Development Team: Identify whether the project has a credible team or is purely community-driven.
Market Trends:
Track Solana ecosystem developments and meme coin trends.
Use tools like CoinMarketCap and CoinGecko to monitor meme coin performance.
3. Develop a Strategy
A clear strategy can protect you from emotional decision-making.
▪️Set Financial Goals:
-Decide how much you want to invest and your profit targets.
-Be prepared to lose the amount you invest, as meme coins are highly speculative.
Risk Management:
-Diversify your investments across multiple meme coins and other crypto assets.
-Allocate only a small percentage of your portfolio to meme coins.
Exit Strategy:
Decide in advance when to sell—whether at a specific profit percentage or when a coin reaches a particular price.
4. Master Timing
Timing is critical in meme coin trading due to their speculative nature.
▪️Watch for Early Opportunities:
-Participate in pre-sales or initial DEX offerings (IDOs) for meme coins in the Solana ecosystem.
-Use platforms like Solana's Raydium or Serum for early access to new coins.
Leverage Social Media Trends:
-Monitor social media platforms and influencers who often drive meme coin popularity.
-Stay alert for trending hashtags, memes, or community events.
Take Advantage of Volatility:
Be ready to buy low during market dips and sell high during hype cycles.
5. Use the Right Tools
Tools and resources can help you stay informed and make better trading decisions.
▪️Trading Platforms:
-Use decentralized exchanges (DEXs) like Raydium or Orca for Solana-based tokens.
-Use Solscan or other Solana block explorers to verify transactions.
Analytics Tools:
Track price movements with crypto analytics platforms.
Use bots or automated trading tools to take advantage of rapid price changes.
6. Stay Disciplined
Discipline is crucial to survive the meme coin market.
Avoid FOMO:
Fear of missing out (FOMO) often leads to poor decisions. Stick to your strategy.
Resist Emotional Trading:
Avoid panic selling during dips or overbuying during hype peaks.
Reassess Regularly:
Periodically evaluate your portfolio and adjust based on performance and market conditions.
7. Be Aware of Risks
The meme coin market is highly speculative, and there are significant risks.
▪️Scams and Rug Pulls:
-Beware of projects with anonymous teams or no clear use case.
-Verify contracts and audit reports, if available.
Market Volatility:
-Prices can plummet as quickly as they rise.
-Only invest what you can afford to lose.
Regulatory Risks:
Monitor potential regulations that could affect meme coins or the broader crypto market.
8. Cultivate Long-Term Wealth Building
While meme coins might offer quick gains, consider diversifying into more stable assets to build long-term wealth.
▪️Invest in Solana Ecosystem Projects:
Solana-based DeFi, NFTs, and other utility-driven projects could provide steadier returns.
Stake SOL or Meme Coins:
Earn passive income through staking or liquidity provision.
Reinvest Profits Wisely:
Use meme coin profits to invest in more stable crypto assets or traditional investments.
▪️Conclusion
Becoming a Solana meme coin millionaire in 2025 requires research, timing, and a strong risk management strategy. While meme coins offer exciting opportunities, they are highly speculative and risky. Balance your enthusiasm with caution, and focus on building a sustainable approach to crypto trading.

The Best Level to BUY/HOLD MYRO 600% gains🔸Hello guys, today let's review daily price chart for MYRO. Noteworthy compression in progress right now, bullish 3 drives pattern pending completion in January 2025.
🔸Three drives defined by subsequent lows at 12 cents, 6 cents, final low incoming at 3 cents, get ready to BUY LOW for massive gains in the next 4-8 weeks.
🔸Recommended strategy bulls: bullish structure and compression in progress. Accumulate near 3-4 cents, TP bulls is +600% gains, final exit at 24/25 cents. good luck traders!
🎁Please hit the like button and
🎁Leave a comment to support our team!
RISK DISCLAIMER:
Trading Futures , Forex, CFDs and Stocks involves a risk of loss.
Please consider carefully if such trading is appropriate for you.
Past performance is not indicative of future results.
Always limit your leverage and use tight stop loss.

#BONK/USDT Ready to go higher#BONK
The price is moving in a descending channel on the 1-hour frame and sticking to it well
We have a bounce from the lower limit of the descending channel, this support is at 0.00002974
We have a downtrend on the RSI indicator that is about to break, which supports the rise
We have a trend to stabilize above the moving average 100
Entry price 0.00003107
First target 0.00003278
Second target 0.00003437
Third target 0.00003618

BonkFirst support 0.00002483
First target 0.00008012
Sec target 0.00009659
Approximate profit for short time 190%
A good entry point between 0.00002483 and 0.00003289

HolderStat | Memecoins are trending!1️⃣ PENGU: +47% 🚀
Capitalization $2.19B, rating 383. Classic memecoin without serious technology. Volatility is high - caution can't hurt.
2️⃣ BONK: +30% 🌟
Capitalization $2.52B, rating 183. Developing on Solana with a focus on integration. Prospects depend on realization of plans.
3️⃣ FLOKI: +17% 📈
Capitalization $1.72B, rating 69. Ambitions: payments, bank cards and philanthropy. Potential is high if plans are realized.
_____________________
🔥 Keep an eye on memecoins, but be aware of the risks! 🚀
Always DYOR! 🔬

Can #BONK Bulls Capture this opportunity for Bullish Rally?Yello, Paradisers! Will #BONK finally break out of its descending wedge and deliver the next big move, or will we witness a deeper correction? Let’s dive in:
💎#BONKUSDT is trading within a classic falling wedge formation and hinting at the possibility of a bullish breakout if key levels are reclaimed. Currently, the strong demand zone at $0.00002490–$0.00002941 is holding steady, showing that buyers are stepping in to defend these levels. If this support continues to hold, we could see #BONK attempt a breakout above the descending resistance around $0.00003192.
💎A clean breakout above this resistance would likely trigger a rally toward the major resistance zone at $0.00003924. Beyond that, #BONKUSD could extend its gains to $0.00004500 or higher, riding the momentum typical of wedge breakouts. However, without significant buying pressure, the price could stall under the resistance, leading to further consolidation.
💎If the demand zone at $0.00002490 fails, the situation flips bearish. A breakdown below this level would invalidate the wedge pattern, opening the door for a move down toward $0.00002000 or lower as sellers take control.
Stay focused, patient, and disciplined, Paradisers🥂
MyCryptoParadise
iFeel the success🌴

Bonk on RobinhoodEarlier this week Tucker BONK was listed on Robinhood. Unlike Coinbase meme drops skyrocketing, Robinhood is a bit slower. BONK rejected and bounced off our fib level at .236 at price .00002703. I might add a bag, not confirmed u til the RSI breaks midline, and breaks our BOS trend line in the 1hr closely. Watching point of interest to break is .00003140.
BONK!! LETS GO!

BONK/USDT Chart Update.The BONK/USDT chart highlights a potential long trade setup based on technical analysis.
The price appears to be consolidating within a descending triangle pattern, with a breakout opportunity on the horizon.
Support Zone:
A crucial support zone appears between 0.00001697 and 0.00001999, suggesting a potential rebound zone for bullish momentum.
200-Day Moving Average:
The price is approaching the 200-day moving average, which could act as dynamic support.
Ichimoku Cloud:
The cloud suggests near-term bearishness, but a breakout above the resistance could signal a trend reversal.
Long Target Zone:
A green zone extending up to 0.00006239 indicates a high probability target for the next bullish leg.
Trade Setup:
Entry Point: Around the support zone at 0.00001999.
Stop-Loss: Below 0.00001697 to manage risk.
Take Profit Target:
Primary: 0.00004500.
Secondary: 0.00006239 for higher potential profits.
Risk/Reward:
The setup offers a favorable risk-to-reward ratio, making it an attractive option for long trades. However, before entering the trade, confirmation of a reversal (e.g., bullish candlestick pattern or volume spikes) is recommended.
DYOR, NFA
@Peter_CSAdmin
