UPDATE {BONK}Hello friends
As we told you before, this coin can ATH by maintaining the specified range.
Now, with the loss of the limit, he was able to hit higher bottoms and if he breaks this triangle, we will go for ATH.
If the market falls, we have identified two other good ranges for you that can be suitable for buying.
Be successful and profitable.
Bonk

BONK 4H. Big Swing Ahead. 12/14/24After reaching a local high, the price retraced and moved into a correction phase. During this correction, the support level at $0.003183 was held, indicating bullish sentiment among buyers.
It’s worth considering opening a position from the current levels, whether for spot trading or a swing position on futures (with low leverage and a small percentage of your deposit). For those concerned about drawdowns, positions can also be accumulated or added from the support level at $0.003183.
Here are my parameters:
Entry Point (EP): Current price
Take Profit (TP): $0.005553, $0.006426, $0.007446
Stop Loss (SL): $0.002587
But remember: your money — your responsibility!
P.S.: I'm aware of the additional zeroes after the decimal; they’ve been omitted for simplicity. All levels are shown on the chart!
DYOR.

BONKUSDT: descending triangle breakout!! Join our community and start your crypto journey today for:
In-depth market analysis
Accurate trade setups
Early access to trending altcoins
Life-changing profit potential
Let's analyse BONKUSDT:
TECHNICAL ANALYSIS:
BONK is currently consolidating within a parallel channel. After breaking out of a descending triangle pattern and undergoing a corrective pullback, the price has found support at the 100-day EMA on the daily chart.
The previous breakout led to a significant 135% price surge, and a similar rally is anticipated as the price approaches the upper boundary of the parallel channel. Bullish crossovers in RSI and MACD indicators further support the bullish outlook for BONK.
Key Level:
Entry: CMP to $0.000033
SL: $0.000028
Leverage: 2-3x
Target:
$0.000046
$0.000055
$0.000068
$0.000089
If you find this analysis helpful, please hit the like button to support my content! Share your thoughts in the comments and feel free to request any specific chart analysis you’d like to see.
Happy Trading!!

BONK/USDT - H4 - Wedge BreakoutThe BONK/USDT pair on the H4 timeframe presents a Potential Buying Opportunity due to a recent breakout from a Wedge Pattern. This suggests a shift in momentum towards the upside and a higher likelihood of further advances in the coming Days.
Possible Long Trade:
Entry: Consider Entering A Long Position Above The Broken Trendline Of The Triangle After Confirmation. Ideally, This Would Be Around Breakout.
Target Levels:
1st Resistance
2nd Resistance
Your likes and comments are incredibly motivating and will encourage me to share more analysis with you.
Best Regards, KABHI FOREX TRADING
Thank you.

Bonk can pump 82% if it validated the bullflag bullish breakoutNo guarantee this pattern will break out, it could also extend the consolidation and morph into a completely different pattern, but at the moment it seems the best probability is a breakout upward considering we are only 1 big chart pattern breakout into the current long awaited altcoin market uptrend. *not financial advice* Please bonk responsibly.

RAY / USDT - Looking for a trend up to $5Raydium swap will grow as Solana grows. I see ray outperforming Solana in the mid to longer term (Weekly). Volume will only increase.
In the shorter term (Daily) I'm expecting a continued trend up towards $5 and above. I have left the chart as simple as i could. This is one of my high conviction plays.
This is not FA. Only a idea. I'm using smaller time frames to enter. Invalidation would be a brake of trend.
If you have liked this chart please boost and leave a follow to be among my first 100 followers here on trading view.

BONK Buy Setup (2H)From the point where we've placed the red arrow on the chart, it seems that BONK's correction has begun.
This correction appears to be a diametric pattern that is nearing completion.
As long as the price stays within the green zone, it could move toward the targets. The targets are marked on the chart.
A daily candle closing below the invalidation level would invalidate this analysis.
For risk management, please don't forget stop loss and capital management
When we reach the first target, save some profit and then change the stop to entry
Comment if you have any questions
Thank You


$BONK: A New Entry OpportunityLooking to enter CRYPTOCAP:BONK below $0.000038.
The $0.000035 range marks the lowest entry point, and I'll re-evaluate the price action if it reaches that area. Stay tuned to see how it behaves there before making any further moves.

bonk ath!!!Hello friends
This meme coin is due to breaking the historical ceiling.
At the moment, pullback has hit the surface and made two twins on the bottom surface, which gives us this warning that a big climb is coming...
Don't forget capital management.
Be successful and profitable.

BonkBonk usdt Daily analysis
Time frame daily
Risk rewards ratio >1.5
Short position
Bink airdrop causes this pump and now this pump ended and bonk isn't attractive for users so I think price will come down

BONK - Ready to flyBONK is ready to fly, a little bit of consolidation here before it rips up! BONK/USDT

BONK MEME COIN LONG IDEA - Solana Memecoin TrendBONK is a popular Solana meme coin and is gaining attention amid the ongoing meme coin trend, so it’s worth keeping an eye on.
Technical Analysis: BONK recently broke out of a bearish trendline, retested it, and appears to be consolidating here. I believe we could see strong upward momentum soon. The price has also recently broken a larger bearish trendline, created a weekly demand zone, run daily liquidity, and reached a daily demand level, followed by a strong breakout.
I'm already in this trade and would consider adding more if the price retests and reacts at the trendline.
Please note the tight stop-loss on this trade and adjust your risk accordingly.
SL: 0.020847
TP1: 0.0305
TP2: 0.0339
TP3: 0.0357
After reaching TP1, I'll move my stop-loss to breakeven, and I suggest you consider doing the same.

$bonk! another lower timeframe entry is upon usRemember not to be greedy. bitcoin isn't pushing strong so, don't expect different from the rest of the pack

BONKUSD going at least x10 from here!Bonk (BONKUSD) just formed a Golden Cross on the 1D time-frame and having broken above its current ATH Resistance (March 04 High), it is expected to rise parabolically from here.
To back this up, that is exactly what took place after the previous 1D Golden Cross a year ago (November 08 2023), when again the price broke above Resistance 1 and turned parabolic to the 3.0 Fibonacci extension, completing a +20200% rise from its bottom.
If a new +20200% rise seems unrealistic to you (it would however form a perfect Higher High at the top of the long-term Channel Up), then you can target the 3.0 Fibonacci extension at $0.0006650, which represents a +1100% rise from the current levels. A x10 opportunity indeed.
-------------------------------------------------------------------------------
** Please LIKE 👍, FOLLOW ✅, SHARE 🙌 and COMMENT ✍ if you enjoy this idea! Also share your ideas and charts in the comments section below! This is best way to keep it relevant, support us, keep the content here free and allow the idea to reach as many people as possible. **
-------------------------------------------------------------------------------
💸💸💸💸💸💸
👇 👇 👇 👇 👇 👇

BONK Price Soars 12% Post-Major ListingThe Solana-based meme coin CRYPTOCAP:BONK is making waves in the cryptocurrency market. After its listing on South Korea’s largest crypto exchange, Upbit, the coin has surged by 12% in a single day, reaching a new all-time high. This recent rally has extended BONK’s weekly gains to over 75%, sparking optimism for its potential to challenge the giants of the meme coin market like PEPE and SHIB.
The Catalyst Behind BONK’s Rally
The Upbit listing has proven to be a game-changer for CRYPTOCAP:BONK , as the Korean exchange announced the addition of a BONK-Korean Won trading pair. With Korean investors’ affinity for meme coins, this move has significantly boosted trading activity and investor confidence.
- Massive Volume Surge: BONK’s daily trading volume has soared by 77%, crossing the $2.7 billion mark.
- Whale Activity: Blockchain analytics platform Lookonchain reported notable whale interest. A well-known investor, famous for $4.84 million profits from POPCAT, recently acquired 65.4 billion BONK tokens worth 3.4 million USDC, signaling strong confidence in BONK’s potential.
- Market Cap Milestone: BONK’s market cap now exceeds $4.2 billion, ranking it as the fourth-largest meme coin. Analysts predict it could climb to $10 billion, positioning it among the top three meme coins.
Technical Analysis
BONK has consistently followed a cycle of falling wedges followed by rising wedges. This pattern has occurred three times, each signaling a breakout to new highs.
CRYPTOCAP:BONK is currently positioned for a healthy retracement to the $0.000051 support level before potentially climbing further. The Relative Strength Index suggests room for retracement or a continuation of the bullish trend. Furthermore, BONK’s 24-hour trading volume surged by 117.24%, reflecting strong investor interest and liquidity.
With BONK currently trading at $0.0000559, analysts see potential for the price to move towards $0.005 in the long term, fueled by its increasing adoption, whale interest, and strong technical foundation.
Upbit Listing Amid Regulatory Scrutiny
Interestingly, this development comes as Upbit faces regulatory challenges. South Korea’s Financial Intelligence Unit has flagged over 500,000 KYC violations by the exchange. Despite this, the CRYPTOCAP:BONK listing has ignited investor enthusiasm and strengthened the coin’s community.
Conclusion
BONK has displayed a rare mix of healthy technical patterns, growing fundamentals, and increasing adoption. The combination of whale activity, a major exchange listing, and sustained volume growth suggests BONK is well-positioned to capitalize on the meme coin trend. With a market cap of $4.2 billion and growing, the $10 billion milestone could soon be within reach.
Investors are keeping a close watch on BONK’s next moves, as it continues to solidify its position in the meme coin hierarchy. Will BONK challenge PEPE and SHIB? Only time will tell, but the momentum is undeniably strong.

BITCOIN Top Price PredictionIf things flow as they are, I am calling 108-118,000 as the top before a retrace. The timing should land us right before Trump is sworn in. People are buying the 'rumor' and will sell the news. After that, good or bad policies from him will dictate what happens next. CRYPTOCAP:BTC CRYPTOCAP:ETH CRYPTOCAP:SHIB CRYPTOCAP:PEPE CRYPTOCAP:BONK CRYPTOCAP:SOL CRYPTOCAP:XRP

BONK: will the 1 trillion token burn fuel price growth?The Solana (SOL)-based memecoin BONK rallied 100% in the past seven days, driven by an overall market pump and a massive deflationary plan to burn 1 trillion tokens.
On 15th November, Bonk DAO announced the deflationary plans with the 2024 Christmas deadline.
Immediately after the news, BONK pumped 27% and added on its weekly gains, which crossed 100% amid an extra weekend pump. For context, burning tokens reduces supply and ultimately boosts the value of the remaining assets.
The extra pump on Sunday eyed the immediate bullish target of $0.000057 on the Fib tool. If the uptrend extended, the next target would be $0.000067, offering an extra 40% potential gains.
But BONK grabbing the extra gains could only be feasible if the mememcoin stayed above its previous ATH.
That said, technical indicators showed massive buying interest but an overheated market scenario. The Stochastic RSI was in oversold territory, while the OBV (On Balance Volume) reached new highs.
Interestingly, leveraged bulls also FOMO’ed on the BONK’s rally. The OI (open interest) rates surged 3X, from about $50M to over $150M in just days. This suggested that leveraged players took massive debts to place bullish bets on BONK.
Market pundits expect the BONK rally to extend, partly due to the expected 1T token burn. However, the broader market sentiment could determine the next price direction for the memecoin.

BONKUSDT Triangle Pattern!BONKUSDT technical analysis update
CRYPTOCAP:BONK price is breaking out of a triangle pattern on the daily charts. The price has been trading within this triangle pattern for the past year. If the breakout is confirmed, we can expect a strong bullish move. Over the last few days, there has been an increase in volume, which is also considered a bullish sign for BINANCE:BONKUSDT

BONKUSDT Ready for Big PUMP!!!BINANCE:BONKUSDT has recently broken out and successfully retested a previous resistance level, showing signs of strength. Now, it’s attempting to break out of a triangle pattern, with the resistance line acting as a key barrier. If it manages to break through, a significant upward move could be on the horizon, fueled by the ongoing memecoin craze. However, caution is advised—consider using only a small portion of your capital to manage risk in this volatile environment.
BINANCE:1000BONKUSDT.P Currently trading at $0.000036
Buy level: Above $0.000033
Stop loss: Below $0.0000262
Max Leverage 3x
Always keep Stop loss
Follow Our Tradingview Account for More Technical Analysis Updates, | Like, Share and Comment Your thoughts

BONKUSDT (BONK) Updated till 12-11-24BONKUSDT (BONK) Daily timeframe range. we can see a nice continuous move here. not very far from its price discovery. at this volume a clean close above 0.00003289 can push it to 0.00004151 or above. recent retrace point at 0.00002441.

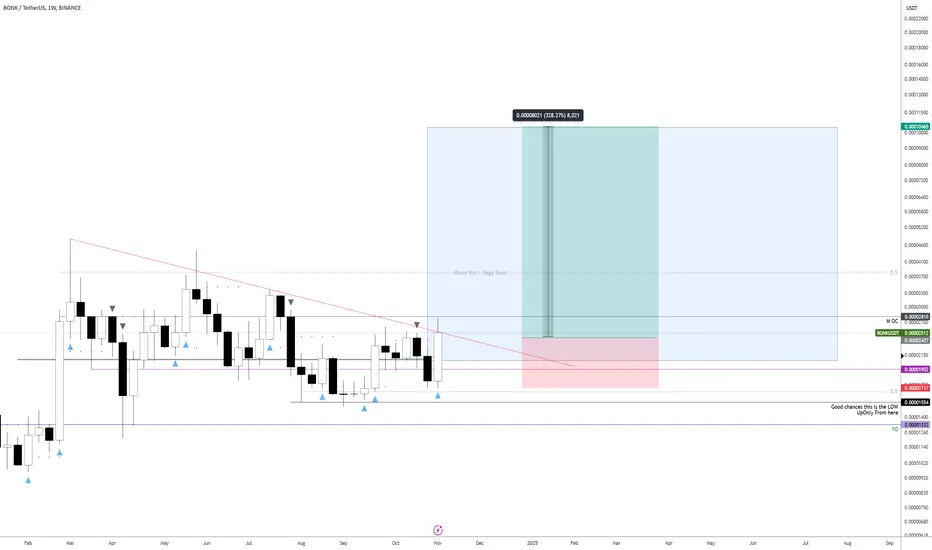
Massive Monthly Signal on $BONK: Clear Path Ahead!We’ve got a strong monthly signal on $BONK. While it doesn’t have the same extended targets as other coins, the direction is crystal clear!
An entry around 0.000022 would be optimal. Anything lower than that would be a gift.
I’ll be scaling back in after exiting the previous trade on the daily chart (it wasn’t ready to expand then). Now, with the macro signal in place, the outlook looks much stronger.
Targeting above 0.0001.
BONKUSDT 3DBONK ~ 3D
#BONK Buy gradually inside this pattern,. Minimum target 20%++.
it is only a matter of time until this pattern is broken and the Bulls dominate.
