BONK About to Explode or Fakeout? Key Levels Are UnfoldingYello, Paradisers! Is #BONK gearing up for a face-melting rally, or is this just another trap designed for emotional traders?
💎BONKUSDT has recently formed a double bottom, a key reversal pattern that often appears before significant bullish momentum kicks in. This comes after a sustained bearish trend, and we’re now seeing signs of strength re-entering the market.
💎What’s even more interesting, a lookalike of skewed triangle pattern is starting to emerge. These often signal continuation of strength, and when paired with an already bullish reversal, it paints a potentially explosive short-term picture.
💎#BONKUSDT is currently sitting on ascending support around the $0.00001980 level. This zone is further bolstered by the EMA-50, adding extra technical significance. If BONK can continue to hold this level, the price is well-positioned to push higher toward the $0.00002470 mark, a moderate resistance zone that could serve as the next stepping stone in this bullish scenario.
💎If BONK clears this resistance with conviction, momentum could pick up rapidly, opening the doors for an aggressive move toward the $0.00003100 to $0.00003400 region. This is a critical profit-taking zone, not only because of historical resistance but also due to a dense confluence of technical barriers.
💎Zooming into the 12-hour timeframe, BONK has just entered a golden cross formation. This bullish crossover is acting as dynamic support, with the $0.00001800 level becoming an important defensive area for price stability moving forward.
Paradisers, strive for consistency, not quick profits. Treat the market as a businessman, not as a gambler.
MyCryptoParadise
iFeel the success🌴
BONKUSDT

1000Bonk Day Trading SetupIf you see price starts consolidation at the poi, or see any 5m big green candle then enter with proper SL, will update trade should be closed or not.

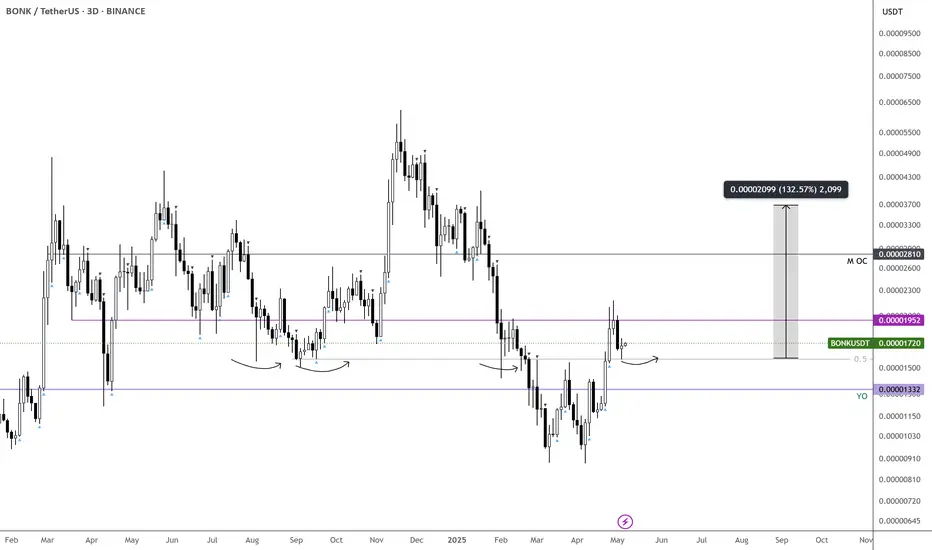
BONK looks ready to pivot—clear skies aheadLiking the price action so far. It’s flipped above the mid-level, which aligns with key pivots across multiple timeframes.
Ideally looking for a week of consolidation here before the next major move.
Entry around 0.0000158
Targeting 0.000028 if things unfold as expected
SEED_DONKEYDAN_MARKET_CAP:BONK BINANCE:BONKUSDT
#BONK/USDT#BONK
The price is moving within a descending channel on the 1-hour frame, adhering well to it, and is on its way to breaking it strongly upwards and retesting it.
We are seeing a bounce from the lower boundary of the descending channel. This support is at 0.00002070.
We have a downtrend on the RSI indicator that is about to break and retest, supporting the upward trend.
We are looking for stability above the 100 moving average.
Entry price: 0.00002205
First target: 0.00002287
Second target: 0.00002404
Third target: 0.00002551

Bonk at Floor Price - 2x to 3x Pump Incoming?SEED_DONKEYDAN_MARKET_CAP:BONK has retested its 2024 floor price at $0.00001 - a zone that previously triggered strong upward moves. Could this be a reliable support once again and spark a 2x to 3x bounce from current market price at $0.00001135?
What's your take - bounce or breakdown from here?
Share your thoughts below!
Kindly support this idea with a LIKE👍 if you find it useful🥳
Happy Trading💰🥳🤗

BONKUSDT Up for a Major Breakout! Key Levels to Watch!Yello, Paradisers! Is #BONK about to explode higher after weeks of consolidation? A powerful shift is underway—and the bulls might just be waking up at the perfect time.
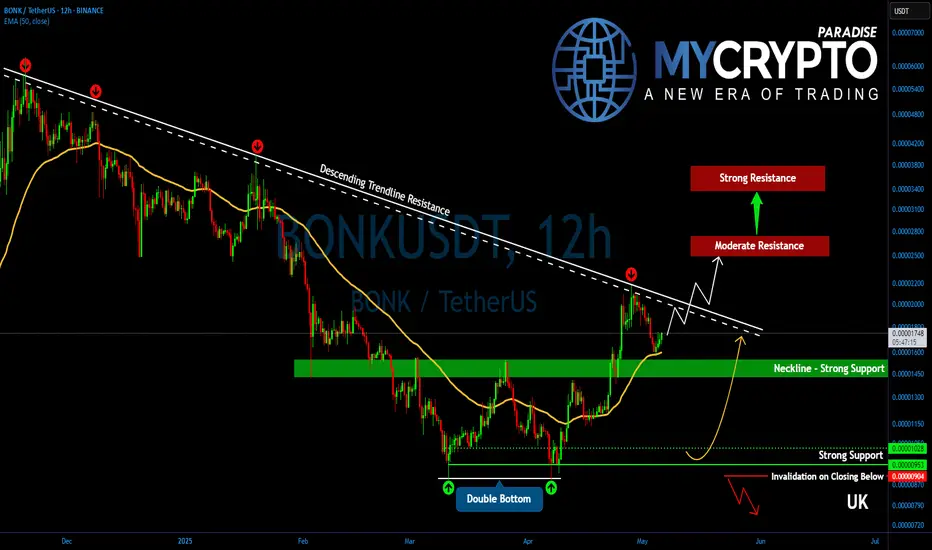
💎#BONKUSDT is beginning to show a notable short-term trend reversal, with a double bottom pattern now confirmed. This structure signals a potential end to the recent bearish control, and price action is now pressing against the descending trendline resistance. A successful breakout here could completely flip market dynamics in favor of the bulls.
💎Following a minor round of profit-taking at the descending resistance, BONK pulled back toward the previous breakout support. That retracement brought the price right back into the key supportive range between 0.00001550 and 0.00001425, where it's now starting to bounce again. Notably, the EMA-50 has aligned perfectly with this support zone, adding strength to the reaction from this area.
💎BONKUSDT's next challenge lies at 0.00002000 to 0.00002100—a major descending resistance level that has capped upside since December 2024. Breaking above this structure would be a critical bullish breakout, potentially unleashing the next wave of upside momentum.
💎If bulls push through this barrier, BONK is expected to move toward the next moderate resistance at 0.00002500 to 0.00002750. This area aligns with the measured target of the double bottom formation. However, if bullish strength continues to build, BONK may even extend toward the strong resistance between 0.00003400 and 0.00003700, where the 50% Fibonacci retracement also resides—a historically significant level for potential trend reversals.
💎Adding to the bullish case, the 12-hour EMA-50 and EMA-200 are now converging toward a possible Golden Cross. If this cross confirms, it could serve as a major technical catalyst for a broader trend reversal and further upside continuation.
Paradisers, strive for consistency, not quick profits. Treat the market as a businessman, not as a gambler.
MyCryptoParadise
iFeel the success🌴
#BONK/USDT#BONK
The price is moving within a descending channel on the 1-hour frame and is expected to break and continue upward.
We have a trend to stabilize above the 100 moving average once again.
We have a downtrend on the RSI indicator that supports the upward move with a breakout.
We have a support area at the lower boundary of the channel at 0.00001825, which acts as strong support from which the price can rebound.
Entry price: 0.00001883
First target: 0.00001967
Second target: 0.00002078
Third target: 0.00002222

$BONK here loks good for another 1000%SEED_DONKEYDAN_MARKET_CAP:BONK here looks good for another 1000%; cluster of htf levels with declining sell volume.
A run to ATH is 500%, and beyond to the fibs is over 1000%.
Easy invalidation just below pink yearly line.

Breaking: Bonk Inu ($BONK) Spike 17% Reclaims $1 Bln Market CapBuilt and integrated in the Solana blockchain before migrating to 7 other chains, the dog-themed meme coin Bonk Inu ( SEED_DONKEYDAN_MARKET_CAP:BONK ) saw a notable uptick of 17% to reclaim the $1 Billion market cap. This was hours after its rival $FARTCOIN reclaims the $1 Billion market.
SEED_DONKEYDAN_MARKET_CAP:BONK has seen a +15964.82% uptick since listing, before retracing losing about 85% of market value. With increasing momentum, SEED_DONKEYDAN_MARKET_CAP:BONK is set to continue the bullish sojourn should the memecoin break the $0.00001555 resistant point. This point is serving as the stronghold for SEED_DONKEYDAN_MARKET_CAP:BONK albeit the general crypto market is in a bullish momentum with CRYPTOCAP:BTC , CRYPTOCAP:SOL , and CRYPTOCAP:ETH all seeing notable price upticks today.
SEED_DONKEYDAN_MARKET_CAP:BONK 's RSI is presently at 78 placing it slightly in overbought territories and also primed for a continuation trend. The asset is trading above key moving averages (MA) enroute to breaking the resistant point to pave way for a bullish campaign for $BONK.
What Is Bonk (BONK)?
According to the one-pager, BONK is the first dog-themed coin on Solana "for the people, by the people" with 50% of the total supply of the cryptocurrency airdropped to the Solana community. BONK is similar to Shiba Inu (SHIB) and Dogecoin (DOGE) memecoins, it was launched on December 25, 2022, and led to an increase in the price of the SOL token (a rise of 34% in 48 hours). Trading began on December 30, 2022, arousing genuine interest from the crypto community.
Bonk Price Data
The Bonk price today is $0.000015 USD with a 24-hour trading volume of $218,248,216 USD. Bonk is up 19.01% in the last 24 hours. The current CoinMarketCap ranking is #62, with a market cap of $1,162,183,290 USD. It has a circulating supply of 78,658,296,511,158 BONK coins and a max. supply of 88,872,433,754,423 BONK coins.

$BONK: Prepping for a Potential Explosive Move🚀 SEED_DONKEYDAN_MARKET_CAP:BONK : Prepping for a Potential Explosive Move
SEED_DONKEYDAN_MARKET_CAP:BONK is known for its wild, high-volatility pumps—and we may be approaching another one.
After a significant bearish divergence on the daily chart, SEED_DONKEYDAN_MARKET_CAP:BONK has retraced to levels lower than last year. However, it's important to remember: SEED_DONKEYDAN_MARKET_CAP:BONK is the original meme coin of the Solana ecosystem, and it's strongly supported by Solana whales.
📈 If CRYPTOCAP:SOL rallies, SEED_DONKEYDAN_MARKET_CAP:BONK usually follows.
While a new all-time high might be out of reach in the short term, a significant move to the upside is on the table. Here's why:
✅ RSI is rising, forming a bullish divergence
✅ Price has entered my 2025 buy zone
✅ MACD has just crossed bullish on the 1D timeframe
✅ Volume is low, often a precursor to explosive moves
✅ CRYPTOCAP:OTHERS index is showing signs of strength—altcoin momentum is building
🧠 If momentum picks up, we could see a 2x to 3x move from current levels.
📌 Keep an eye on this one. As always, DYOR.
#BONK #Solana #MemeCoin #Altcoins #CryptoTrading #CryptoSignals #BONKArmy #MACD #RSI #DYOR #Altseason #CryptoAnalysis

BONKUSDT 3DBONK ~ 3D Analysis
#BONK Important support that must be maintained for now. bouncing from here a short -term target of at least 15%+.
BONK: Time to BounceBONK has seen a 75% retracement to the downside since November and is currently holding at support. I would expect a bounce to the upper trend line. A clean break of the trend line would cause a huge move to the upside. Keep an eye at these levels.

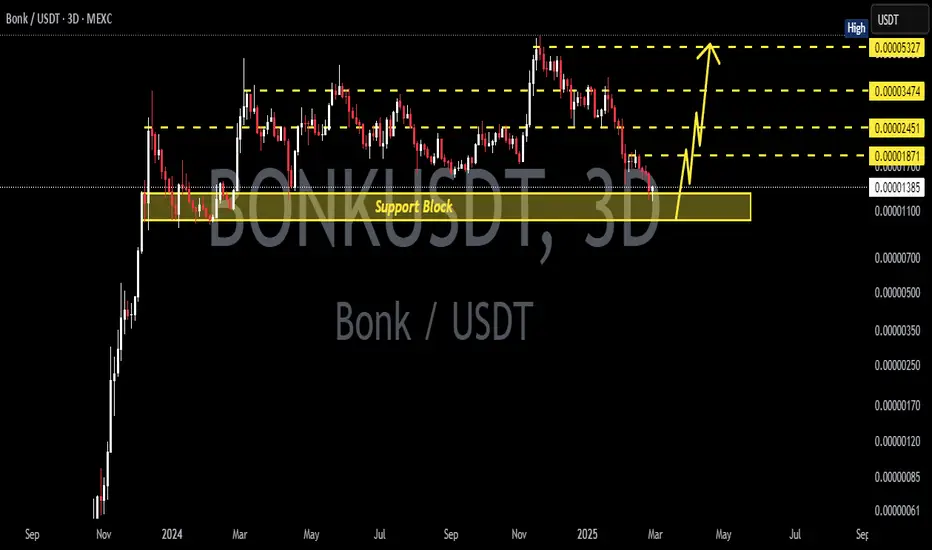
BONKUSDT 3DBONK ~ 3D Analysis
#BONK Buy gradually from here if you still have a Conviction on this coin.
Reason, This support block is still maintained.
BONK / TetherUS. 2 week TF Hey traders is Bonk ready to go Bonkers again? we have had a great retrace to the demand zone.

BONK vs DOGE! Both are gone!Gone means not completely, but loooks like they both retest thier lows completely once more, bearish stances again!

Bonk Support targetBonksi is falling down. The support is on the cross. There is a chance it will consolidate at the rising wedge on the weekly chart, Will buy some here.

Bonk Back at Support: Time to Buy or Wait...?Currently, the BONK coin is testing an important support level after a downward trend. If you are considering buying it, it's advisable to wait until it breaks above the downtrend line. This would provide two confirmations: the support level and the breakout from the trendline. Please be cautious with your decision, as it is a meme coin and can be highly volatile.

$BONK: Hold or Fall? Potential 3x from Here!Decided to bid this area one more time on BINANCE:BONKUSDT :
The lows need to hold, or it’s an easy path down to 0.00002150 or lower.
It needs to break the current swing highs to at least flip the downtrend.
Just placing a bet here, expecting the following to happen. Will add significantly once the MSB occurs at the swing high.
It’s a good level, and I still believe CRYPTOCAP:SOL holds above 170. Don’t think twice, it’s simple.


BONKUSDT: Double Bottom Reversal or Breakdown Ahead?Yello, Paradisers! Are you watching BONKUSDT right now? Because what happens next at this critical support zone could either set up a massive bullish reversal or bring another wave of panic selling that traps impatient buyers. Let’s break down why this setup demands your full attention.
💎Right now, BONKUSDT is showing a healthy retracement after its recent moves, and the formation of a descending channel suggests a possible double bottom pattern could be in play. But here’s the catch — for this bullish scenario to play out, we need to see confirmation on the lower timeframes. Here’s what we’re watching closely:
💎If BONKUSDT gives us a bullish I-CHoCH (Internal Change of Character) on the lower timeframes within the current support zone, it will significantly increase the chances of a bullish breakout from this descending channel. This would be the first signal that buyers are stepping back in and preparing for a reversal.
💎However, if we see further retracement or even panic selling, don’t worry just yet. There’s a strong support zone below, where we can expect another potential bounce. But once again, we need bullish confirmation through an I-CHoCH in the lower timeframes to increase our probability of success. Without that confirmation, it’s best to stay cautious.
💎If BONKUSDT breaks down and closes a candle below the strong support zone, then our entire bullish idea gets invalidated. In this scenario, it’s better to stand aside and wait for a more reliable structure to form. No need to force trades — discipline beats FOMO every time.
💎It all comes down to patience and waiting for the right signals to line up. The lower timeframes hold the key, and as always, we must follow the price action, not get caught in emotions.
Stay focused, Paradisers. Let the market show you the way — it’s all about timing and strategy.
MyCryptoParadise
iFeel the success🌴

#BONK/USDT Ready to go higher#BONK
The price is moving in a descending channel on a 1-day frame and sticking to it well
We have a bounce from the lower limit of the descending channel, this support is at 0.00002500
We have a downtrend on the RSI indicator that is about to be broken, which supports the rise
We have a trend to stabilize above the moving average 100
Entry price 0.00003350
First target 0.00003500
Second target 0.00004186
Third target 0.00004854

BONKUSDT It seems that this currency is in a strong upward structure.
With the completion of the J wave, which is the last rally of the diametric pattern, it has the chance of a very strong rise.
Just a technical analysis.

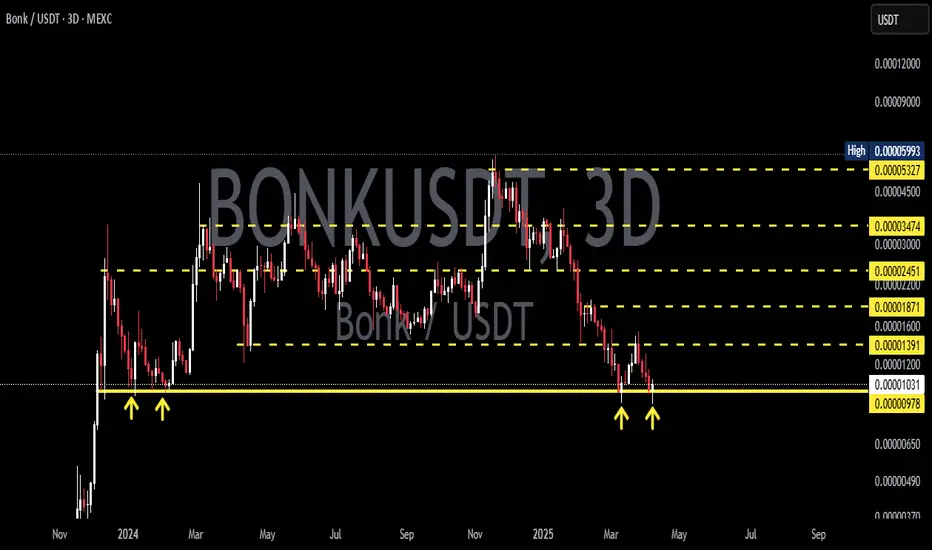
BONK support and resistance levels to watchDaily BONK chart (right chart) showing resistance levels on way up and support trendline below.
Weekly chart (left chart) also shows levels to watch.
Targets are green horizontal line (left chart) then blue horizontal line (right chart) and then red trendline (right chart).
Don't forget to smash that rocket like button!
