BONKUSDT – Let the Market Come to YouIn a possible Q3 correction, BONKUSDT may retest the green box zones below.
These areas are not predictions — they’re prepared zones where I’ll be waiting, not chasing.
🟩 I don’t buy strength blindly. I buy value with structure.
All risk-on markets typically experience significant corrections in the third quarter of the year and struggle to recover from this correction until the end of the year.
🎯 My Strategy
🔔 Set alerts for the green boxes
🕐 Switch to the 1-hour timeframe when triggered
📈 Wait for upward breakout + positive CDV
🎯 Only then: take the shot — one bullet, risk-managed
“Markets reward those who wait with a plan, not those who rush with emotion.”
Let’s stay patient, structured, and consistent.
— UmutTrades 💙
📌I keep my charts clean and simple because I believe clarity leads to better decisions.
📌My approach is built on years of experience and a solid track record. I don’t claim to know it all but I’m confident in my ability to spot high-probability setups.
📌If you would like to learn how to use the heatmap, cumulative volume delta and volume footprint techniques that I use below to determine very accurate demand regions, you can send me a private message. I help anyone who wants it completely free of charge.
🔑I have a long list of my proven technique below:
🎯 ZENUSDT.P: Patience & Profitability | %230 Reaction from the Sniper Entry
🐶 DOGEUSDT.P: Next Move
🎨 RENDERUSDT.P: Opportunity of the Month
💎 ETHUSDT.P: Where to Retrace
🟢 BNBUSDT.P: Potential Surge
📊 BTC Dominance: Reaction Zone
🌊 WAVESUSDT.P: Demand Zone Potential
🟣 UNIUSDT.P: Long-Term Trade
🔵 XRPUSDT.P: Entry Zones
🔗 LINKUSDT.P: Follow The River
📈 BTCUSDT.P: Two Key Demand Zones
🟩 POLUSDT: Bullish Momentum
🌟 PENDLEUSDT.P: Where Opportunity Meets Precision
🔥 BTCUSDT.P: Liquidation of Highly Leveraged Longs
🌊 SOLUSDT.P: SOL's Dip - Your Opportunity
🐸 1000PEPEUSDT.P: Prime Bounce Zone Unlocked
🚀 ETHUSDT.P: Set to Explode - Don't Miss This Game Changer
🤖 IQUSDT: Smart Plan
⚡️ PONDUSDT: A Trade Not Taken Is Better Than a Losing One
💼 STMXUSDT: 2 Buying Areas
🐢 TURBOUSDT: Buy Zones and Buyer Presence
🌍 ICPUSDT.P: Massive Upside Potential | Check the Trade Update For Seeing Results
🟠 IDEXUSDT: Spot Buy Area | %26 Profit if You Trade with MSB
📌 USUALUSDT: Buyers Are Active + %70 Profit in Total
🌟 FORTHUSDT: Sniper Entry +%26 Reaction
🐳 QKCUSDT: Sniper Entry +%57 Reaction
📊 BTC.D: Retest of Key Area Highly Likely
📊 XNOUSDT %80 Reaction with a Simple Blue Box!
📊 BELUSDT Amazing %120 Reaction!
📊 Simple Red Box, Extraordinary Results
📊 TIAUSDT | Still No Buyers—Maintaining a Bearish Outlook
📊 OGNUSDT | One of Today’s Highest Volume Gainers – +32.44%
📊 TRXUSDT - I Do My Thing Again
📊 FLOKIUSDT - +%100 From Blue Box!
📊 SFP/USDT - Perfect Entry %80 Profit!
📊 AAVEUSDT - WE DID IT AGAIN!
I stopped adding to the list because it's kinda tiring to add 5-10 charts in every move but you can check my profile and see that it goes on..
Bonkusdtperp

#BONK/USDT About to Break Out !#BONK
The price is moving within a descending channel on the 1-hour frame and is expected to break and continue upward.
We have a trend to stabilize above the 100 moving average once again.
We have a downtrend on the RSI indicator that supports the upward break.
We have a support area at the lower boundary of the channel at 0.00002440, acting as a strong support from which the price can rebound.
We have a major support area in green that pushed the price upward at 0.00002372.
Entry price: 0.00002552.
First target: 0.00002694.
Second target: 0.00002882.
Third target: 0.00003118.
To manage risk, don't forget stop loss and capital management.
When you reach the first target, save some profits and then change the stop order to an entry order.
For inquiries, please comment.
Thank you.

BONK : Best of luck to you...Hello friends🙌
👀Considering the decline we had, you can see that the price was supported by buyers and broke the specified resistance. Now, in the price correction, there is a good opportunity to buy with risk and capital management and in steps and be patient until the specified targets are reached.
🔥Follow us for more signals🔥
*Trade safely with us*

Boink - I Bonk You!I bonk you!!!! Don't you think buying here aint good? But selling here might be? Or just dont get too bulish with bonk

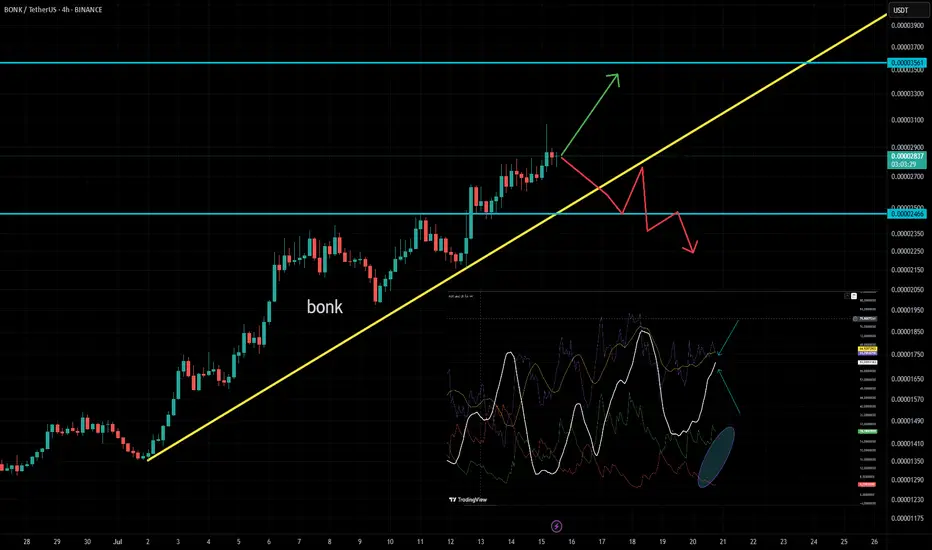
BONK BONKUSDT Hello, greetings...
🐱🐉 The support and resistance levels in Bonk during the 4-hour timeframe are shown in the graph as I have indicated.
🐱🐉 However, what I want to discuss with you is how we should follow Bonk and how we can maintain control over its strength. I will show this to you...
🐱🏍 First, let's just look at the support, resistance, and our trend...
🐱🏍 When we look at it, we see a strong upward trend showing rapid growth and there is both a support level and a resistance level. It appears that the upward trend will continue until we reach the yellow line. When we reach the yellow trend, the color of things will change.
🐱👤 What I want to explain most to you is the indicator part now...
🐱👤 The blue arrow marks indicate the strength of the trend, the white line is called ADX, which shows how strong the trend is. The purple one is the well-known RSI,
🐱👤 So what is ADX telling us right now?
🐱👤 ADX is still looking upwards and at a high level, so it makes more sense to hold on to our long positions.
🐱🚀 The indicator we know as DI+ and DI- consists of green and red thin lines. What does it tell us?
🐱🚀 If DI+ (green) crosses above DI- (red), it indicates a positive trend and we are currently seeing a significant positive movement. We will use this indicator like this: if ADX turns downward and DI- crosses above DI+, those who are holding long positions should be cautious.
CONTINUE TO HOLD THE POSITION
+DI > -DI
ADX > 25
RSI < 70 → Should not be in an overbought area
BE CAUTIOUS
-DI > +DI
ADX > 25
RSI > 30 → Should not be in an oversold area
BONKUSDT Forming Descending TriangleBONKUSDT is rapidly emerging as a favorite among traders looking for high-growth meme coins with serious upside potential. This coin has recently shown strong price action, supported by healthy volume that signals growing investor confidence. The market sentiment around BONK has been increasingly bullish, and with current patterns aligning well with a potential breakout, traders are eyeing an impressive 90% to 100% gain from its current levels. Such explosive potential makes BONKUSDT one of the standout opportunities in the altcoin space right now.
As the crypto community continues to embrace meme coins, BONK has carved out a unique space with its vibrant community and strong social engagement. This coin’s popularity on social platforms is fueling its liquidity, and the recent accumulation phases suggest that smart money may be positioning for the next wave up. Technical traders should pay close attention to how BONKUSDT reacts at key resistance zones, as a confirmed breakout could open the door to a major rally in the coming weeks.
The technical structure shows BONKUSDT maintaining its trend above critical support levels while forming higher lows — a promising sign of sustained upward momentum. Traders are watching for a decisive move above recent swing highs to confirm the bullish continuation. With solid volume backing up these moves, there’s a strong chance that BONK will reward patient holders with substantial returns. Keep an eye out for breakout candles and spikes in trading volume as potential signals for entry.
✅ Show your support by hitting the like button and
✅ Leaving a comment below! (What is You opinion about this Coin)
Your feedback and engagement keep me inspired to share more insightful market analysis with you!

BONKUSDT Forming Bullish BreakoutBONKUSDT is showing some exciting bullish signs as it pushes out of a prolonged downtrend with a clear breakout setup. The chart you see highlights how this pair has been consolidating within a tight range and now seems ready to surge higher. With good volume supporting the current move, BONK is catching the eyes of traders looking for undervalued coins that have the potential for rapid upside. The price action shows a textbook breakout above resistance levels, which is often the first step for a sustained rally in the crypto market.
This pair has already attracted attention due to its unique community-driven nature and meme coin appeal, which tends to create sudden spikes when momentum builds up. As BONKUSDT attempts to deliver an expected gain of 90% to 100%+, it becomes an appealing choice for short-term swing traders and high-risk, high-reward portfolios. Many investors are betting on its potential to break through key price levels, which could trigger a wave of fresh buying volume.
As the crypto market continues to reward coins that demonstrate both technical strength and community hype, BONKUSDT stands out as one of those trending assets that could surprise to the upside. With a clear breakout from its falling wedge structure and the market sentiment turning positive, traders should keep a close eye on how it behaves around its current levels. Any strong candle closures above resistance could pave the way for an accelerated move.
✅ Show your support by hitting the like button and
✅ Leaving a comment below! (What is You opinion about this Coin)
Your feedback and engagement keep me inspired to share more insightful market analysis with you!

BONKUSDT Forming Falling WedgeBONKUSDT is catching the attention of savvy crypto traders as it displays a classic falling wedge pattern, a well-known bullish reversal signal. This technical setup suggests that the prolonged downtrend could be nearing exhaustion, opening the door for a significant upside move. With good trading volume accompanying recent price action, buyers are showing signs of accumulation, laying the groundwork for a potential breakout that could deliver an impressive 90% to 100%+ gain in the coming sessions.
The falling wedge pattern is one of the most reliable chart formations for spotting trend reversals in the crypto market. As BONKUSDT continues to coil tighter within the wedge, the pressure is building for a breakout to the upside. Investors are becoming increasingly optimistic as they see strong support levels being defended, indicating that the bears are losing momentum. When price action breaks out of the wedge with convincing volume, a swift rally is likely to follow, rewarding those who positioned themselves early.
BONKUSDT’s growing popularity among retail and institutional traders further adds to its bullish outlook. The project is generating a buzz across crypto communities as investors recognize its potential for high percentage returns. Combined with solid fundamentals and renewed market sentiment, BONKUSDT has what it takes to deliver a powerful move once the falling wedge confirms its breakout. Smart money is watching this pair closely for a breakout candle that could ignite a trend reversal rally.
It’s crucial for traders to keep an eye on volume spikes and daily closes above key resistance to validate the wedge breakout. Clear risk management and well-defined stop-loss placements are essential to ride this setup with confidence. If the pattern plays out as expected, BONKUSDT could become one of the top performing coins in the near term, offering traders an excellent opportunity to capitalize on this bullish momentum.
✅ Show your support by hitting the like button and
✅ Leaving a comment below! (What is You opinion about this Coin)
Your feedback and engagement keep me inspired to share more insightful market analysis with you!

BONKUSDT 1D AnalysisBONK ~ 1D Analysis
#BONK Buy on retesting this support block or buy after successfully breaking this resistance line with a short term target of at least 15%+ and a long term target of $0.000065+

1000Bonk Day Trading SetupIf you see price starts consolidation at the poi, or see any 5m big green candle then enter with proper SL, will update trade should be closed or not.

#BONK/USDT#BONK
The price is moving within a descending channel on the 1-hour frame, adhering well to it, and is on its way to breaking it strongly upwards and retesting it.
We are seeing a bounce from the lower boundary of the descending channel. This support is at 0.00002070.
We have a downtrend on the RSI indicator that is about to break and retest, supporting the upward trend.
We are looking for stability above the 100 moving average.
Entry price: 0.00002205
First target: 0.00002287
Second target: 0.00002404
Third target: 0.00002551

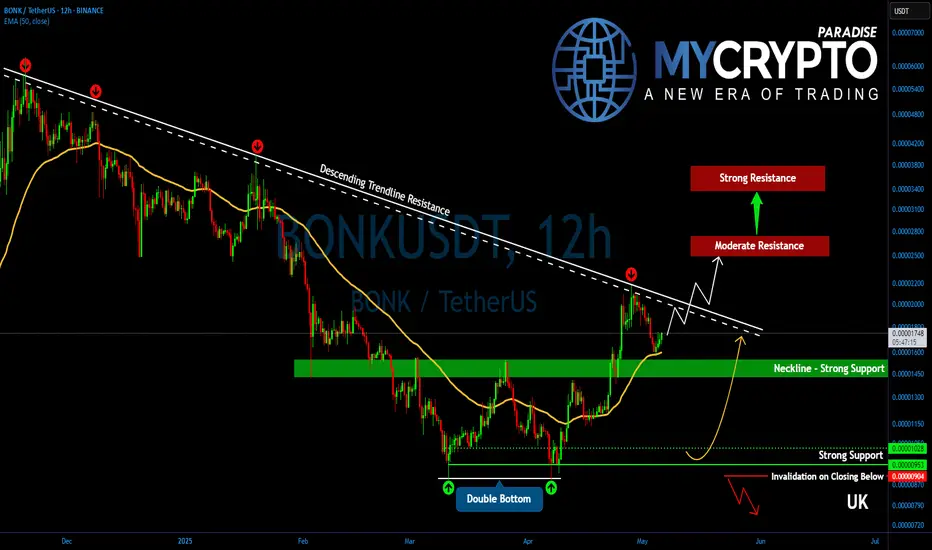
BONKUSDT Up for a Major Breakout! Key Levels to Watch!Yello, Paradisers! Is #BONK about to explode higher after weeks of consolidation? A powerful shift is underway—and the bulls might just be waking up at the perfect time.
💎#BONKUSDT is beginning to show a notable short-term trend reversal, with a double bottom pattern now confirmed. This structure signals a potential end to the recent bearish control, and price action is now pressing against the descending trendline resistance. A successful breakout here could completely flip market dynamics in favor of the bulls.
💎Following a minor round of profit-taking at the descending resistance, BONK pulled back toward the previous breakout support. That retracement brought the price right back into the key supportive range between 0.00001550 and 0.00001425, where it's now starting to bounce again. Notably, the EMA-50 has aligned perfectly with this support zone, adding strength to the reaction from this area.
💎BONKUSDT's next challenge lies at 0.00002000 to 0.00002100—a major descending resistance level that has capped upside since December 2024. Breaking above this structure would be a critical bullish breakout, potentially unleashing the next wave of upside momentum.
💎If bulls push through this barrier, BONK is expected to move toward the next moderate resistance at 0.00002500 to 0.00002750. This area aligns with the measured target of the double bottom formation. However, if bullish strength continues to build, BONK may even extend toward the strong resistance between 0.00003400 and 0.00003700, where the 50% Fibonacci retracement also resides—a historically significant level for potential trend reversals.
💎Adding to the bullish case, the 12-hour EMA-50 and EMA-200 are now converging toward a possible Golden Cross. If this cross confirms, it could serve as a major technical catalyst for a broader trend reversal and further upside continuation.
Paradisers, strive for consistency, not quick profits. Treat the market as a businessman, not as a gambler.
MyCryptoParadise
iFeel the success🌴
#BONK/USDT#BONK
The price is moving within a descending channel on the 1-hour frame and is expected to break and continue upward.
We have a trend to stabilize above the 100 moving average once again.
We have a downtrend on the RSI indicator that supports the upward move with a breakout.
We have a support area at the lower boundary of the channel at 0.00001825, which acts as strong support from which the price can rebound.
Entry price: 0.00001883
First target: 0.00001967
Second target: 0.00002078
Third target: 0.00002222

Breaking: Bonk Inu ($BONK) Spike 17% Reclaims $1 Bln Market CapBuilt and integrated in the Solana blockchain before migrating to 7 other chains, the dog-themed meme coin Bonk Inu ( SEED_DONKEYDAN_MARKET_CAP:BONK ) saw a notable uptick of 17% to reclaim the $1 Billion market cap. This was hours after its rival $FARTCOIN reclaims the $1 Billion market.
SEED_DONKEYDAN_MARKET_CAP:BONK has seen a +15964.82% uptick since listing, before retracing losing about 85% of market value. With increasing momentum, SEED_DONKEYDAN_MARKET_CAP:BONK is set to continue the bullish sojourn should the memecoin break the $0.00001555 resistant point. This point is serving as the stronghold for SEED_DONKEYDAN_MARKET_CAP:BONK albeit the general crypto market is in a bullish momentum with CRYPTOCAP:BTC , CRYPTOCAP:SOL , and CRYPTOCAP:ETH all seeing notable price upticks today.
SEED_DONKEYDAN_MARKET_CAP:BONK 's RSI is presently at 78 placing it slightly in overbought territories and also primed for a continuation trend. The asset is trading above key moving averages (MA) enroute to breaking the resistant point to pave way for a bullish campaign for $BONK.
What Is Bonk (BONK)?
According to the one-pager, BONK is the first dog-themed coin on Solana "for the people, by the people" with 50% of the total supply of the cryptocurrency airdropped to the Solana community. BONK is similar to Shiba Inu (SHIB) and Dogecoin (DOGE) memecoins, it was launched on December 25, 2022, and led to an increase in the price of the SOL token (a rise of 34% in 48 hours). Trading began on December 30, 2022, arousing genuine interest from the crypto community.
Bonk Price Data
The Bonk price today is $0.000015 USD with a 24-hour trading volume of $218,248,216 USD. Bonk is up 19.01% in the last 24 hours. The current CoinMarketCap ranking is #62, with a market cap of $1,162,183,290 USD. It has a circulating supply of 78,658,296,511,158 BONK coins and a max. supply of 88,872,433,754,423 BONK coins.

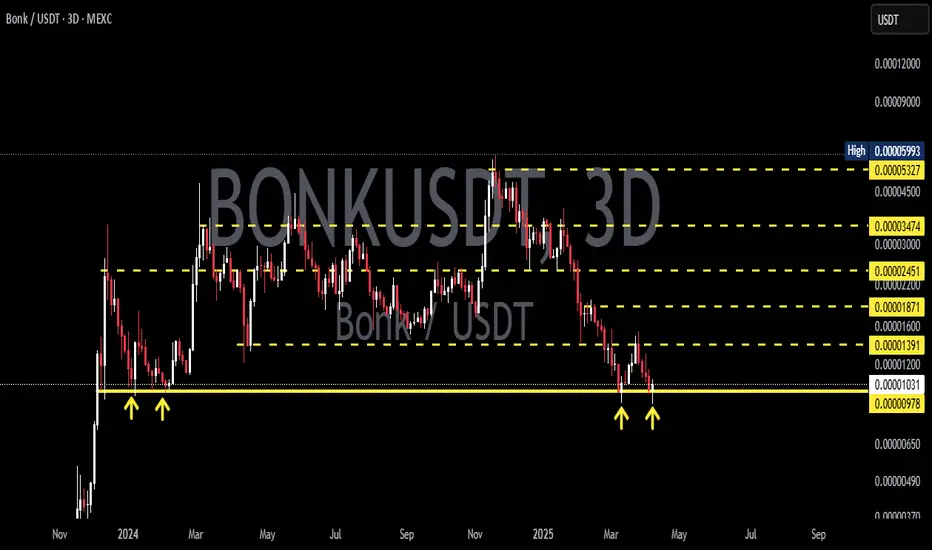
BONKUSDT 3DBONK ~ 3D Analysis
#BONK Important support that must be maintained for now. bouncing from here a short -term target of at least 15%+.
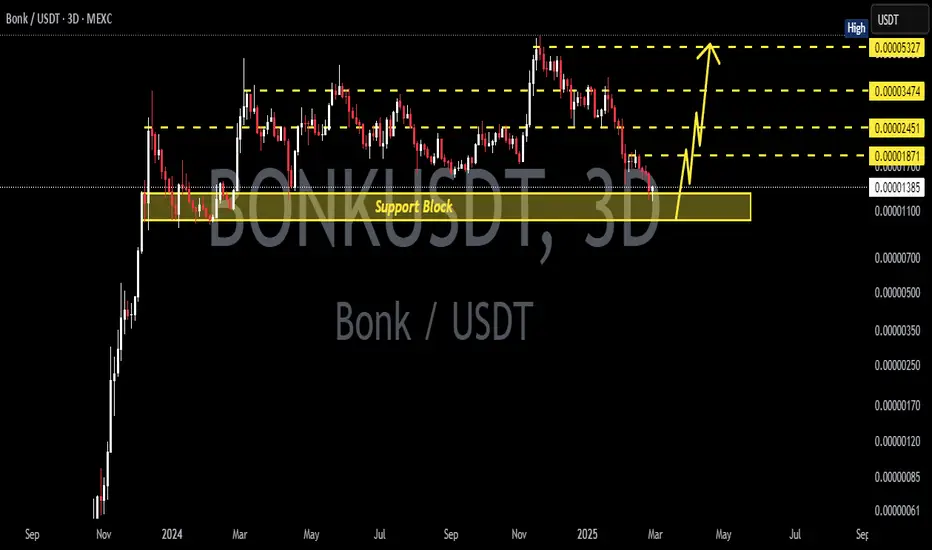
BONKUSDT 3DBONK ~ 3D Analysis
#BONK Buy gradually from here if you still have a Conviction on this coin.
Reason, This support block is still maintained.
#BONK/USDT Ready to go higher#BONK
The price is moving in a descending channel on a 1-day frame and sticking to it well
We have a bounce from the lower limit of the descending channel, this support is at 0.00002500
We have a downtrend on the RSI indicator that is about to be broken, which supports the rise
We have a trend to stabilize above the moving average 100
Entry price 0.00003350
First target 0.00003500
Second target 0.00004186
Third target 0.00004854

#BONK/USDT Ready to go higher#BONK
The price is moving in a descending channel on the 1-hour frame and sticking to it well
We have a bounce from the lower limit of the descending channel, this support is at 0.00002974
We have a downtrend on the RSI indicator that is about to break, which supports the rise
We have a trend to stabilize above the moving average 100
Entry price 0.00003107
First target 0.00003278
Second target 0.00003437
Third target 0.00003618

BONKUSDT: descending triangle breakout!! Join our community and start your crypto journey today for:
In-depth market analysis
Accurate trade setups
Early access to trending altcoins
Life-changing profit potential
Let's analyse BONKUSDT:
TECHNICAL ANALYSIS:
BONK is currently consolidating within a parallel channel. After breaking out of a descending triangle pattern and undergoing a corrective pullback, the price has found support at the 100-day EMA on the daily chart.
The previous breakout led to a significant 135% price surge, and a similar rally is anticipated as the price approaches the upper boundary of the parallel channel. Bullish crossovers in RSI and MACD indicators further support the bullish outlook for BONK.
Key Level:
Entry: CMP to $0.000033
SL: $0.000028
Leverage: 2-3x
Target:
$0.000046
$0.000055
$0.000068
$0.000089
If you find this analysis helpful, please hit the like button to support my content! Share your thoughts in the comments and feel free to request any specific chart analysis you’d like to see.
Happy Trading!!

BONK - Get ready to get BONKED!BONKUSDT - JUST PLEASE OBSERVE THE DOODLE the exact way i drawed. The cyan block if kept with good vol, ret ready for 0.00006616!


BONK - Ready to flyBONK is ready to fly, a little bit of consolidation here before it rips up! BONK/USDT

BONKUSDT Triangle Pattern!BONKUSDT technical analysis update
CRYPTOCAP:BONK price is breaking out of a triangle pattern on the daily charts. The price has been trading within this triangle pattern for the past year. If the breakout is confirmed, we can expect a strong bullish move. Over the last few days, there has been an increase in volume, which is also considered a bullish sign for BINANCE:BONKUSDT
